All papers published in this conference proceedings have been peer reviewed through a peer review process administered by the proceedings Editors. Reviews were conducted by expert referees to the professional and scientific standards expected of a conference proceedings.
Chair of the Conference
Paul Wouters
Scientific Editors
Rodrigo Costas Thomas Franssen Alfredo Yegros-Yegros
Layout
Andrea Reyes Elizondo Suze van der Luijt-Jansen
The articles of this collection can be accessed at https://hdl.handle.net/1887/64521
ISBN: 978-90-9031204-0
© of the text: the authors
© 2018 Centre for Science and Technology Studies (CWTS), Leiden University, The Netherlands
Comparative analysis of patent-paper citations of five countries based
on new indicators
Yasuhiro Yamashita* and Mari Jibu**
*[email protected]; [email protected]
Office of Research Program Strategy, Japan Science and Technology Agency, K’s Gobancho, 7, Gobancho, Chiyoda-ku, Tokyo 102-0076 (Japan)
1st Policy-Oriented Research Group,National Institute of Science and Technology Policy (NISTEP), Ministry of
Education, Culture, Sports, Science and Technology (MEXT), 3-2-2, Kasumigaseki, Chiyoda-ku, Tokyo 100-0013 (Japan)
Introduction
Paper citations presented in patent documents (hereafter patent-paper citation) are an indicator of “knowledge flows” from science to technology. Patent-paper citations can be analyzed from not only the patent-side but also the paper-side.
The analysis from the patent-side is relatively easy to introduce because it does not need identification of each cited paper. Therefore, it has been relatively widely executed in many previous studies. Narin and Noma (1985) utilized the reference data of US patents, and analyzed the characteristics of referencing, including non-patent literature. One of the major inventions of Narin and his colleagues was an indicator named “science linkage”, the number of papers referenced in patents per patent (such as Narin, 1991). Science linkage has been widely used for measuring scientific intensity of technology (e.g., Zhao & Lei, 2013; Sung, Wang, Huang, & Chen, 2015; Guan & He, 2007).
Alternatively, analyses of patent-paper citations from the paper-side have been executed in parallel with the analyses from the patent-side. Narin and his colleagues (such as Narin, Hamilton & Olivastro 1997 and McMillan, Narin & Deeds 2000) analyzed features of cited papers in detail, such as journals, authors’ affiliations, and research funds. Branstetter and Ogura (2005) explored a factor of occurring patent-paper citations from both patent- and paper-sides. Recently, Fukuzawa and Ida (2016) analyzed the relationship between paper-paper citations and patent-paper citations (in their words, “paper-patent citations”), and Ahmadpoor & Jones (2017) regarded three types of citation - patent-patent, paper-paper, and patent-paper - as a huge network, analyzing its characteristics from both patent- and paper-sides.
Although these studies revealed many features concerning patent-paper citations, development of an indicator of patent-paper citation from the paper-side seemed rare. However, demand for indicator has been increasing. For example, Japan launched a five-year plan for science and technology: the 5th Science and Technology Basic Plan in 2016. “Scientific papers cited in
patents” was set as one of the monitoring indicators of the plan. So, indicators available at the macro (country) level aggregation are indispensable.
characteristics of patent-paper citations. However, to what extent these indicators are useful to compare countries that have different patent systems is still unknown. In this study, we try to compare major countries from the view of patent-paper citations using worldwide patent data, and examine the characteristics of indicators.
Data and Method
We used two kinds of indicators we recently developed for the evaluation of technological impacts of major countries’ scientific research: the Patent-Paper Citation Index (PPCI) and the High-Feature-Valued Patent Paper Citation Index (HFPPCI).
In our study, we used Patstat 2016 spring edition, produced by the European Patent Office as data source of patents, and used Web of Science, produced by Clarivate Analytics, which contained data of papers published between 1981 and 2015 as that of papers. All non-patent literature contained in the reference table were checked against all paper data in the WoS.
Process and counting method of paper data
All papers in the WoS were classified into the 22 scientific disciplines of the Essential Science Indicators of Clarivate Analytics. Papers classified in “Multidisciplinary” were re-classified into 21 other disciplines based on their both forward and backward paper-paper citations. Papers that could not be re-classified into the 21 disciplines were excluded from the analysis since they had almost no citation and it was not suitable to compare citations within a “Multidisciplinary” discipline. This study aimed for international comparison of patent-paper citations, so papers that indicated no country were excluded from the study as well.
Number of papers was fractionally counted by country, so if n countries appeared in a paper, 1/n of the contribution was attributed to each country.
Process of patent data
Patents were counted by the DOCDB patent family to avoid a duplicate count of the same invention filed in different patent offices. The earliest filing date of the patent applications consisting of each patent family was deemed as the filing year of the family. Only patent families that contained patents (IPR type=’PI’ and application kind=’A’) and had a WIPO’s technology classification (Schmoch 2008) were included in the study.
Indicator for overview, both scientific and technological impact (PPCI)
In the previous study, we introduced a new indicator for the technological impact of papers named Patent-Paper Citation Index (PPCI). PPCI aimed for overviewing both the scientific and technological impact of papers by combining Normalized Citation Impact (Thomson Reuters, 2014). PPCI was defined as the ratio of two rates: the rate of papers cited by patents of the target and of the world. PPCI was calculated by weighting both fields and document types as NCI, since these factors affect tendencies of patent-paper citations. Values of PPCI can vary from 0 to infinity; in this study, we normalized them from -1 to 1 by calculating (PPCI2-1)/(PPCI2+1).
Values of NCI were also normalized in the same way.
Indicator of contribution to high-feature-valued patents
STI Conference 2018 · Leiden
the index was “claims” that were not comprehensively included in Patstat, so we could not use them for our study. Threshold values to distinct high-feature-valued patents were set so that the number of high-feature-valued patents was almost identical to each other for three feature values. We set the threshold value of patent-patent forward citations to top 1% in each technology field in WIPO’s technology classification, and the number of papers cited in the top 1% patents was used as the reference value for setting threshold values of high feature-valued patents. As a result, threshold values of patent family size and high generality index were set to (equal or more than) 15 and 0.85, respectively.
Although our previous study revealed the fact that the tendencies of patent-paper citations differed by document types and disciplines (Yamashita 2018), we did not apply the weighted mean of HFPPCI to each document type and discipline for the calculation of the whole country’s value, since papers cited in high-feature-valued patents shared only about 1.2% in our sample, and division by a document type and discipline yielded too small (or zero sized) sub-samples in some cases.
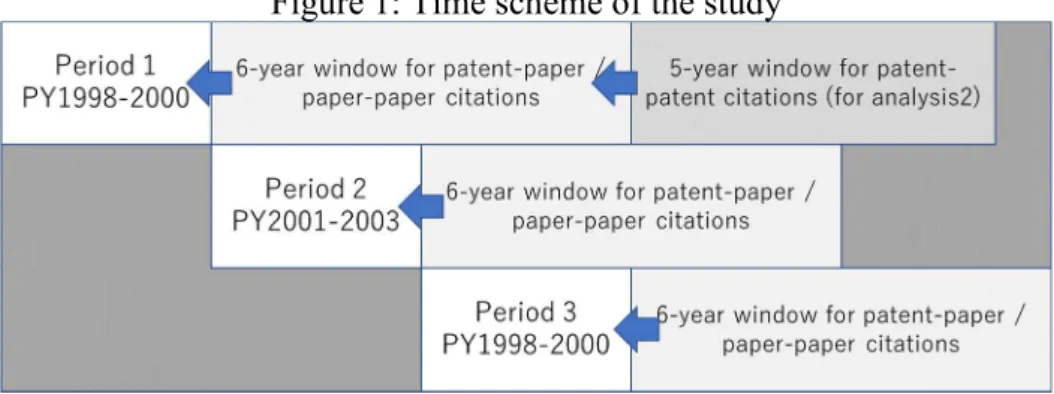
Time scheme
We established a six-year citation window (max seven years, including publication year of the paper) for both patent-paper and paper-paper citations based on our previous study. Although we had paper data since 1981, we only used those published between 1998 and 2006 to secure enough time for measurement and to show the newest data as far as possible. Publication years were classified into three periods: Period 1 (1998-2000), Period 2 (2001-2003), and Period 3 (2004-2006).
In the second analysis, we utilize patent-patent citations for calculating feature values of citing patents. For this purpose, we set a five-year citation window; 11 years in total were needed for the analysis. It was impossible to secure an entire 11 years for each period; analysis 2 was executed only for period 1.
Figure 1: Time scheme of the study
Selection of target countries
We analyzed the five countries (the United States, Japan, Germany, the United Kingdom and mainland China) of which number of papers published between 1998 and 2006 was the largest in the world.
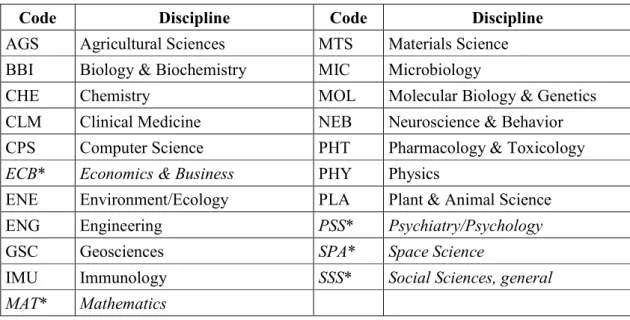
Disciplinary classification
Table 1. List of disciplines in the study
Result
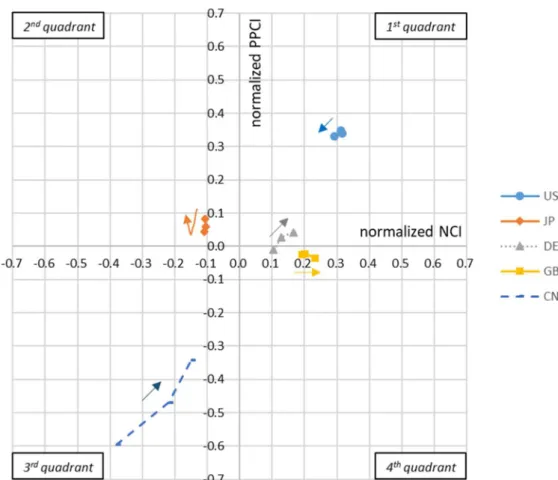
Overview of scientific and technological impacts of the five countries (analysis 1)
Figure 2 shows both the scientific (NCI) and technological (PPCI) impacts of five major countries. The United States showed remarkable impact for the scientific and technological aspect. Japan seemed to be specialized in technological impact. Two European countries, Germany and United Kingdom, showed relative strength in scientific aspects; however, they showed contrasting trends in the technological aspect compared to each other. Germany improved its technological impact from below to above the world average for three periods, while the United Kingdom stayed below the world average. China was located in the 3rd
quadrant, in which both scientific and technological impacts were below average; however, it showed remarkable improvement for three periods.
Next, we show detailed profiles of the top three of the five countries using the same method. Figures 3, 5 and 6 shows the scientific and technological impacts of the top three countries in Period 3 by discipline. The sizes of the circles designate the number of papers of each discipline. The United States showed remarkable tendencies in that all disciplines were located in the 1st
quadrant (Figure 3). The US especially showed remarkable strength in Chemistry, Computer Science, Materials Science, and Physics, while it showed relatively moderate strength in life sciences, such as Clinical Medicine and Molecular Biology & Genetics for both aspects of science (NCI) and technology (PPCI). However, this distribution was partially caused by the US’s remarkably large publication share in each discipline. In such cases, as publication shares get larger, values of both indexes tend to converge to the world average (Figure 4).
As for Japan, only Immunology was located on the 1st quadrant; therefore, Japan produced
relatively high impact papers from the aspects of both science and technology (Figure 5). Seven disciplines were located on the 2nd quadrant, and two - Environment/Ecology and Plant &
Animal Science - showed remarkably high values of PPCI.
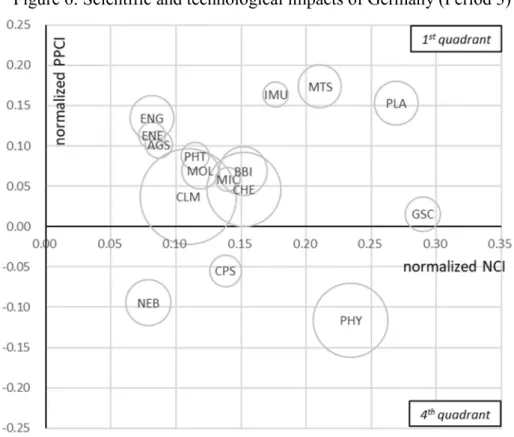
Germany showed contrasting distribution. All disciplines were located on the 1st or 4th
quadrants; therefore, they produced a relatively high scientific impact on papers, but their technological impacts differed by discipline (Figure 6). In Materials Science and Plant & Animal Science, they showed high impacts in the aspect of both science and technology. They showed relative technological strength in Engineering and Environment/Ecology within the country. In Physics, they showed remarkable strength in the scientific aspect, but relatively low impact in the aspect of technology.
Code Discipline Code Discipline
AGS Agricultural Sciences MTS Materials Science
BBI Biology & Biochemistry MIC Microbiology
CHE Chemistry MOL Molecular Biology & Genetics
CLM Clinical Medicine NEB Neuroscience & Behavior
CPS Computer Science PHT Pharmacology & Toxicology
ECB* Economics & Business PHY Physics
ENE Environment/Ecology PLA Plant & Animal Science
ENG Engineering PSS* Psychiatry/Psychology
GSC Geosciences SPA* Space Science
IMU Immunology SSS* Social Sciences, general
STI Conference 2018 · Leiden
Figure 2: Scientific and technological impacts of the five countries from period 1 to 3
Figure 4: Relationships between publication shares of papers and PPCI (the United States, Period 3)
STI Conference 2018 · Leiden
Figure 6: Scientific and technological impacts of Germany (Period 3)
Contribution to high-feature-valued patents (analysis 2)
The HFPPCIs of the five countries are shown in Figure 7. HFPPCI=1 means the value was at the world average. The United States showed relatively high values for three feature values. Their papers tended to be more cited than the world average, so they also had more chance to be cited by high-feature-valued patents than the world average. Three countries, - Japan, Germany and the United Kingdom -, showed values of HFPPCIs around world averages. The HFPPCIs of Japan were slightly below the world averages for three feature values, while those of Germany were almost identical to the world average. Only the United Kingdom showed relatively high HFPPCI value for “large family”. China showed HFPPCI values much lower than the world averages for all patent feature values.
HFPPCIs indicate relative tendencies to be cited in high-feature-valued patents, but their values do not show whether the targets tend to be more or less cited in high-feature-valued patents than in all patents. To know such relative citedness, the rate of papers cited in high-feature-valued patents in papers cited in patents is shown in Figure 8. Although the United States showed remarkable relative citedness from all three kinds of high-feature-valued patents in Figure 7, it showed average level citedness from large-family-sized patents in Figure 8. The United Kingdom showed relatively high citedness from large-family-sized patents. Even though the United States showed relatively high citedness from high-feature-valued patents for the other two feature-values in Figure 8, deviations from world averages became smaller than that shown in Figure 7. Conversely, China showed remarkable
large extent. However, China showed a relatively high rate of citations from patents with high generality, and a low rate of citations from patents of large-sized-family.
Figure 7: HFPPCIs of the five countries (Period 1)
Figure 8: Rates of papers cited in high-feature-valued patents in papers cited in patents of the five countries (Period 1)
Discussion and Conclusion
In this study, we applied two indicators that were useful to visualize technological impact of scientific research on a macro level. Our study revealed the remarkably high impacts of the United States, regardless of its tremendous publication shares. Also, the remarkably rapid improvement in the scientific and technological impacts of China was shown.
STI Conference 2018 · Leiden
In the second analysis, we applied HFPPCI to the publication data of major countries. It also shed light on the United States’ remarkable high indicator values. The result showed the relatively low indicator values of China. However, as shown in Figure 2, China had been rapidly improving its research impact in the aspects of both science and technology, so our result should not represent the current statuses of the country. China also showed remarkable tendencies for the rates of papers cited from high-feature-valued patents in that of cited from patents; it tended to be more cited from patents of high generality index, while less cited from that of large family size. In order to grasp the cause, it is necessary to analyze the patents citing China’s papers in detail.
Two of three kinds of HFPPCI, which we showed in the study, inevitably need long time periods for observation of patent-patent citations. It might be a bottleneck for the application of indicators. To shorten observation periods, feature values that do not need information on patent-patent citations, like patent family size, should be introduced.
References
Ahmadpoor, M. & Jones, B. F. (2017). The dual frontier: Patented inventions and scientific advance. Science, 357:583-587.
Branstetter, L. & Ogura, Y. (2005). Is academic science driving a surge in industrial innovation? Evidence from patent citations (NBER Working Paper, No. 11561). Retrieved from National Bureau of Economic Research website: http://www.nber.org/papers/w11561
Guan, J. & He, Y. (2007). Patent-bibliometric analysis on the Chinese science-technology linkages. Scientometrics. 72(3), 403-425.
Narin, F. & Noma, E. (1985). Is Technology becoming science? Scientometrics, 7(3-6), 369-381.
Narin, F. (1991). Globalization of research, scholarly information, and patents–ten year trends.
The serials librarian, 21(2-3), 33-44.
Narin, F., Hamilton, K. S. & Olivastro, D. (1997). The increasing linkage between U.S. technology and public science. Research Policy, 26, 317-330.
Narin, F. & Olivastro, D. (1998). Linkage between patents and papers: An interim EPO/US comparison. Scientometrics, 41(1-2), 51-59.
Squicciarini, M., Dernis, H. & Criscuolo, C. (2013). Measuring patent quality: Indicators of technological and economic value, OECD Science, Technology and Industry Working Papers, 2013/03, OECD Publishing, Paris. DOI: 10.1787/18151965.
Sung, H. Y., Wang, C. C., Huang, M. H. & Chen, D. Z. (2015). Measuring science-based science linkage and non-science-based linkage of patents through non-patent references.
Journal of Informetrics, 9:488-498.
Thomson Reuters (current Clarivate Analytics). (2014). InCites Indicator Handbook. Retrieved September 20, 2017 from http://ipscience-help.thomsonreuters.com/inCites2Live/8980-TRS/version/default/part/AttachmentData/data/InCites-Indicators-Handbook-6%2019.pdf.