0
NBA Twitter: A ‘Slam Dunk’ as a Public Relations Tool for Sports Organizations
By
Margaret Engellenner
Senior Honors Thesis
Public Relations – School of Media and Journalism The University of North Carolina at Chapel Hill
April, 2016
Approved:
Lois Boynton, Thesis Advisor
______________________________ Joe Bob Hester, Reader
Abstract
The rise of social media coupled with advancements in technology and communication
have been altering the way in which organizations manage their public relations and
communicate with their stakeholders and audiences. As a result, organizations have increasingly
become compelled to communicate with stakeholders via new media channels - such as social
media - rather than traditional sources - like television, radio, newspapers, and magazines - to
reach and capture the attention of the largest number of stakeholders as possible. Advancements
in technology and communication have consequently altered the expectations of stakeholders:
Concise, creative, and quickly communicated messages have become an essential practice of
successful public relations. Sports organizations, like the NBA, have been paving the way by
embracing these new innovative means of communication. This study coded a sample of tweets
sent from the official Twitter account of the NBA along with six official accounts of its
franchises to identify types of content they shared, and how their Twitter efforts reflected
characteristics of public relations to build relationships with their stakeholders. The results of this
study indicate that the NBA and its franchises most frequently tweeted out content for the
purposes of entertainment and information sharing, and those types of tweets also received the
Acknowledgements
I’d like to dedicate this thesis to my mother and my father, both of whom have provided
me with endless support and encouragement, and to my brother who has challenged me
academically for as long as I can remember. I am so thankful for my mom – for her
unconditional love and willingness to bend over backwards for me, and for her kind, but
sometimes hard to hear, words of wisdom – and for my dad, for being my biggest fan, and for
sharing with me his passion for sports. I’d be nothing without you all.
Thank you to both Professor Hester and Dr. Johnston for your guidance and support with
the framework of my thesis. And last but certainly not least; I’d also like to thank my amazing
thesis advisor, Lois Boynton, who kept me motivated, confident and - moreover - sane. Without
you, this thesis would not have been possible.
Table of Contents Abstract……….. Acknowledgements……… CHAPTER ONE__________________________________________________________________ Introduction……….……….. Literature Review……….….………
Sports Public Relations
Twitter: A Public Relations Tool
Building Relationships, Facilitating Conversation and Developing a Brand Image Twitter: A Sports Public Relations Tool for the NBA
Methodology…….………
Twitter Selection Account Selection Message Selection Coding Guidelines
Coder Training and Calculating Intercoder Reliability Coding Procedures
CHAPTER TWO________________________________________________________________ Results…….……….………
Overview
Common Categories of Content Activity of Accounts
Information Sharing Interactivity
Promotional Entertainment Other
Presence of a Picture, Video or Graphic
Discussion……….………
Overview
Levels of Interactivity
Impact of a Picture, Video or Graphic Trends
Summary and Best Practices
CHAPTER ONE Introduction
Sports public relations has been made even more interesting by the recent rise of new
media sources coupled with the growing popularity of social media. The goal of sports public
relations is two-fold: to develop and maintain a strong brand image and to forge a positive
relationship with an organization’s key stakeholders (L’Etang, 2012). This means that sports
public relations practitioners are responsible for the overall brand image of an organization as
well as ensuring that any news is clearly communicated with its audiences in a timely manner.
While in the past sports public relations relied heavily on press releases, press conferences, and
media events, the means by which sports organizations represent themselves and disseminate
their news is rapidly changing with the growing popularity of social media. In general, audiences
are moving away from traditional news sources like television, radio, newspapers, and
magazines, and they are turning to new media sources, such as Twitter (McCorkindale &
Distaso, 2014).
It appears that sports fans still want to track developments in sports organizations, but
they also have a set of requirements; they want their news to be in a concise, creative package,
and they expect to get it quickly as it happens (Kolodzy, 2012). This demand for virtually
instantaneous news is changing the way sports organizations reach and interact with their various
audiences, but Twitter has proven to be an extremely effective means of achieving this goal. The
platform design of Twitter enables multiple communication channels to open up the conversation
for almost instantaneous distribution of information as well as allowing a two-way stream of
communication (Kietzmann, Hermkens, McCarthy, & Silverstre, 2011). But, more importantly,
in one feed. Key stakeholders of sports organizations want concise news, and Twitter gives its
users only 140 characters to convey a message. Key stakeholders of sports organizations want
creative news; Twitter offers its user the opportunity to incorporate emojis, pictures, videos, and
gifs into their messages. And, key stakeholders of sports organizations want news fast; Twitter
creates a live-updating newsfeed of information where the newest information appears first and
at the top of the feed. Reports and research continue to support the notion that organizations,
which disseminate information with their stakeholders, should turn to Twitter to attract the
attention of the greatest number of people possible because of its platform design, and its
audience of over 304 million active worldwide Twitter users as of February 2015 (Ramos, 2014;
“Twitter,” 2015). Even with its extensive user base, it is impossible for organizations to reach
stakeholders that do not utilize the platform, but – more than any other type of user – sports fans
are 67 percent more likely to use Twitter (as cited inBurns, 2014).
Sports organizations are doing their best to push the boundaries of Twitter’s capabilities,
but, interestingly enough, the ‘most popular’ North American Sports League is not the ‘most
popular’ on Twitter. In terms of average brand value and average franchise value, the National
Football League (NFL) and Major League Baseball (MLB) rank first and second, respectively,
but the National Basketball League has 3.8 million more Twitter followers than the NFL and
12.32 million more Twitter followers than the MLB (“Brand Finance,” 2013; “Fan Page List,”
2013a; “Fan Page List,” 2015b; Fan Page List,” 2015c). In 2012, the NBA was the first premier
sports league to reach five million Twitter followers, and has increased its following by 252
percent, reaching 17.6 million followers to date (“Fan Page List,” 2015a). Such a significant
following suggests that the NBA and its franchises are doing something right, and that Twitter is
audiences include the commissioner, NBA executives, broadcast executives, league officials,
NBA players, sponsors of the NBA and its teams, as well as the fans.
The purpose of my research was to investigate how the NBA and its franchises are
utilizing Twitter as a public relations tool and, specifically, as a means of building relationships
and brand awareness with their audiences. The goal of this research was to uncover what specific
public relations practices propagate the most interaction between stakeholders of the NBA and
its teams. The study analyzed the Twitter accounts of the NBA and six geographically dispersed
NBA teams, based on highest number of wins in each division, during a two-month timeframe.
After analyzing the Twitter platforms and practices of each team by means of content analysis, I
identified how these sports organizations use Twitter to communicate with their stakeholders.
The following section defines key concepts for this thesis within the realms of social media and
Literature Review
New communication tools are changing the roles and responsibilities of public relations
practitioners. This section provides a foundation for defining sports public relations in general, as
well as addressing how new tools of communication, specifically Twitter, are changing the
landscape of public relations. It is also important to consider the value in this enhanced
communication, and the second section of this thesis addresses its significance. Since Twitter
and other social media offer organizations the ability to interact and converse with their
audiences, it is essential to establish the value of relationship and brand building. Hence, the
third section defines and discusses the use of relationship management theory, dialogic
communication, and how social media extends the use of these two concepts.
Sports Public Relations
In short, public relations practitioners are responsible for building and maintaining a
brand image of a company or organization by building lasting and trusting relationships with its
key stakeholders through various communication channels. Sports public relations is a specific
niche channel of public relations in which the role of the public relations professional
encompasses more of a mixed marketing and promotional role, in addition to the
relationship-building duties of public relations (L’Etang, 2012). Public relations professionals in the sports
industry specifically handle issues related to organizational development, issues management,
media relations, community relations, publicity, marketing communication, and promotion
(Lattimore, Baskin, Heiman, & Toth, 2012). One of the most-significant portions of a sports
public relations professional’s role focuses on ensuring that all messages, internal and external,
are supportive of the sports organization’s brand image. Maintaining a strong and positive brand
(L’Etang, 2012). Framing provides a structured means to aggregate communications (Lattimore,
Baskin, Heiman, & Toth, 2012). Entman (1993) describes framing as such:
“Framing essentially involves selection and salience. To frame is to select some
aspects of perceived reality and make them more salient in the communicating
text, in such a way as to promote a particular problem definition, casual
interpretation, moral evaluation and/or treatment recommendation for the item
described.” (p. 55)
Framing is essential to public relations because it provides the framework to establish “common
frames of reference” (Hallahan, 1999, p. 207), which ensure the messages that are disseminated
by public relations professionals are more likely to be interpreted by the audience in the context
that they were designed to be interpreted. Hallahan (1999) asserts that frames place messages
within a confined context of interpretation, which reduces the likelihood that messages will be
misinterpreted while also leading recipients toward specific deductions. Sam Weber (2015),
Marketing Coordinator of Opendorse, discusses how social media and communication experts’
public relations efforts encompass storytelling; their goal is to distribute information about an
organization in an effort to share their ‘story.’
The concepts behind framing and storytelling are largely intertwined. Public relations
professionals utilize a form of framing called story framing, which involves creating a narrative
from which to disseminate focused, strategic, and thematic messages (Hallahan, 1999). Most
commonly, framing utilizes contextual cues—biasing audiences to come to a certain
conclusion—and priming, which draws on the learned experiences of individuals to elicit a
predictable response. In both cases, the devices are used to eliminate confusion and ambiguity
particular context and by guiding key stakeholders’ perception of the messages, public relations
practitioners are setting their organization up for branding success.
Framed messages are directed at the stakeholder audience, and one of the most-important
management issues in public relations is the stakeholder relationship. Stakeholders are the
internal and external stakeholders who interact and are involved in the organization in some
regard. Freeman (1984) defines a stakeholder as, “any group or individual who is affected by or
can affect the achievement of an organization’s objectives” (p. 46). But, in sports public
relations, another more-specific definition by Freeman can be applied, which states that a
stakeholder is “any identifiable group or individual on which the organization is dependent for its
continued survival” (Freeman, 1984; 1983). Internal stakeholders are part of the organization,
while external stakeholders have an interest in the organization, but aren’t directly employed by
them. Both internal and external stakeholders of sports organizations hold incredible value in
sports public relations because they are, in general, extremely impassioned and vocal about the
organizations in which they have an interest and have a direct or indirect role in the financial
success of the organization. For this reason, it is important that sports public relations
practitioners identify their key stakeholders, determine their relationship to the organization, and
prioritize those key stakeholders by the respective strength and value of their relationships
(Rawlins, 2006).
One of the best means for public relations practitioners to manage their stakeholder
relationships is by applying systems theory, which can be defined as a means of thinking about
an organization’s relationships with its stakeholders within an accommodating, open systems
approach, or a rigid, closed system manner (Lattimore, Baskin, Heiman, & Toth, 2012). The
they are open to interact with their key stakeholders to gain feedback on the value of their
relationship. The open systems model fits extremely well for sports organizations that are willing
to be part of the larger environment and be open to feedback from that environment. The open
system lays the groundwork for strong relationships because they are built on mutual trust and
understanding that the organization’s brand image is not confined by the bounds of its internal
stakeholders. By this definition, social media has the potential to act as another means of
furthering an organization’s relationships to its key stakeholders, and can thereby be utilized as a
tool for public relations.
Twitter: A Public Relations Tool
Twitter, in its most-simplest terms, is a micro blogging site, though it proclaims itself an
information network (Java, Song, Finin, & Tseng, 2007). The concept behind the platform is
fairly straightforward: you become an active user by creating an account and searching for the
accounts of other entities in which you may have an interest: people, businesses, organizations,
celebrities. You connect with these users by following them, which allows you to automatically
see the content that they post. Once you have connected with another account, their tweets
(posted account) will appear on your timeline, or your stream-designed Twitter homepage. As
the tweets of the accounts that you follow appear on your timeline, you have the opportunity as a
user to engage with them by means of Twitter interactions, which can occur in the forms of a
favorite (an endorsement of a tweet), a retweet (a rebroadcast of a another user’s tweet) or a
reply (a message associated with a particular tweet). But following people is not the only way to
see information that you are interested in; you can also search Twitter or explore trending
aggregating information surrounding about a similar topic of discussion. (For a more in-depth
description of Twitter lingo, see Appendix I).
More recently, Twitter has updated its platform to improve its search and information
organization capabilities (Chief, 2015). In early 2015 Twitter purchased Periscope, which is the
first step Twitter took towards creating a more-organized live-tweeting experience and
conversation surrounding specific events (Barthel, Shearer, Gottfried, & Mitchell, 2015).
Periscope is an app that enables its users to experience a place or an event through a live video
stream (“Periscope,” 2015). More recently, Twitter has been pushing to make further
advancements to the news web services it offers, by developing a feature called ‘Project
Lighting’ that is designed to more easily promote conversation surrounding events of national or
worldwide significance. This new functionality launched as ‘Moments’ as a new feature in its
app on October 6, 2015. Twitter’s Global Media Operations Director Katie Jacobs Stanton
referred specifically to NBA events in an interview with Buzzfeed:
“We’ve seen in the past that we have so much conversation around events,”
Stanton explains. “The Oscars, or the NBA Finals. Breaking news events like
Ferguson. Memes like Alex From Target. … But the challenge we’ve had over
the years is, although we have the world’s greatest content, it’s like having a
television without a channel guide or even a remote control. There’s no way to
really find it or contextualize that content. So [Project Lightning] is this beautiful
vessel for us to surface great content and make it more delightful.” (Chief, 2015)
She also emphasized that Twitter is working towards giving stakeholders the ability to share a
greater part in the conversations that occur between organizations and their stakeholders on
such as Periscope and Moments, only further strengthen Twitter’s capabilities as a tool for public
relations because they aggregate all these loose threads around common themes; these tools help
loosely organize threaded tweets by serving as a virtual magnet to which tweets can adhere. In
some ways, it is an attempt to bring order to a mess of information to ensure that organization’s
messages are being heard and that their tweets are being seen, which is a first step in building
relationships with audiences.
Building Relationships, Facilitating Conversation and Developing a Brand Image
The importance of relationships in public relations has been stressed for years, but was
elevated when the public relations professional’s role shifted from one-way publicity to the
larger role of strategically organizing and distributing communications. After public relations
had been recast as a management function, public relations practitioners were given greater
responsibility to administer the organization’s connection to its key stakeholders (Ledingham,
2001). Ferguson (1984) really underscored the importance of not only understanding the
organizations and stakeholders as separate entities, but also the complex “social environment in
which they both exist” (as cited in Ledingham, 2001, p. 287). The transformed responsibilities of
the public relations practitioner and view of organizational relationships led to measurement
tools and models for monitoring and measuring those relationships. And, it is vital that these
interactions are monitored since building relationships can be challenging because people may
have negative views and express them publicly in social media. Regardless, these strategies and
definitions were developed in an attempt to measure the quality of organization-public
relationships and eventually developed into models to help professionals better predict the
behavior of their stakeholders (Ledingham, 2001). Understanding how stakeholders will react
because it establishes a common ground. An organization’s ability to identify what information
its stakeholders expect to see (and are interested in) helps them to create a sphere of
communication that is beneficial for both the organization and its stakeholders.
Building and maintaining relationships is also one of the fundamental pillars of sports
public relations. Clear communication and conversation are vital to ensure that a sports
organization’s key stakeholders stay informed and feel involved, and it starts with relationship
management. Relationship Management Theory can be defined as, “how to build toward
symmetry (managing organizational–public relationships around common interests and shared
goals) and when to apply that approach (over time)” (Ledingham, 2003, p. 192). According to
Ledingham there are five key dimensions to relationship management: trust, openness,
involvement, investment, and commitment. Trust is vital to relationship management because it
determines the relationship’s value for both parties involved. If the NBA sends a tweet saying
that Stephen Curry and the Warriors have broken the record for the league’s franchise record for
a team’s winning streak, the fans need to trust that the information is accurate. To develop and
maintain a good relationship, organizations must gain the trust of their external stakeholders by
keeping them informed and being open and honest about the information they disseminate.
Openness is extremely important in sports public relations because if the Warriors plan to sit
Stephen Curry for a game because his hand is hurt, fans must be able to trust that information
will be shared with them before game time so they aren’t blindsided by seeing him on the bench.
More than anything, stakeholders in sports public relations want to feel involved, and
organizations can further that commitment through investment of time and money. The
involvement, investment, and commitment prongs in Relationship Management Theory can all
(Ledingham, 2003). The NBA and its franchises can accomplish this by hosting events or
appearances, in which players buy holiday presents for families in need, visit children’s
hospitals, or build playgrounds in underprivileged communities. Relationship Management
Theory stresses that successful relationships are developed when the relationships are mutually
beneficial; stakeholders organizations keep their audience informed and invest necessary
resources to keep audiences feeling involved, and in return, receive positive feedback and
promotion of their brand image. Ledingham states that, “the key to managing successful
relationships is to understand what must be done in order to initiate, develop and maintain that
relationship” (p. 27).
Attention to the five dimensions of relationship management gives organizations the
greatest potential to form strong relationships with their stakeholders. For a sports organization
like the NBA, the key stakeholders include the commissioner, NBA executives, broadcast
executives and the media, league officials, and NBA players, sponsors of the NBA and its teams,
as well as the fans. It is vital that the NBA spends time to manage and build their relationships
with each of these respective groups, and Twitter has provided the means to do so for a large
population of its stakeholders.
Social media enables the organizations to build and facilitate relationships and
conversation with stakeholders in a way that has never been done before (Ramos, 2014). It offers
brands, companies, and organizations the power of two-way interaction and the ability to connect
directly to their audiences if they chose to do so (Lattimore, Baskin, Heiman, & Toth, 2012). In
particular, Twitter is a significant advancement for organizations to manage stakeholder
relationships and communicate with those stakeholders who utilize Twitter. While audiences are
the opportunity for engagement, which is defined by the Social Media Measurement Standards
Conclave (2013) as, “some action beyond exposure, and implies an interaction between two or
more parties. Social media engagement is an action that typically occurs in response to content
on an owned channel” (p. 6). In discussion of the changing effects of social media on brand
relationships, engagement is often paired with the term “conversation,” which is defined by
McCorkindale and DiStaso (2014) as, “some form of online or offline discussion by customers,
citizens, stakeholders, influencers, or other third parties. Social media conversations include
online discussions about your organization, brand or relevant issues, whether via your channel or
third party channels” (p. 6). Social media has prompted organizations to both engage and
converse with their stakeholders, and both are crucial to maintaining positive public perceptions
through dialogue.
Kent and Taylor (2002) have discussed the importance of dialogical communication in
public relations for almost fifteen years, distinguishing five important aspects: mutuality, or the
“acknowledgment that organizations and publics are inextricably tied together;” propinquity,
meaning that organizations consult their stakeholders in matters of influence to them and
stakeholders are able and willing to articulate their comments and concerns; empathy, or “the
atmosphere of support and trust;” risk, or the “potential to produce unpredictable and dangerous
outcomes;” and commitment, or a genuine and authentic promise to build and support the
relationships through conversation (Kent & Taylor, 2002, p. 25, p. 26; Heath, 2001, p. 135). All
five dimensions of dialogic communication pair well with the capabilities of Twitter as a tool for
public relations. Twitter provides organizations and their stakeholders with the outlet to clearly
both ends but, in the end, demonstrates each party’s commitment to building and maintaining the
relationship.
Dr. Jimmy Sanderson, who incorporates social media into his classes in media and
journalism at Clemson University, was quoted as stating, “Twitter is a powerful relational tool;
it’s real power lies in building and developing relationships” (Burns, 2014). Twitter has, in many
ways, revolutionized the public relations communication process because it has afforded
organizations and their key stakeholders a platform upon which to exchange thoughts, ideas,
news, and experiences. While an organization forgoes full control over the conversation, its
audience gains the opportunity to feel connected to the organization they hold interest in.
Though Twitter may diminish an organization’s power to dictate the direction of conversation, it
offers an immense opportunity to strengthen their brand image. By allowing an organization’s
key stakeholders to participate in the conversation on Twitter, organizations can monitor the
discussion and receive insight into how key stakeholder perceive their organization and what
specific content interests them most. Users on Twitter have more of an opportunity to participate
in the conversation and offer their own opinions and commentary than ever before. Ramos
(2014) referred to Twitter as being like a backyard gathering – a lot of people may attend but
every conversation might not reach the majority of the people in attendance, and it can permit a
variety of viewpoints. In contrast, he referred to Twitter as the Egyptian Revolution. “Everyone
mills around in chaos. Everything goes out to everyone on all sides; friends, enemies,
demonstrators, the government, the army, journalists, and the rest of the world” (Ramos, 2014, p.
6). Twitter offers organizations the opportunity to reach the greatest number of people with
opportunity for organizations to engage their stakeholders and strengthen their brand image.
Relationship management is vitally important to public relations, and it should be treated as such.
In summary, Leichty and Springston (1993) discuss the complications of relationship
theories by stating, “what we need is a theory that tells us when and how to build toward a
two-way symmetrical exchange between organizations and publics” (p. 335). According the
Ledingham (2003) relationship management theory is the answer because it recognizes that,
“public relations balances the interests of organizations and publics through the management of
the organization-public relationships… and is consistent with the notions that public relations
initiatives should generate understanding and benefit both for the organizations and publics.” (p.
181). Ledingham (2001) identified four essential components of the relational perspective:
recognizing the importance of relationships in public relations, reframing public relations as a
function of management, investigating the attitudes, preconceived notions and behaviors that can
influence perceptions of the organization-public relationship, and creating a model that fits those
perceptions. With these foundations established, the next section looks at how Twitter may help
sports organizations build and maintain stakeholder relationships.
Twitter: A Sports Public Relations Tool for the NBA
Twitter caters to its users interests. The ‘About” page of Twitter highlights the title
phrase, “Twitter is your world. Get real-time updates about what matters to you.” And, if you
scroll down, the next section highlights an NBA tweet sent back in May 2015 of Chris Paul
making an amazing shot off the glass (“Twitter About,” 2015): “Nothing but net happens here.
When you need to know what’s going on—in your town or across the globe—get the best of
adept at the nuances of sports communication, which include informational messages that
promote interactivity, humor, and entertaining content (Weber, 2015).
Twitter is especially important in sports public relations because it provides an open
forum in which fans and the media can commune (Ramos, 2014). Users can stay up to date on
sports news, follow game highlights, and spark conversation without ever having to leave a
webpage. According to Christian Alfonsi, Executive Vice President of Strategic
Communications at Taylor PR:
“Social media, especially on mobile devices, provides sports fans with their own
global network, and they have been using this power in unprecedented ways to
express and share their passion for their favorite sports. Digital, social media and
mobile technology are also driving innovation in brand sponsorship activations
around major sports properties, offering marketers a vast array of channels for
engaging with consumers. The power of sports to entertain and inspire us will
continue to make it the most powerful vehicle for driving consumer engagement
with brands.” (Alfonsi, 2014, p. 13)
In summary, Twitter is extremely valuable as a public relations tool because of its vast
number of users and unique capabilities. While research has investigated the use of Twitter as a
tool for public relations, there has been little focus on its effectiveness in the realm of sports
public relations. Research conducted by Kent and Taylor (2002) found that Twitter’s design for
interconnectivity—building relationships, facilitating conversation, and developing a brand
image—is what renders it so powerful. But, Twitter enables an organization to connect and
interact with their audiences when it is utilized to its full potential, which solidifies it as a
active on Twitter (Nielsen, 2013). Mark Wysocki (2012) examined the role of social media in
sports communication strategy by interviewing NBA social media strategists about their
respective strategies across all social media platforms. Wysocki (2012) developed a ‘best
practices’ guide, which articulates the social media strategies employed the NBA and its
franchises. While there has been little investigation of sports organizations’ strategies for using
Twitter since this report, there has been research conducted in an attempt to define how athletes
utilize Twitter and communicate with their audiences, separate from the influence of the NBA
and its franchises. Hambrick (2010) found that the majority of athletes’ tweets are primarily
targeted towards fans or friends or are otherwise unrelated to sports, and roughly 15 percent of
tweets sent by athletes are related to their team or particular sport. And, while it is generally
supported that Twitter is an effective tool of public relations and a powerful tool of
communication for athletes, there exists a gap in research regarding Twitter as a tool for sports
organizations. My research bridges this gap and is an attempt to support the claim that Twitter is
an effective tool for public relations in the sports industry because it helps sports organizations
fulfill their duties of public relations, along with marketing and promotions (L’Etang, 2012). In
addition, my research defines what type of content garners the most fan interactivity, including
favorites, replies, and retweets by examining the official Twitter account of the NBA along with
the accounts of six of its franchises. It was interesting not only to see why the NBA and its
franchises have the highest following of any US sports league on Twitter, but also what
similarities and differences exist between the content of tweets from each account. This study
[RQ1]: What type of content do the NBA and its franchises share with their audiences on Twitter?
[RQ1a]: What similarities exist between the content of tweets from each of the accounts?
[RQ1b]: What differences exist between the content of tweets from each of the accounts?
[RQ2]: What type of content sent by the NBA and its franchises via Twitter garners the most interaction with other Twitter users?
[RQ2a]: Does the presence of a picture, video or graphic influence the level of interactivity a tweet experiences?
[RQ3]: Which tweet topic categories rank highest in value for the average number of retweets and favorites, and what might that suggest about what the NBA
Methodology
With the recent application of Twitter as a tool for sports public relations, it is important
to understand what types of content garner the most interaction with a sport’s organizations key
stakeholders. For this study in particular, the goal was to investigate how the NBA and its
franchises use Twitter to build relationships and brand awareness with their audiences. Content
analysis was selected for its ability to provide “systematic, objective, quantitative analysis of
message characteristics” (Neuendorf, 2002, p. 2) that enable the researcher to make sense of and
recognize commonalities among diverse content (Patton, 2002).
The content analysis tracked the type of information, content, pictures, and videos being
shared with stakeholders, as well as the amount of interactivity - favorites, replies, and retweets –
of the official Twitter account of the NBA as well as the Twitter accounts of six of the 30 official
NBA team franchises, over the course of a two-month time period. I chose to monitor a total of
seven accounts – the official NBA account and six of its franchises – to develop a broad
overview of NBA Twitter, ensuring that the six franchises selected were geographically
dispersed throughout the country.
Twitter Selection
Twitter was selected for this particular study both because of its popularity among NBA
fans and its ease of use (Nielsen, 2013). The design of Twitter creates a unique platform from
which organizations can inform, communicate, and receive feedback from their intended
audiences. People use Twitter as a microblogging site to “seek and share information” as part of
an easily accessible online community (Java, et al., 2007). Over the past few years, Twitter has
become ingrained in the world of sports, especially basketball. According to the Nielsen Year in
NBA fans are 66 percent more likely than the average adult to have used Twitter in the past
month (Nielsen, 2013).
The NBA employs Twitter specifically to engage its 34 and younger audience,
considering that that demographic makes up 45 percent of its viewing audience. NBA fans also
participate in and monitor Twitter while watching games. Nielsen (2013) reported that 26.7
million tweets were sent over the 2013 NBA Final series, while only 17.7 million fans watched
the telecast on ABC. The final game of the NBA finals between the Heat and Spurs prompted
1.9 million users to send over 7.3 million tweets. The number of tweets also exceeded the
number of viewers in the 2014 NBA Finals Series in 2014 (Nielsen, 2014). The Nielsen 2013
Year in Sports reported that, “Social media has fast become the new “water cooler” for fans to
connect about the latest sports topics, prompting teams, leagues, advertisers and brands to take
notice of the medium’s powerful connection with sports fans. And in 2013, fans and non-fans
alike took to Twitter to dish on NBA games, positioning the league to have five of the ten
most-Tweeted games in 2013” (p. 9).
Account Selection
In order to complete an in-depth content analysis, I reviewed and monitored the official
Twitter account of the NBA and six of its 30 franchises (seven Twitter accounts in total) over a
two-month period. I chose to review the official Twitter account of the NBA because it is the
most-followed sports organization in the United States (“Twitter,” 2015). I then selected to track
six NBA franchises that had the highest number of wins in each division as of December 1,
2015, ensuring that were geographically representative of the league. NBA franchises are divided
The Atlantic, Central, and Southeast Division make up the Eastern Conference, and the
Northwest, Pacific, and Southwest Division make up the Western Conference (See Table 1.0).
§ TABLE 1.0 - Eastern and Western Conference Percent Wins in 2015
(NBA Standings, 2016)
EASTERN CONFERENCE W L W%
Atlantic Division
Toronto 11 7 .611
Boston 10 8 .556
New York 8 10 .444
Brooklyn 4 13 .235
Philadelphia 0 18 0
Central Division
Cleveland 13 4 .765
Indiana 11 5 .688
Chicago 10 5 .667
Detroit 9 9 .500
Milwaukee 7 11 .389
Southeast Division
Atlanta 12 8 .6
Miami 10 6 .625
Charlotte 10 7 .588
Orlando 9 8 .529
Washington 6 8 .429
WESTERN CONFERENCE W L W%
Northeast Division
Oklahoma City 11 7 .611
Utah 8 8 .500
Minnesota 8 9 .471
Portland 7 11 .389
Denver 6 12 .333
Pacific Division
Golden State 19 0 1.00
L.A. Clippers 10 8 .556
Phoenix 8 9 .471
Sacramento 7 12 .368
L.A. Lakers 2 14 .125
Southwest Division
San Antonio 14 4 .778
Memphis 10 8 .556
Dallas 10 8 .556
Houston 7 11 .389
To ensure the six accounts selected for the content analysis were geographically
dispersed throughout the country, I chose the team with greatest number of wins in each
conference from each division as of December 1, 2015. When a tie was present, I then selected
the team with the higher winning percentage. I chose to rank the teams by the greatest number of
wins because Mullin, Hardy, and Sutton (1993) suggest, although it’s not the only thing that
matters, winning undoubtedly helps teams to build an audience. After listing each of the 30
franchises and their wins and winning percentages, I selected the accounts of the following six
franchises to monitor: Toronto Raptors, Cleveland Cavaliers, Atlanta Hawks, Oklahoma City
Thunder, Golden State Warriors, and San Antonio Spurs.
Message Selection
To ensure accuracy and efficiency, the unit of analysis for the study was every available
tweet or “Twitter message” posted since the beginning of the NBA regular season, which kicked
off Tuesday October 27, 2015. The timeframe of this study was the two-month period from
October 27, 2015 to December 27, 2015, and a representative random week was utilized.
According to Riffe, Aust, and Lacy (1993), the researcher’s goal “is to sample enough issues to
achieve an "acceptable" estimate of unknown population parameters, while maximizing
efficiency of time and effort” (p. 133) and for newspapers, simple random sampling through a
constructed week achieves that goal. In standard news constructed week sampling, two
constructed weeks are typically utilized to represent a year’s worth of information (Riffe, 1993,
p. 139). And, although this study encompasses a much smaller timeframe (only one-sixth of a
year), one constructed week was selected to ensure that each day of the week was represented in
some capacity. Since research into the effectiveness of constructed weeks in Twitter sampling is
the impact. And, although there are always limitations caused by sampling – not seeing every
piece of information – it is the most-effective means of evaluating large amounts of data.
The random week was constructed by assigning every specific weekday a sequential
number. The first Monday was assigned one, the second Monday was assigned two, and the
same principle was applied to each day of the week. A random number was then generated seven
times to choose which of the Sundays, Mondays, Tuesday, etc., within the October 27, 2015 to
December 27, 2015 timeframe would be chosen to represent that specific day of the week within
the randomly generated constructed sample week. Table 1.1 shows the sample week that
resulted.
§ TABLE 1.1 - Constructed Week
SUNDAY MONDAY TUESDAY WEDNESDAY THURSDAY FRIDAY SATURDAY
11/22/15 11/9/15 12/15/15 12/9/15 11/19/15 11/27/15 11/21/15
All Tweets that resulted from each of the seven Twitter accounts on the seven days that were
selected were then compiled. Coders used Qualtrics to record information about each tweet,
which included the date, account, content category, presence of a photo or video, the number of
favorites, retweets, and replies that each individual tweet received. It is important to note that I
only investigated tweets that originated from and were published by each specific account,
disregarded retweets, but included quoted retweets (in which original content accompanies an
already existing tweet) for the purposes of my research. And, since I did not (and could not) get
access to the Twitter analytics of each of these accounts, I determined levels of interactivity and
measured how well audiences perceived tweets by the number of favorites, replies, and retweets
each tweet received.
Though constructed week sampling has yet to be proven as an effective means of
the greatest extent possible, the number of tweets in the constructed sample was compared to the
average number of tweets in a week for each of the seven Twitter accounts. The average number
of tweets a week was calculated by using monthly tweet results, which were gathered from
TweetStats. That number was divided by 4.3 or the average number of weeks per month; the
results are shown in Table 1.2.
§ TABLE 1.2 - Comparison of Number of Average Weekly Tweets to Constructed Week
(Cortesi, 2016)
The similarity between the total number of tweets in the average week (n=1,119) and the total
for a constructed week (n=1,038) suggests that the constructed week could be a representative
sample. In addition, utilizing a constructed week sample eliminates bias that could occur
otherwise if one particular week (consecutive days) was utilized for the purpose of this research
(Riffe, Aust, & Lacy, 1993, p. 137).
Coding Guidelines
A complete guidebook for coding (see Appendix II) was created prior to the process of
data collection along with a comprehensive description of categories for coding based on tweet
topic (which can be found in Appendix III). I examined other similar sports communication
studies, particularly the Hambrick et al. (2010) study, “Understanding Professional Athletes’ Use
of Twitter,” to identify he types of tweets that are generated. Average # of Tweets
a Week
# of Tweets in Constructed Week
NBA 411 275
Toronto 150 172
Cleveland 115 118
Atlanta 95 110
Oklahoma City 83 115
Golden State 191 119
San Antonio 74 129
Five categories of tweet types were used: Information Sharing, Interactivity, Promotional,
Entertainment, and Other. Table 1.3 below provides the description of each category.
Additionally, the coder then distinguished whether a picture video or graphic was present in each
tweet (See Table 1.3, see also diagram in Appendix III).
§ TABLE 1.3 - Tweet Topic Categories
Category Description
Information sharing Notify, update and inform its intended audience of a specific
event, situation or decision
-Information sharing about
an athlete
Single player information
-Information sharing about a
franchise
Franchise and its decisions, records, performance and
updates about business and legal decisions. Also can include content about team members/more than one player
Interactivity Retweeting, quote tweeting, mentioning, and replying to
other users’ content
-Interactivity with other
athletes/organizations/media
Quote tweet, mention, or reply initiated by one the NBA's franchises with other athletes, franchises, organizations, media and/or media personnel in a conversational tone
-Interactivity with fan Quote tweet, mention, or reply) that is initiated by the NBA
or one of its franchises with a fan, identified as someone not well known
Promotional Ticket sales, game times, upcoming games, goodwill efforts,
community outreach programs, giveaways and/or contests
Entertainment Engaging or amusing its audiences. Highlights a specific
photo, video or graphic highlighting an impressive or comical play or statistic. The use of an emoji or reference to current culture
Coder Training and Calculating Intercoder Reliability
To ensure the effectiveness of the Coding Guide and intercoder reliability, I employed the
assistance of one other coder. According to Riffe et al. (2005), intercoder reliability is essential
in content analysis and can be accomplished through five steps: determining the scope of the
reliability check, creating a protocol, selecting a sample, conducting the intercoder reliability test
and then assessing the results. Defining the scope of intercoder reliability was accomplished by
reviewing the categories for coding to ensure they are clearly outlined (See Appendix III). The
protocols and guidelines for coding tweets are outlined in Appendix II, and the sample for the
purposes for testing intercoder reliability is defined as all tweets sent from the official NBA
Twitter account on Sunday, November 22.
Both coders independently coded the tweets of the official NBA Twitter account on
Sunday, November 22, and then compared results to ensure that both coders had applied the
coding guidelines consistently. Each of the coders reviewed the guidelines for coding to resolve
any potential discrepancies in interpretation prior to the intercoder reliability testing. After each
coder had independently coded, they convened to compare results and perform the intercoder
reliability test. The number of agreed upon tweets, or tweets that both coders placed into the
same categories, appear in the diagonal blue boxes in Table 1.4.
Intercoder reliability testing can be deemed successful if the reliability value is between
0.67 and 0.8, which indicates that the categories for coding were clearly defined, separate and
distinct, and that each coder could reliably place tweets in their appropriate categories. A
reliability test called Cohen’s Kappa was used to calculate the probability of chance agreement.
Riffe et al. (2003) say Cohen’s Kappa is a slightly more reliable version of Scott’s Pi when the
diagonal blue boxes of Table 1.4, to show the number of tweets the two coders agreed upon, and
then dividing by the total number of tweets evaluated. (The NBA account from November 22,
2015 served as the test for intercoder reliability.
§ TABLE 1.4 - Number of Tweets for Each Account Separated by Coding Category
CODER A Marginal
Sum Information sharing: athlete-centered Information sharing: franchise-centered Interactivity with other athletes/orgs/ media Interactivity with fans
Promotional Entertainment Other
Information sharing: athlete-centered
13 Cm1
13
Information sharing: franchise-centered
2 10 Cm2
12
Interactivity with other athletes/orgs/ media
0 Cm3
0
Interactivity
with fans 0 Cm4
0
Promotional 2 1 Cm5
3
Entertainment 5 Cm6
5
Other 0 Cm7
0 Marginal
Sum Rm1
17 Rm2 10 Rm3 0 Rm4 0 Rm5 1 Rm6 5 Rm7 0 33
There were 33 tweets in the sample, and the coders agreed on 27 out of the 33 tweets. Observed
agreement was calculated with this formula: po = ((13 + 10 + 0 + 0 + 1 + 5 + 0)/33) = 0.879.
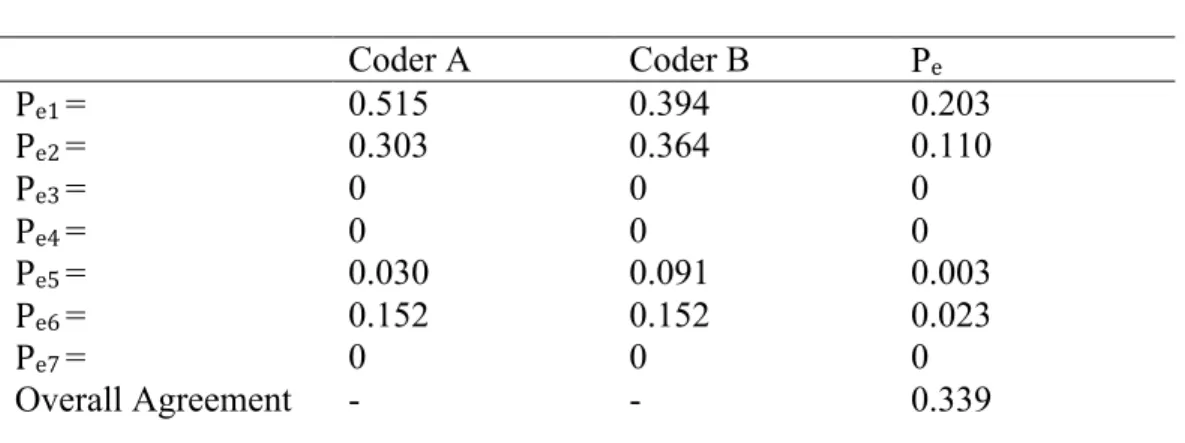
McHugh (2012) then explains that the expected agreement is calculated by using the
expected (chance) agreement formula:
Table 1.5 shows the expected agreement for each of the seven categories.
§ TABLE 1.5 - Coding Expected Agreement (pe)
Coder A Coder B Pe
Pe1 = 0.515 0.394 0.203
Pe2 = 0.303 0.364 0.110
Pe3 = 0 0 0
Pe4 = 0 0 0
Pe5 = 0.030 0.091 0.003
Pe6 = 0.152 0.152 0.023
Pe7 = 0 0 0
Overall Agreement - - 0.339
After both observed agreement (po) and expected agreement (pe) were calculated for all seven
categories, the values were inserted into the formula for Cohen’s Kappa to calculate reliability:
((po – pe)/(1– pe)) = ((0.879 – 0.339)/(1– 0.339), where po is observed agreement and pe is
expected agreement. The test resulted in 0.817 for the Cohen’s Kappa index value, which
surpasses the value of 0.67 to 0.80 that reflects a reliable level of intercoder reliability
(Krippendorff (2004). As a result, the rest of the tweets within the sample could be coded with
intercoder confidence.
Coding Procedures
After a reliable and consistent level of intercoder reliability was achieved, a random
number generator was used to allocate the remainder of the sample for coding. Each of the seven
days and seven accounts was represented in a table and assigned a number, one through
forty-nine. The NBA Twitter account from November 22, 2015 served as the measure for intercoder
reliability, (and then five randomly generated numbers (roughly 10 percent of 49 sets of
accounts) were assigned to the second coder. The remainder of the sample set was the
highlighted in blue, the content for coder two is highlighted in yellow, and the green box
represents the intercoder reliability sample that was evaluated by both coders:
§ TABLE 1.6 - Number of Tweets for Each Account Separated by Coding Category
Sun
11/22 Mon 11/9 12/15 Tues Wed 12/9 Thurs 11/19 11/27 Fri 11/21 Sat
NBA Toronto Cleveland Atlanta
CHAPTER TWO Results
Overview
The purpose of this study was to investigate how the NBA and its franchises are utilizing
Twitter as a public relations tool and, specifically, as a means of building relationships and brand
awareness with their audiences. The sample included the NBA Twitter account and six of the
thirty NBA franchises as a representative sample of geographically dispersed teams throughout
the US and Canada. Each of the NBA’s six divisions: Toronto Raptors, Cleveland Cavaliers,
Atlanta Hawks, Oklahoma City Thunder, Golden State Warriors, and San Antonio Spurs. For the
purposes of data collection and analysis, a constructed week was utilized to examine the content
of the seven designated Twitter accounts. The sample week was constructed using a random
number generator to select which particular day would be utilized to represent each day of a
week in the constructed week sample during a two-month timeframe from October 27, 2015
through December 27, 2015. The constructed week that resulted was Sunday November 22,
Monday November 9, Tuesday December 15, Wednesday December 9, Thursday November 19.
Friday November 27, and Saturday November 21.
All Twitter account data were gathered and coded in February and March of 2016. From
the constructed week for each of the seven accounts, a total of 1,038 Tweets were analyzed to
determine what content the NBA and its franchises share on Twitter as well as the level of
engagement, which particular categories of content garner among Twitter users. Content was
classified into seven distinct categories: Information Sharing that is Franchise-Centered,
Information Sharing that is Athlete-Centered, Interactivity with Media, Athletes or Other
were placed into one of these separate but distinct categories, the results of which can be seen in
Table 2.0.
§ TABLE 2.0. Number of Tweets for Each Account Separated by Coding Category (n=1,038)
Common Categories of Content
Of the 1,038 tweets that were monitored, 392 tweets (37.76 percent) fell into the
Information Sharing that is Franchise-Centered category, followed by 24.66 percent (n=256)
Information Sharing that is Athlete-Centered category, 184 (17.73 percent) tweets fell into the
Entertainment Category, 10.22 percent (n= 106) was Promotional, 4.05 percent (n=42) was
classified as Interactivity with Fans, and finally 2.79 percent (n=29) of tweets were Interactivity
with Athletes, Organizations and/or Media as well as the category of Other (see Figure 2.0).
o FIGURE 2.0 - Number of Tweets in Each Coding Category (n=1,038)
Information Sharing
Interactivity Promotional Entertainment Other Total
# Athlete-Centered Franchise-Centered With Athl./ Orgs/Media With Fans
NBA 76 110 3 2 19 64 1 275
Raptors 46 72 7 12 11 19 5 172
Cavaliers 24 38 3 3 28 17 5 118
Hawks 21 29 10 16 13 14 7 110
Thunder 42 38 1 1 13 16 4 115
Warriors 26 21 2 2 16 31 1 119
Spurs 21 64 3 6 6 23 6 129
All Accounts 256 392 29 42 106 184 29 1,038
0 50 100 150 200 250 300 350 400 450
Interactivity with Athletes, Organization and/Other
Interactivity with Fans Promotional
Entertainment Information Sharing: Athlete-Centered Information Sharing: Franchise-Centered
The high number of tweets within the Information Sharing that is Franchise-Centered
category may be a result of game updates. As the coding guidelines and coding sheet outline,
game updates of scores and other relevant content fell under this category, which would indicate
that a high volume of tweets are cast during games. The second most-prevalent category was
Information Sharing that was Athlete-Centered. The content of tweets within this category
commonly highlighted a certain player’s performance within a game or across games, a player’s
post-game perspective, or post-game interview.
Activity of Accounts
For the purposes of this study, the average number of tweets sent in a day from one
account compared to the other six accounts was utilized to determine the level of activity of each
of the seven accounts (see Table 2.1).
§ TABLE 2.1 - Number of Followers and Tweets per Day
Tweets were then separately and distinctly classified into seven categories. After tweet
classification was complete, the average of the number of retweets and favorites for each of the
tweets classified into a specific category was calculated for each of the seven categories. What
resulted were the overall mean values for retweets and favorites for the seven topic categories,
which is showcased in Table 2.2. Additionally, Tables 2.3 through 2.9 provide the means of each
category for the seven individual accounts.
Account Twitter Handle Number of Followers
(in millions)
Tweets per Day
NBA @NBA 20.1 M 71.2
Toronto @Raptors 0.996 M 33.1
Cleveland @Cavs 1.06 M 14.3
Atlanta @ATLHawks 0.481 M 41.3
Oklahoma City @okcthunder 1.21 M 12.8
Golden State @warriors 1.47 M 30.4
The number of followers for each account should correlate with interactions that a tweet
has the potential to receive, because the more followers the account has, theoretically, the more
people who can see and potentially react to that tweet. This expectation is evident by examining
the official Twitter account of the NBA and the Twitter account of the Golden State Warriors,
the two accounts with the greatest number of followers relative to the other five accounts. They
typically garnered the greatest number of retweets and favorites (see Tables 2.2 through 2.9).
The two accounts had the highest mean values for retweets and favorites across the majority of
coding categories, with the exception of the mean of favorites and mean of retweets in the
Interactivity with Athletes/Other Organizations/Media category, and the mean of favorites in the
Other category. Though retweeting could potentially increase the set of Twitter users that see the
tweet beyond the set of followers, follower numbers have the most-direct influence on potential
interactions. For example, if the NBA account, with 20.1 million followers, sends out a tweet, it
will most likely garner a number of interactions that would be much greater than if the same
tweet came from the Atlanta Hawks account, which has a following of 481,000, because
conceivably more people see the tweet when it comes from the NBA account. Although this
study did not gather any concrete data to support or disprove the effect of the number of
followers on interactions, it is important when analyzing the data to consider that follower
numbers might have a bearing on the number of retweets and favorites a tweet receives.
§ TABLE 2.2. Category Mean Values Across All Accounts
Mean of Retweets Mean of Favorites
Information Sharing: Franchise-Centered 180.71 341.59
Information Sharing: Athlete-Centered 167.31 300.52
Interactivity with Athletes/Orgs./Media 35.97 92.41
Interactivity with Fans 16.07 57.57
Promotion 76.53 216.96
Information Sharing
The Information Sharing categories include tweets to notify, update and inform the
intended audiences of a specific event, situation, or decision. One subcategory addressed
information sharing about a single athlete, and an example appears below:
(Retrieved from Twitter, 2016)
Another subcategory focused on information sharing about a franchise, and an example follows:
(Retrieved from Twitter, 2016)
The NBA and the Golden State Warriors led the Information Sharing categories levels of
interactivity. Despite having a smaller following than the NBA, the Golden State Warriors had
Sharing/Franchise-Centered category. The NBA account had the second-highest mean of
retweets (338.29) and favorites (595.45) (see Table 2.3). The Golden State Warriors also
captured the highest mean value for retweets (526.20) and favorites (923.71) in the Information
Sharing/Athlete-Centered category. The NBA was a distant second in both retweets (201.65)
and favorites (383.42) (see Table 2.4).
§ TABLE 2.3 - Information Sharing: Franchise-Centered
Mean of Retweets Mean of Favorites
NBA 338.29 595.45
Toronto Raptors 26.28 67.80
Cleveland Cavaliers 99.21 230.17
Atlanta Hawks 31.67 71.29
Oklahoma City Thunder 102.38 172.26
Golden State Warriors 340.54 738.62
San Antonio Spurs 149.71 267.38
All Accounts 180.71 341.59
§ TABLE 2.4 - Information Sharing: Athlete-Centered
Mean of Retweets Mean of Favorites
NBA 201.65 383.42
Toronto Raptors 41.25 78.78
Cleveland Cavaliers 87.05 178.29
Atlanta Hawks 57.10 91.52
Oklahoma City Thunder 89.61 135.16
Golden State Warriors 526.20 923.71
San Antonio Spurs 163.91 273.72
All Accounts 167.31 300.52
Interactivity
The Interactive categories included retweets, quote tweets, mentions, and replies to other
users’ content. The first subcategory included interactivity with other athletes, organizations,
(Retrieved from Twitter, 2016)
The second subcategory focused on interactivity with fans, and an example of a tweet follows:
(Retrieved from Twitter, 2016)
The mean values for the Interactive categories is led by the official NBA Twitter account for
both Interactivity with Athletes, Media and Organizations (mean retweets of 134, mean favorites
of 248.67 – see Table 2.5) as well as Interactivity with Fans (mean retweets of 91, mean
favorites of 249 – see Table 2.6). For Interactivity with Athletes, Media and Organizations, the
San Antonio Spurs and the Oklahoma City Thunder follow the NBA account for the highest
mean value of retweets (42.67 and 40, respectively), while the Cleveland Cavaliers (161.33), the
San Antonio Spurs (153), and the Oklahoma City Thunder (122) trail the NBA account for the
highest mean value of favorites (see Table 2.5).
In contrast, the category of Interactivity with Fans reinforced the pattern of the NBA and
the Warriors leading the mean values for both retweets (91 and 59, respectively) and favorites
(249 and 150 respectively). For mean values of retweets and favorites the San Antonio Spurs and
the Cleveland Cavaliers followed the NBA and the Warriors with the next highest values (see
§ TABLE 2.5 - Interactivity: With Athletes, Media, Organizations
Mean of Retweets Mean of Favorites
NBA 134.00 248.67
Toronto Raptors 22.86 57.43
Cleveland Cavaliers 50.67 161.33
Atlanta Hawks 13.70 38.30
Oklahoma City Thunder 40.00 122.00
Golden State Warriors 12.00 42.00
San Antonio Spurs 42.67 153.00
All Accounts 35.97 92.41
§ TABLE 2.6 - Interactivity: With Fans
Mean of Retweets Mean of Favorites
NBA 91.00 249.00
Toronto Raptors 6.92 26.58
Cleveland Cavaliers 24.33 82.00
Atlanta Hawks 4.00 14.88
Oklahoma City Thunder 0.00 0.00
Golden State Warriors 59.00 150.00
San Antonio Spurs 25.83 136.17
All Accounts 16.07 57.57
Promotional
The promotional category contained information about purchasing tickets/gear as well as
community outreach programs or incentives that were spearheaded by the NBA or its franchises.
The mean values for both retweets and favorites for the Promotion category are led by the NBA
(196.58 retweets and 533.58 favorites), followed by the Golden State Warriors (107.63 retweets
and 387.19 favorites) and then the San Antonio Spurs (see Table 2.7).
§ TABLE 2.7 – Promotion
Mean of Retweets Mean of Favorites
NBA 196.58 533.58
Toronto Raptors 22.09 74.45
Cleveland Cavaliers 39.21 104.86
Atlanta Hawks 31.92 60.62
Oklahoma City Thunder 46.31 102.38
Golden State Warriors 107.63 387.19
San Antonio Spurs 49.50 131.83
All Accounts 76.53 216.96
Entertainment
The Entertainment Category, which included tweets that were intended to entertain or
amuse the targeted audiences, consistently had the highest number of retweets and favorites
across all seven accounts. An example of an entertainment-oriented tweet appears below:
The NBA and the Golden State Warriors, however, yielded mean values for retweets and
favorites that were significantly greater than the rest of the five accounts. The mean value for
both accounts in retweets and favorites hovered above a thousand for the NBA retweets
(1093.83) and favorites (1389.80) and the Golden State Warriors for retweets (1210.06) and
favorites (1603.65 - see Table 2.8).
§ TABLE 2.8 – Entertainment
Mean of Retweets Mean of Favorites
NBA 1093.83 1389.80
Toronto Raptors 146.68 258.32
Cleveland Cavaliers 244.00 410.35
Atlanta Hawks 82.57 147.07
Oklahoma City Thunder 268.56 416.31
Golden State Warriors 1210.06 1603.65
San Antonio Spurs 403.30 609.43
All Accounts 702.07 941.74
Other
Topics that did not align with the categories above were coded as “Other.” These topics
included promotion for other businesses or sponsors as well as tweets that contained text with no
context, sometimes accompanied by an emoji (examples appear below).
(Retrieved from Twitter, 2016)
(Retrieved from Twitter, 2016)
The Golden State Warriors and the NBA led the Other category in mean values for retweets and
§ TABLE 2.9 – Other
Mean of Retweets Mean of Favorites
NBA 338.00 207.00
Toronto Raptors 30.20 124.00
Cleveland Cavaliers 75.60 183.40
Atlanta Hawks 25.86 47.71
Oklahoma City Thunder 38.75 122.75
Golden State Warriors 677.00 983.00
San Antonio Spurs 117.67 264.83
All Accounts 89.17 171.55
However, because tweets that didn’t distinctly fit into any of the six content-specific categories
were sorted into since the Other category, that category ultimately contained a wide range of
content, and therefore can’t necessarily serve as a reliable sample for mean values related to
content.
Presence of a Picture, Video, or Graphic
The presence of pictures, video or graphics was tracked for all seven Twitter accounts in
this study. The purpose of monitoring the presence of a picture, video, or graphic is twofold:
first, to determine how many of tweets contain a picture, video, or graphic, and second, as an
available metric for determining whether the presence of a picture, video or graphic affected the
level of interactivity the tweet received.
Overall, the majority of tweets from all accounts, with the exception of the Toronto
Raptors, contained a picture, video, or graphic. Across all seven accounts 755 tweets contained a
picture, video, or graphic, and 283 did not, which is a ratio of 2.67 to 1 tweets (see Table 2.10).
Additionally, the analysis shows that tweets coded in five of the seven topical categories
included a picture, video, or graphic. Only Interactivity with Fans and Other had fewer tweets