TEMPERATURE DEPENDENT INCREASE IN CROSS OVER
FREQUENCY IN Arabidopsis thaliana
Scott Marshall Lewis
Principle Investigator: Dr. Gregory P. Copenhaver Research Advisor: Dr. Jennifer Modliszewski
A thesis submitted to the faculty at the University of North Carolina at Chapel Hill in partial fulfillment of the requirements for graduating with Honors in the Department of Biology in the
College of Arts and Sciences.
Chapel Hill 2014
Approved by:
_____________________________
Introduction:
Meiotic recombination is crucial not only for generating genetic diversity, but also the proper segregation of chromosomes [2, 4]. Crossovers that occur between paired homologous chromosomes during meiosis are a key component of meiotic recombination. Through reciprocal exchange of genetic information, crossovers generate genetic diversity. Crossing over also establishes physical connections between homologous chromosomes (homologs) called chiasmata, which ensure paired homologs resist being pulled to either spindle pole until anaphase I of meiosis, the point in meiosis I when homologous chromosomes segregate, thus reducing the chances of aneuploidy (missing or additional chromosomes). Model organisms like
Arabidopsis thaliana are useful for studying these process because they have abundant meioses which can be easily assayed. Understanding these processes in plants has additional practical importance with respect to crop breeding. By understanding how crossing over is regulated, desirable traits from one line, such as increased disease resistance or increased crop yield, may be more easily introgressed into another line that lacks these traits but possesses other suites of desirable traits.
Meiotic recombination is initiated by DNA double-strand breaks (DSBs) in one of the homologous chromosomes present during meiosis. These programmed DSBs are thought to be resolved by one of two mechanisms [10]. Both ends created in DSBs are processed to produce 3 single stranded tails that can invade non-sister chromatids to form a displacement loop (D-loop). Following DNA synthesis from the invading 3-hydroxyl end, the D-loop expands and hybridizes
to the second single-stranded 3 tail at the adjacent DSB in a process called second-end capture. A recombination intermediate called a double-Holliday Junction (dHJ) is formed and cut by endonucleases to eventually form a crossover (CO). This pathway is called the double-strand break repair (DSBR) pathway [12]. Alternatively, DSBs can be repaired by the synthesis dependent strand annealing (SDSA) pathway. SDSA also begins with a DSB, proceeds through strand invasion, D-loop formation and extension, but instead of second-end capture the invading strand dissociates and re-anneals to the other single-stranded tail and gap-synthesis followed by ligation fills in any missing DNA. The result of SDSA is a non-crossover [12].
whereby an existing CO can reduce the likelihood of a second CO occurring nearby. Type I interference-sensitive COs, are the most frequent class of COs identified in yeast, plants and mammals, and are dependent on set of factors called ZMM proteins [11]. Type II COs account for the minority of COs that occur in yeast, plants and mammals and are interference-insensitive [9].
The impetus for this project stems from earlier work by Francis et al. (2007)that demonstrated CO frequency in Arabidopsisis influenced by temperature. The study found that increasing temperature resulted in an elevated number of COs [8]. Because interference-sensitivity is dependent on physical proximity of prior COs and Type II COs are not subject to interference our hypothesis is that the temperature-induced COs are produced by the Type II or interference-insensitive pathway.
In this study, the model plant A. thaliana will be used to further investigate the molecular nature of the temperature-dependent crossover increase. One of the benefits of working with Arabidopsisis that we can assay COs directly in pollen grains, which are produced in large quantities [8]. The Arabidopsis quartet1-2 (qrt1-2) mutation retains the four products of each meiosis in a group of four pollen grains (a tetrad) [8]. The Copenhaver laboratory has generated a collection of plants that express fluorescent marker proteins in the pollen using the qrt1-2
-/-genetic background [8]. The lines containing both the fluorescent transgenes in the qrt1-2
-/-genetic are called Fluorescent Tagged Lines (FTLs). The FTLs utilized in this project are heterozygous for pairs of fluorescent transgenes, AmCyan and dsRed2, that define genetic
intervals on chromosome 1 or 3. Tracking the expression patterns of these fluorescent markers in pollen tetrads reveals how the loci that encode them are segregating and how often
recombination occurs between them.
The broad goal of this research is to determine how CO frequency is regulated by external cues – in this case to temperature. The objective of this project is to test the hypothesis that the additional temperature-dependent COs are attributable to the Type II pathway using tetrad analysis. To test our hypothesis we will measure recombination rates in wild-type (WT), and mutant lines that eliminate either Type I or Type II crossovers in both control (20C) and
or interference- insensitive pathay [11]. In humans MSH4 has been implicated in homologus pairing following initial strand invasion, formation of a pro-DHJ structure and eventual resolution via the DSBR pathway [9]. In A. thaliana a MUS81 homolog, AtMUS81, has been identified and implicated in the resolution of the DHJs by promoting proper segregation of recombination intermediates that ultimately results in Type II COs [7,11]. To test our hypothesis that the additional temperature dependent crossovers are derived from the Type II pathway, we will compare the relative frequency of COs in wild-type and mutant lines under both growth conditions.
Methods and Materials:
Plant Material and Growth
Atmsh4 and Atmus81 T-DNA insertion lines (SALK_136296 and SALK_107515,
respectively, Alonso et al. 2003) were obtained from the Arabidopsis Biological Rescource Center at Ohio State. FTL intervals I1a and I3a as (Figure 1) well as qrt1-2-/- were described previously (3). Dr. Modliszewski (Copenhaver lab) reciprocally crossed both Atmus81-/-;
qrt1-2-/- and Atmsh4+/-; qrt1-2-/- plants (Table 1 and 2) to qrt1-2-/- plants that were homozygous for either then I1a or I3a intervals. Atmsh4+/-were utilized in this cross because Atmsh4 -/-plants have very low fertility [11]. F1 seed was sown, plants were grown to maturity and F2 seed was
collected from either Atmsh4+/-;qrt1-2-/-;I1a heterozygotes or Atmus81-/-; qrt1-2-/-; I1a
heterozygotes. F2 seed was sown and pollen from F2 plants were used to measure recombination
Table 1. Parental, reciprocal crosses created by Dr. Modliszewski June 2013
Table 2. F1 seed collected from parental crosses.
F1 Plants Plant ID F2 Seeds Sown
I1a/I1a; qrt1-2-/-(no #) × msh4+/-; qrt1-2-/- 4B P1 32
msh4+/-; qrt1-2-/-4B × I1a/I1a; qrt1-2-/- (no #) P1 32
I1a/I1a; qrt1-2-/- 5A × mus81-/-; qrt1-2-/-1B P20 32
mus81-/-; qrt1-2-/-1B × I1a/I1a; qrt1-2-/-5A P25 32
Plants were grown in individual 2x2 inch pots inside support trays filled with commercially prepared soil containing pesticide. Support trays were filled halfway with tap water and the top layer of the soil was wetted with a spray bottle. A moistened toothpick was used to deposit one seeds per pot. Trays were covered with a clear plastic dome and stratified in a dark 4C cold-room for 5 days. Trays were transferred to a long-day (18 hour light) 20C growth room for approximately six more weeks until plants reached maturation. Plants were watered and fertilized with Miracle Gro. Plants were sprayed weekly for fungus gnats with Avid Insecticide and waterings were treated with Gnatrol biological larvicide weekly. Fly papers were used as needed to census fungus gnat numbers.
Cross Parental Cross Seeds Sown
1 mus81-/-; qrt1-2-/- 2B × I1a/I1a; qrt1-2-/-2A 32
2 mus81-/-; qrt1-2-/-1B × I1a/I1a; qrt1-2-/-5A 32
3 I1a/I1a; qrt1-2-/- 2A × mus81-/-; qrt1-2-/-2B 32 4 I1a/I1a; qrt1-2/qrt-2 5A × mus81-/-; qrt1-2/qrt1-2 1B 32
5 msh4+/-; qrt1-2-/-4A × I1a/I1a; qrt1-2-/-2A 32
6 msh4+/-; qrt1-2/-/- 4B × I1a/I1a; qrt1-2-/-(no #) 32
DNA Extraction and Genotyping
DNA was isolated from 2 cauline leaves placed into a 1.5 mL Eppendorf tube filled with 400 µL of Edward extraction buffer (200 mM Tris base pH 8.0, 250 mM NaCl, 25 mM EDTA, 0.5% SDS).A pestle was used to grind leaf tissue. Samples were vortexed for approximately 10 seconds and spun in an Eppendorf microcentrifuge 5430 at 14,000 rpm for five minutes and 300 µL of supernatant was transferred to tubes containing 300 µL of isopropanol. Samples were inverted, allowed to sit two minutes and then spun at 14,000 rpm for five minutes. The
supernatant was decanted and the pellet was washed with 70% ethanol. The tubes were set aside for five minutes and then spun at 14,000 rpm for two minutes. After the final spin, the tubes were inverted on a large Kimwipe to air-dry for 30 minutes. The DNA pellet was resuspended with 100 µL sterile distilled water and then stored in a 4C refrigerator.
Three primers (two genomic and one T-DNA left border primer) specific to the T-DNA insertions were used to genotype the plants by PCR (Table 3 and 4). Primer pairs were used to amplify MSH4 and MUS81 WT allele, respectively. Mutant msh4 allele was amplified via SLK 136296 new2F and LBB1 primer pairs. Mutant mus81 allele as amplified via SALK 107515 R and LBB1 primer pairs. Each PCR master solution consisted of: 1.8 µL double-distilled water, 0.35 µL primer 1, 0.35 µL primer 2, and 7.5 µL Apex pre-mix master mix (2x) per sample genotyped. A volume of 3.5 µL purified DNA supernatant was added to 11.5 µL of the PCR solution in either polycarbonate tubes or plates. Once DNA had been aliquot to tubes or plates samples were spun down in tabletop centrifuge PCR was performed using a MJ Research DNA Engine Dyad Thermal Cycler. Samples were cycled: 95C for 3 minutes, 94C for 45 seconds,
55C for 45 seconds, 72C for 2 minute, recycle step 2 for 34 more times, 72C for 10 minute,
incubated at 10C indefinitely.
Table 3. Primers Utilized in Genotyping Atmsh4 Lines
Primer Name Primer Sequence
SLK 136296 new2F 5’- CGGCTTCACTGCATCTATCTC -3’ SLK 136296 new2R 5'- TGGAATGGATCAATGAGTTCC -3'
Table 4. Primers Utilized in Genotyping Atmus81 Lines
Primer Name Primer Sequence
SALK 107515 R 5’- AATTTTCCACAAACCCTTTGG -3’
SALK 107515 F 5’- GACAGTTGAAGGTCGGGAAG -3’
LBB1 5’- GCGTGGACCGCTTGCTGCAACT -3’
Gels were prepared as 1% agarose in 1xTAE buffer (40 mM Tris base, 1 mM EDTA, 19 mM Glacial acetic acid). Ethidium bromide ( mM) was added to facilitate visualization of DNA. When running PCR samples a GeneRuler 1 kilo-base pair (1 kb) ladder was added to the first well of each row to serve as a size control and 5 µL of each PCR sample was loaded remaining wells. Gels are to be run at 120 V for approximately 20 to 30 minutes. DNA will be visualized using UV trans-illuminator.
Temperature Treatment
Sets of Atmsh4+/-, Atmsh4-/- and WT F2 plants were separated after bolting around six
weeks and transferred from the main 20C growth room to a 28C growth chamber. Plants remained in temperature treatment for at least 48 hours prior to assaying CO frequency in order to ensure one complete round of meiosis occurred prior to scoring [3]. Atmsh4+/-, Atmsh4-/- and WT F2 plants remaining in the 20C growth room were scored concurrently.
Tetrad Analysis
FTL marker segregation in pollen tetrads was assessed with a Nikon E1000 epi-fluorescence microscope, equipped with appropriate Chroma Technology epi-fluorescence filters, using a 10X or 20X objective lens. Pollen samples were prepared using forceps to select a flower which was dabbed in a 6 μL drop of pollen growth medium (PGM) solution (17% (w/v)
sucrose, 1 M CaCl2, 1.625 mM boric acid, and 100 μl 0.1% Triton-X (v/v)) on a glass slide [7].
Heterozygotes for the DsRed2 and AmCyan (R and C) FTL markers were identified by their 2:2 RC pollen tetrad segregation ratios (Figure 3b).
Tetrads from F2 plants were scored via fluorescent microscopy. Field of view started in
were observed). Genetic distance (centiMorgans, cM) and standard error for each of the msh4
genotypic classes was calculated using the Perkins equation (Perkins 1949), with the aid of the Stahl online tool (http://molbio.uoregon.edu/~fstahl/).
Figure 3. Lack of CO results in a tetrad with a parental ditype (Both tetrad images are adapted from Francis et al)[8]. a) Green represents chromosomes following replication prior to crossing over. Dark green represents one homolog (shown with two sister chromatids) and light green represents the other homolog (also shown with two sister chromatids). Blue and red triangles represent AmCyan and dsRed2 transgenes, respectively and demonstrate how the FTs are used to determine CO frequency. b) Tetrad fluorescing under cyan and red channels.
Figure 4. CO results in a tetrad with a tetratype. Green represents chromosomes following replication prior to crossing over. a) Dark green represents one homolog (shown with two sister chromatids) and light green represents the other homolog (also shown with two sister chromatids). Blue and red triangles represent AmCyan and dsRed2 transgenes, respectively and demonstrate how the FTs are used to determine CO frequency. b) Tetrad fluorescing under cyan and red channels.
a)
a) b)
Results:
I1a Msh4 F1 screening and F2 genotyping
From the I1a/msh4 cross, 31 msh4+/- F1s were identified. All msh4+/- F1 plants were also
confirmed via tetrad screening to be heterozygous for the I1a markers. Three F1 plants were
chosen from cross 5, cross 6, and cross 8, and F2 seed from these F1 plants was used in tetrad
analysis. A total of 80 F2 plants from cross 5, 28 F2 plants from cross 6, and 74 F2 plants from
cross 8 were genotyped at the MSH4 locus. For crosses 5 and 6, the MSH4 alleles segregated in the expected Mendelian ratio of 1:2:1 (AtMSH4+/+, Atmsh4+/- and Atmsh4-/-) (Table 5). For cross 8, fewer msh4-/- plants were observed than expected. However, plants from this cross exhibited normal fluorescence patterns, suggesting that the skewed ratios are possibly due to small sample size.
I1a mus81 F1 screening and F2 genotyping
F1 plants were chosen from cross 2 and cross 4 and F2 seed from these F1 plants was used
in tetrad analysis. A total of 51 F2 plants from cross 2 and 57 F2 plants from cross 4 were
genotyped at the MUS81 locus. For both crosses, the F2 plants did not segregate in the expected
Mendelian ratios (Table 6). From cross 4, in which I1a+/+; qrt1-2-/- was the maternal parent, no
mus81-/- plants were observed, but approximately half of the plants were mus81+/- and half were wild-type. From cross 2, in which mus81-/- ; qrt1-2-/- was the maternal parent, almost all of the plants were mus81-/-. For this cross, it is clear that the F1 plant was the result of
self-contamination during crossing. For cross 2, it is unclear how both mus81+/- plants and wild-type were observed. These crosses are being repeated.
Tetrad Analysis
Table 5. Number of AtMSH4+/+, Atmsh4+/- and Atmsh4-/- F2Genotyped
Cross Atmsh4+/+ Atmsh4-/+ Atmsh4-/- P-Value
5 16 43 20 1.025 0.5989
6 9 13 6 0.786 0.6751
8 28 41 4 16.890 0.0002
Table 6. Number of AtMUS81+/+, Atmus81-/+ and Atmus81-/- Genotyped
Cross Atmus814+/+ Atmus81-/+ Atmus81-/- P-Value
2 0 1 48 45.122 0.0001
4 16 35 1 19.903 0.0001
Table 7. Number of Tetrad Types Scored via Tetrad Analysis
20C 28C
Tetrad type AtMSH4+/+ Atmsh4+/- Atmsh4 -
/-AtMSH4+/+ Atmsh4+/- Atmsh4 -
/-Parental Ditype 463 839 176 104 420 37
Tetratypes 65 108 9 27 116 1
Non-Parental Ditype 0 0 0 0 0 0
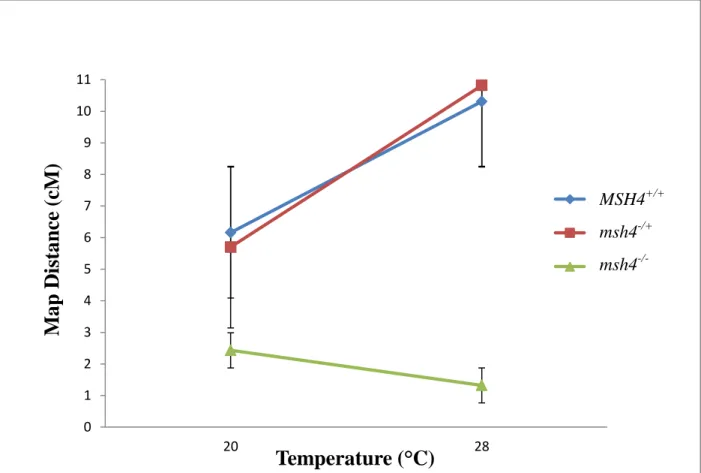
Figure 4. Relative change in map distance between FTs indicative of change in CO frequency that was observed in AtMSH4+/+, Atmsh4+/- and Atmsh4-/- plants in between 20°C and 28°C.
Discussion:
In this study, we report three key findings. First, similar to Francis et al. (2007), we observed the temperature dependent increase in CO frequency in our AtMSH4+/+and Atmsh4
+/-plants. This is encouraging because it recapitulates the temperature dependent increase observed previously. Second, we observed a decrease in CO frequency in Atmsh4-/- plants in the 20°C room – also consistent with prior observations [8]. Finally, we made the novel observation that COs do not increase in Atmsh4-/- in the 28°C chamber. If the Type II pathway was responsible for the increase incidence of COs we expect there to still be an increase in COs at 28°C and this was not observed.
To validate this finding that the additional COs may arise from the Type I pathway we need to perform tetrad analysis using the Atmus81 I1a plants. We would expect there to be an increase of COs at 28°C for Atmus81-/- since our results suggest the increased number of COs may arise from Type I origin. Further study needs to also include tetrad analysis of both Atmsh4
References
1. Copenhaver GP, Browne WE, Preuss D. Assaying genome-wide recombination and centromere functions with Arabidopsis tetrads. Proc Natl Acad Sci USA. 1998;95(1):247-52.
2. Fisher RA. The Genetical Theory of Natural Selection, A Complete Variorum Edition. Oxford University Press; 1999.
3. Armstrong SJ, Franklin FCH, Jones GH (2003) A meiotic time-course for Arabidopsis thaliana. Sexual Plant Reproduction 16:141-149.
4. Page SL. Chromosome Choreography: The Meiotic Ballet. Science. 2003;301(5634):785-789.
5. Higgins JD, Armstrong SJ, Franklin FC, Jones GH. The Arabidopsis MutS homolog AtMSH4 functions at an early step in recombination: evidence for two classes of recombination in Arabidopsis. Genes Dev. 2004;18(20):2557-70.
6. Snowden T, Acharya S, Butz C, Berardini M, Fishel R. hMSH4-hMSH5 recognizes Holliday Junctions and forms a meiosis-specific sliding clamp that embraces homologous chromosomes. Mol Cell. 2004;15(3):437-51.
7. Berchowitz LE, Francis KE, Bey AL, Copenhaver GP. The role of AtMUS81 in interference-insensitive crossovers in A. thaliana. PLoS Genet. 2007;3(8):e132.
9. Berchowitz LE, Copenhaver GP. Fluorescent Arabidopsis tetrads: a visual assay for quickly developing large crossover and crossover interference data sets. Nat Protoc. 2008;3(1):41-50.
10.Higgins JD, Buckling EF, Franklin FC, Jones GH. Expression and functional analysis of AtMUS81 in Arabidopsis meiosis reveals a role in the second pathway of crossing-over. Plant J. 2008;54(1):152-62.
11.Geuting V, Kobbe D, Hartung F, Dürr J, Focke M, Puchta H. Two distinct MUS81-EME1 complexes from Arabidopsis process Holliday junctions. Plant Physiol. 2009;150(2):1062-71.
12.Sun Y, Ambrose JH, Haughey BS, et al. Deep genome-wide measurement of meiotic gene conversion using tetrad analysis in Arabidopsis thaliana. PLoS Genet.

![Figure 3. Lack of CO results in a tetrad with a parental ditype (Both tetrad images are adapted from Francis et al)[8]](https://thumb-us.123doks.com/thumbv2/123dok_us/8332509.2210893/9.918.234.624.235.461/figure-results-tetrad-parental-ditype-tetrad-adapted-francis.webp)