ResearchMethodology-RSK-Note.pdf
77
0
0
Full text
(2) Ph.D. Course Work | M.Phil. Paper-1 | 2010 Dr. Rahul Kundu | Dept. of Biosciences. 4) CONCLUSION The term, research, is much stricter in science than in everyday life. It revolves around using the scientific method to generate hypotheses and provide analyzable results. All scientific research has a goal and ultimate aim, repeated and refined experimentation gradually reaching an answer. These results are a way of gradually uncovering truths and finding out about the processes that drive the universe around us. Only by having a rigid structure to experimentation, can results be verified as acceptable contributions to science. Some other areas, such as history and economics, also perform true research, but tend to have their own structures in place for generating solid results. They also contribute to human knowledge but with different processes and systems.. RESEARCH PROCESS Research process deals with the ways and strategies used by researchers to understand the world around us. It involves a dedicated system of scientific methodology that can be used by researchers to arrive at the right conclusions. CHAPTER-1 Conducting research involves using the scientific method at its core. Therefore, before any research is undertaken, it is important to be aware of the steps. The research methodology has not come up overnight, but has evolved through hundreds of years of science. The history of science is interesting and intriguing, giving an insight into the developments of modern day science. There are several pioneers who shaped the current research process. You may like to look at who invented the scientific method to get an idea of the early scientists and the influence they have, directly or indirectly, on what every researcher does today. At the heart of the research methodology, is the fundamental and lingering question of the definition of research. This is by no means a trivial question and the answer constantly keeps evolving with time. To understand the world around us, the researcher needs to know and understand the definition of the scientific method. This will be central to the research process and subsequent conclusions drawn from the experiment. 1.1 STEPS OF THE SCIENTIFIC METHOD The steps of the scientific method are a structure that has been developed over the millennia, since the time of the ancient Greek and Persian philosophers. Whilst there are always minor variations between different scientific disciplines, they all follow the same basic path. GENERAL QUESTION The starting point of most new research is to formulate a general question about an area of research and begin the process of defining it. This initial question can be very broad, as the later research, observation and narrowing down will hone it into a testable hypothesis. For example, a broad question might ask „whether fish stocks in the North Atlantic are declining or not‟, based upon general observations about smaller yields of fish across the whole area. Reviewing previous research will allow a general overview and will help to establish a more specialized area. Unless you have an unlimited budget and huge teams of scientists, it is impossible to research such a general field and it needs to be pared down. This is the method of trying to sample one small piece of the whole picture and gradually contribute to the wider question. NARROWING DOWN The research stage, through a process of elimination, will narrow and focus the research area. This will take into account budgetary restrictions, time, available technology and practicality, leading to the proposal of a few realistic hypotheses. Eventually, the researcher will arrive at one fundamental hypothesis around which the experiment can be designed. DESIGNING THE EXPERIMENT This stage of the scientific method involves designing the steps that will test and evaluate the hypothesis, manipulating one or more variables to generate analyzable data. The experiment should be designed with later statistical tests in mind, by making sure that the experiment has controls and a large enough sample group to provide statistically valid results.. 2.
(3) Ph.D. Course Work | M.Phil. Paper-1 | 2010 Dr. Rahul Kundu | Dept. of Biosciences. OBSERVATION This is the midpoint of the steps of the scientific method and involves observing and recording the results of the research, gathering the findings into raw data. The observation stage involves looking at what effect the manipulated variables have upon the subject, and recording the results. ANALYSIS The scope of the research begins to broaden again, as statistical analyses are performed on the data, and it is organized into an understandable form. The answers given by this step allow the further widening of the research, revealing some trends and answers to the initial questions. CONCLUSIONS AND PUBLISHING This stage is where, technically, the hypothesis is stated as proved or disproved. However, the bulk of research is never as clear-cut as that, and so it is necessary to filter the results and state what happened and why. This stage is where interesting results can be earmarked for further research and adaptation of the initial hypothesis. Even if the hypothesis was incorrect, maybe the experiment had a flaw in its design or implementation. There may be trends that, whilst not statistically significant, lead to further research and refinement of the process. The results are usually published and shared with the scientific community, allowing verification of the findings and allowing others to continue research into other areas. CYCLES This is not the final stage of the steps of the scientific method, as it generates data and ideas to recycle into the first stage. The initial and wider research area can again be addressed, with this research one of the many individual pieces answering the whole question. Building up understanding of a large area of research, by gradually building up a picture, is the true path of scientific advancement.. 1.2 KEY CONCEPTS OF THE SCIENTIFIC METHOD There are several important aspects to research methodology. This is a summary of the key concepts in scientific research and an attempt to erase some common misconceptions in science. Steps of the scientific method are shaped like an hourglass - starting from general questions, narrowing down to focus on one specific aspect and designing research where we can observe and analyze this aspect. At last, we conclude and generalize to the real world. VARIABLES A variable is something that changes. It changes according to different factors. Some variables changes easily, like the stock-exchange value, while other variables are almost constant, like the name of someone. Researchers are often seeking to measure variables. The variable can be a number, a name or anything where the value can change. An example of a variable is temperature. The temperature varies according to other variable and factors. You can measure different temperature inside and outside. If it is a sunny day, chances are that the temperature will be higher than if it's cloudy. Another thing that can make the temperature change is whether something has been done to manipulate the temperature, like lighting a fire in the chimney. In research, you typically define variables according to what you're measuring. The independent variable is the variable which the researcher would like to measure (the cause), while the dependent variable is the effect (or assumed effect), dependent on the independent variable. These variables are often stated in experimental research, in a hypothesis, e.g. "what is the effect of personality on helping behavior?" In explorative research methodology, e.g. in some qualitative research, the independent and the dependent variables might not be identified beforehand. They might not be stated because the researcher does not have a clear idea yet on what is really going on. Confounding variables are variables with a significant effect on the dependent variable that the researcher failed to control or eliminate - sometimes because the researcher is not aware of the effect of the confounding variable. The key is to identify possible confounding variables and somehow try to eliminate or control them.. FORMULATING THE RESEARCH PROBLEM. 3.
(4) Ph.D. Course Work | M.Phil. Paper-1 | 2010 Dr. Rahul Kundu | Dept. of Biosciences. Researchers organize their research by formulating and defining a research problem. This helps them focus the research process so that they can draw conclusions reflecting the real world in the best possible way. DEFINING A RESEARCH PROBLEM Defining a research problem is the fuel that drives the scientific process, and is the foundation of any research method and experimental design, from true experiment to case study. It is one of the first statements made in any research paper and, as well as defining the research area, should include a quick synopsis of how the hypothesis was arrived at. Operationalization is then used to give some indication of the exact definitions of the variables, and the type of scientific measurements used. This will lead to the proposal of a viable hypothesis. As an aside, when scientists are putting forward proposals for research funds, the quality of their research problem often makes the difference between success and failure. STRUCTURING THE RESEARCH PROBLEM Look at any scientific paper, and you will see the research problem, written almost like a statement of intent. Defining a research problem is crucial in defining the quality of the answers, and determines the exact research method used. A quantitative experimental design uses deductive reasoning to arrive at a testable hypothesis. Qualitative research designs use inductive reasoning to propose a research statement. DEFINING A RESEARCH PROBLEM Formulating the research problem begins during the first steps of the scientific process. As an example, a literature review and a study of previous experiments, and research, might throw up some vague areas of interest. Many scientific researchers look at an area where a previous researcher generated some interesting results, but never followed up. It could be an interesting area of research, which nobody else has fully explored. A scientist may even review a successful experiment, disagree with the results, the tests used, or the methodology, and decide to refine the research process, retesting the hypothesis. This is called the conceptual definition, and is an overall view of the problem. A science report will generally begin with an overview of the previous research and real-world observations. The researcher will then state how this led to defining a research problem. THE OPERATIONAL DEFINITIONS The operational definition is the determining the scalar properties of the variables. For example, temperature, weight and time are usually well known and defined, with only the exact scale used needing definition. If a researcher is measuring abstract concepts, such as intelligence, emotions, and subjective responses, then a system of measuring numerically needs to be established, allowing statistical analysis and replication. For example, intelligence may be measured with IQ and human responses could be measured with a questionnaire from „1strongly disagree‟, to „5 – strongly agree‟. Behavioral biologists and social scientists might design an ordinal scale for measuring and rating behavior. These measurements are always subjective, but allow statistics and replication of the whole research method. This is all an essential part of defining a research problem. EXAMPLES OF DEFINING A RESEARCH PROBLEM An anthropologist might find references to a relatively unknown tribe in Papua New Guinea. Through inductive reasoning, she arrives at the research problem and asks, „How do these people live and how does their culture relate to nearby tribes?‟ She has found a gap in knowledge, and she seeks to fill it, using a qualitative case study, without a hypothesis. The Bandura Bobo Doll Experiment is a good example of using deductive reasoning to arrive at a research problem and hypothesis. Anecdotal evidence showed that violent behavior amongst children was increasing. Bandura believed that higher levels of violent adult role models on television, was a contributor to this rise. This was expanded into a hypothesis, and operationalization of the variables, and scientific measurement scale, led to a robust experimental design. HYPOTHESIS In research, a hypothesis is a suggested explanation of a phenomenon. A null hypothesis is a hypothesis which a researcher tries to disprove. Normally, the null hypothesis represents the current view/explanation of an aspect of the world that the researcher wants to challenge. Research methodology involves the researcher providing an alternative hypothesis, a research hypothesis, as an alternate way to explain the phenomenon. The researcher tests the hypothesis to disprove the null hypothesis, not because he/she loves the research hypothesis, but because it would mean coming closer to finding an answer to a specific problem. The research hypothesis is often based on observations that evoke suspicion that the null hypothesis is not always correct. In the Stanley Milgram Experiment, the a null hypothesis was that the personality determined whether a person would hurt another person, while the research hypothesis was that the role, instructions and orders were much more important in determining whether people would hurt others.. 4.
(5) Ph.D. Course Work | M.Phil. Paper-1 | 2010 Dr. Rahul Kundu | Dept. of Biosciences. RESEARCH HYPOTHESIS A research hypothesis is the statement created by a researcher when they speculate upon the outcome of a research or experiment. Every true experimental design must have this statement at the core of its structure, as the ultimate aim of any experiment. The hypothesis is generated via a number of means, but is usually the result of a process of inductive reasoning where observations lead to the formation of a theory. Scientists then use a large battery of deductive methods to arrive at a hypothesis that is testable, falsifiable and realistic. The precursor to a hypothesis is a problem, usually framed as a question. The precursor to a hypothesis is a research problem, usually framed as a question. It might ask what, or why, something is happening. For example, to use a topical subject, we might wonder why the stocks of cod in the North Atlantic are declining. The problem question might be „Why are the numbers of Cod in the North Atlantic declining?‟ This is too broad as a statement and is not testable by any reasonable scientific means. It is merely a tentative question arising from literature reviews and intuition. Many people would think that instinct and intuition are unscientific, but many of the greatest scientific leaps were a result of „hunches‟. The research hypothesis is a paring down of the problem into something testable and falsifiable. In the aforementioned example, a researcher might speculate that the decline in the fish stocks is due to prolonged over fishing. Scientists must generate a realistic and testable hypothesis around which they can build the experiment. This might be a question, a statement or an „If / Or‟ statement. Some examples could be: . Is over-fishing causing a decline in the stocks of Cod in the North Atlantic? Over-fishing affects the stocks of cod. If over-fishing is causing a decline in the numbers of Cod, reducing the amount of trawlers will increase cod stocks.. These are all acceptable statements and they all give the researcher a focus for constructing a research experiment. Science tends to formalize things and use the „If‟ statement, measuring the effect that manipulating one variable has upon another, but the other forms are perfectly acceptable. An ideal research hypothesis should contain a prediction, which is why the more formal ones are favored. A hypothesis must be testable, but must also be falsifiable for its acceptance as true science. A scientist who becomes fixated on proving a research hypothesis loses their impartiality and credibility. Statistical tests often uncover trends, but rarely give a clear-cut answer, with other factors often affecting the outcome and influencing the results. A hypothesis must be testable, taking into account current knowledge and techniques, and be realistic. If the researcher does not have a multi-million dollar budget then there is no point in generating complicated hypotheses. A hypothesis must be verifiable by statistical and analytical means, to allow a verification or falsification. In fact, a hypothesis is never proved, and it is better practice to use the terms „supported‟ or „verified‟. This means that the research showed that the evidence supported the hypothesis and further research is built upon that. A research hypothesis, which stands the test of time, eventually becomes a theory, such as Einstein‟s General Relativity. Even then, as with Newton‟s Laws, they can still be falsified or adapted. HOW TO WRITE A HYPOTHESIS Often, one of the trickiest parts of designing and writing up any research paper is how to write a hypothesis. The entire experiment and research revolves around the research hypothesis (H1) and the null hypothesis (H0), so making a mistake here could ruin the whole design. Needless to say, it can all be a little intimidating, and many students find this to be the most difficult stage of the scientific method. In fact, it is not as difficult as it looks, and if you have followed the steps of the scientific process and found an area of research and potential research problem, then you may already have a few ideas. It is just about making sure that you are asking the right questions and wording your hypothesis statements correctly. THE THREE-STEP PROCESS Often, it is still quite difficult to isolate a testable hypothesis after all of the research and study. The best way is to adopt a three-step hypothesis; this will help you to narrow things down, and is the most foolproof guide to how to write a hypothesis. Step one is to think of a general hypothesis, including everything that you have observed and. 5.
(6) Ph.D. Course Work | M.Phil. Paper-1 | 2010 Dr. Rahul Kundu | Dept. of Biosciences. reviewed during the information gathering stage of any research design. This stage is often called developing the research problem. AN EXAMPLE OF HOW TO WRITE A HYPOTHESIS A worker on a fish-farm notices that his trout seem have more fish lice in the summer, when the water levels are low, and wants to find out why. His research leads him to believe that the amount of oxygen is the reason – fish that are oxygen stressed tend to be more susceptible to disease and parasites. He proposes a general hypothesis. “Water levels affect the amount of lice suffered by rainbow trout.” This is a good general hypothesis, but it gives no guide to how to design the research or experiment. The hypothesis must be refined to give a little direction. “Rainbow trout suffer more lice when water levels are low.” Now there is some directionality, but the hypothesis is not really testable, so the final stage is to design an experiment around which research can be designed, a testable hypothesis. “Rainbow trout suffer more lice in low water conditions because there is less oxygen in the water.” This is a testable hypothesis – he has established variables, and by measuring the amount of oxygen in the water, eliminating other controlled variables, such as temperature, he can see if there is a correlation against the number of lice on the fish. This is an example of how a gradual focusing of research helps to define how to write a hypothesis. THE NEXT STAGE – WHAT TO DO WITH THE HYPOTHESIS Once you have your hypothesis, the next stage is to design the experiment, allowing a statistical analysis of data, and allowing you to test your hypothesis. The statistical analysis will allow you to reject either the null or the alternative hypothesis. If the alternative is rejected, then you need to go back and refine the initial hypothesis or design a completely new research program. This is part of the scientific process, striving for greater accuracy and developing ever more refined hypotheses. DESIGN OF EXPERIMENT The Design of Experiment (DoE) is a rigorous method, regarded as the most accurate and unequivocal standard for testing a hypothesis. A well-designed and constructed experiment will be robust under questioning, and will focus criticism on conclusions, rather than potential experimental errors. A sound experimental design should follow the established scientific protocols and generate good statistical data. As an example, experiments on an industrial scale can cost millions of dollars. Repeating the experiment because it had poor control groups, or insufficient samples for a statistical analysis, is not an option. For this reason, the design phase is possibly the most crucial. DESIGN OF EXPERIMENT BASICS With most true experiments, the researcher is trying to establish a causal relationship between variables, by manipulating an independent variable to assess the effect upon dependent variables. In the simplest type of experiment, the researcher is trying to prove that if one event occurs, a certain outcome happens. For example; “If children eat fish, their IQ increases.” This is a good hypothesis and, at first glance, appears easily testable. The problem is that, in any solid experimental design, the opposite (contrapositive) should also be true. The design of experiment dictates that, if a certain event does not occur, the tested outcome will not happen, a subtle but crucial factor. The reason for this is that it ensures that there is a genuine causal relationship between the independent and dependent variables. Therefore, the following statement should also be true.. 6.
(7) Ph.D. Course Work | M.Phil. Paper-1 | 2010 Dr. Rahul Kundu | Dept. of Biosciences. “If children do not eat fish, then their IQ will not increase.” The first statement is fairly easy to study, relying upon feeding children varying amounts of fish, and measuring their IQ. However, it is much more difficult to test the second statement. The only way to test it properly is not to feed the children fish. It is impossible to use the same children, so a compromise must be reached, and the researcher must use two different groups of children. The problem is that it is impossible to have two identical groups, and the Design of Experiment must take this into account. The researcher must understand that there are always going to be differences between the groups. This is why a solid experimental design should have extremely strong controls, and meticulous operationalization. Random groups are the best way of ensuring that the groups are as identical as possible. In the fish example, all of the children could eat the same diet, but the tested group could be given extra fish supplements. Randomizing the groups tries to balance out the differences between individuals, and also removes any potential experimental bias. INTERNAL vs. EXTERNAL VALIDITY The second problem is that you have no idea whether other factors could influence the result. Obviously, it is unethical to starve children, but other foods could have a significant influence upon IQ. It is difficult to monitor what food the children are eating at home, leading to a potential confounding variable. In addition, children from different schools may have a varying quality of teaching, potentially influencing the results. These are just some of the factors potentially affecting the experiment, and any design of experiment must try to filter out the true results from the experimental „noise‟. In an ideal „True Experiment‟ situation, you would lock all of the children in a laboratory, subjecting them all to the same conditions. The researcher could then ensure that they all variables are controlled, except for the independent variable, eating fish. However, apart from being unethical, this places false restrictions upon the children. The researcher is trying to establish whether eating fish is beneficial to children‟s intelligence, so that they can advise parents and teachers about diet. The real world is very different from the laboratory, and it would be dangerous to extrapolate the results from laboratory-based research to encompass all of the children in the world. The external validity would have been sacrificed for internal validity. Design of Experiment, especially in the life sciences, usually involves finding the correct balance between internal and external validity, using judgment and experience. Of course, complete perfection in an experiment is almost impossible, because time, resources and unknown factors will always play a significant role. The main point is that the experimental design should strive towards this goal. The Design of Experiment is also influenced by the specific field of science. Physical sciences rarely have to consider ethics or random fluctuations; one lump of iron, for a chemistry experiment, is usually similar to another. Children, by contrast not only vary from each other but can rapidly change their behavior, in a few moments. PHYSICAL SCIENCES vs. LIFE SCIENCES Physics and chemistry, for example, are always going to facilitate more accurate designs than the life sciences. This is one of the reasons why there are two levels of significance; if p had to be < 0.01 (under 1% chance that the effect is due to coincidences), a biological experiment would never produce results. To summarize, Design of Experiment is an ideal, a „Gold Standard‟ towards which scientists should aspire, ensuring that any variations within an experiment are minimized. With life and behavioral sciences, this is difficult to achieve, especially in artificial laboratory conditions, which may influence behavior and risk external validity. As long as a researcher justifies and assesses the effects of any deviation from the method, external and internal validity will not be compromised. This difficulty is one of the reasons why behavioral sciences use quasi-experimental methods, and case studies, because Design of Experiment is all but impossible. OPERATIONALIZATION Operationalization is to take a fuzzy concept, such as 'helping behavior', and try to measure it by specific observations, e.g. how likely are people to help a stranger with problems. VALIDITY AND RELIABILITY Validity refers to what degree the research reflects the given research problem.. 7.
(8) Ph.D. Course Work | M.Phil. Paper-1 | 2010 Dr. Rahul Kundu | Dept. of Biosciences. Types of validity: . External Validity Population Validity Ecological Validity Internal Validity Content Validity Face Validity Construct Validity Convergent and Discriminant Validity Test Validity Criterion Validity Concurrent Validity Predictive Validity. Reliability refers to how consistent a set of measurements are. Reliability may be defined as "Yielding the same or compatible results in different clinical experiments or statistical trials" (the free dictionary). Research methodology lacking reliability cannot be trusted. Replication studies are a way to test reliability. Types of Reliability: . Test-Retest Reliability Interrater Reliability Internal Consistency Reliability Instrument Reliability Statistical Reliability Reproducability. Both validity and reliability are important aspects of the research methodology to get better explanations of the world. GENERALIZATION Generalization is to which extent the research and the conclusions of the research apply to the real world. It is not always so that good research will reflect the real world, since we can only measure a small portion of the population at a time.. TEST–RETEST RELIABILITY The test-retest reliability method is one of the simplest ways of testing the stability and reliability of an instrument over time. For example, if a group of students takes a test, you would expect them to show very similar results if they take the same test a few months later. This definition relies upon there being no confounding factor during the intervening time interval. Instruments such as IQ tests and surveys are prime candidates for test-retest methodology, because there is little chance of people experiencing a sudden jump in IQ or suddenly changing their opinions. On the other hand, educational tests are often not suitable, because students will learn much more information over the intervening period and show better results in the second test. TEST–RETEST RELIABILITY AND THE RAVAGES OF TIME For example, if a group of students take a geography test just before the end of semester and one when they return to school at the beginning of the next, the tests should produce broadly the same results. If, on the other hand, the test and retest are taken at the beginning and at the end of the semester, it can be assumed that the intervening lessons will have improved the ability of the students. Thus, test-retest reliability will be compromised and other methods, such as split testing, are better. Even if a test–retest reliability process is applied with no sign of intervening factors, there will always be some degree of error. There is a strong chance that subjects will remember some of the questions from the previous test and perform better. Some subjects might just have had a bad day the first time around or they may not have taken the test seriously. For these reasons, students facing retakes of exams. 8.
(9) Ph.D. Course Work | M.Phil. Paper-1 | 2010 Dr. Rahul Kundu | Dept. of Biosciences. can expect to face different questions and a slightly tougher standard of marking to compensate. Even in surveys, it is quite conceivable that there may be a big change in opinion. People may have been asked about their favourite type of bread. In the intervening period, if a bread company mounts a long and expansive advertising campaign, this is likely to influence opinion in favour of that brand. This will jeopardize the test-retest reliability and so the analysis that must be handled with caution. TEST–RETEST RELIABILITY AND CONFOUNDING FACTORS To give an element of quantification to the test–retest reliability, statistical tests factor this into the analysis and generate a number between zero and one, with 1 being a perfect correlation between the test and the retest. Perfection is impossible and most researchers accept a lower level, either 0.7, 0.8 or 0.9, depending upon the particular field of research. However, this cannot remove confounding factors completely, and a researcher must anticipate and address these during the research design to maintain test–retest reliability. To dampen down the chances of a few subjects skewing the results, for whatever reason, the test for correlation is much more accurate with large subject groups, drowning out the extremes and providing a more accurate result. CHOOSING THE RESEARCH METHOD The selection of the research method is crucial for what conclusions you can make about a phenomenon. It affects what you can say about the cause and factors influencing the phenomenon. It is also important to choose a research method which is within the limits of what the researcher can do. Time, money, feasibility, ethics and availability to measure the phenomenon correctly are examples of issues constraining the research. CHOOSING THE MEASUREMENT Choosing the scientific measurements are also crucial for getting the correct conclusion. Some measurements might not reflect the real world, because they do not measure the phenomenon as it should. SIGNIFICANCE TEST To test a hypothesis, quantitative research uses significance tests to determine which hypothesis is right. The significance test can show whether the null hypothesis is more likely correct than the research hypothesis. Research methodology in a number of areas like social sciences depends heavily on significance test. A significance test may even drive the research process in a whole new direction, based on the findings. The t-test (also called the Student's T-Test) is one of many statistical significance tests, which compares two supposedly equal sets of data to see if they really are alike or not. The t-test helps the researcher conclude whether a hypothesis is supported or not. DRAWING CONCLUSIONS Drawing a conclusion is based on several factors of the research process, not just because the researcher got the expected result. It has to be based on the validity and reliability of the measurement, how good the measurement was to reflect the real world and what more could have affected the results. The observations are often referred to as 'empirical evidence' and the logic/thinking leads to the conclusions. Anyone should be able to check the observation and logic, to see if they also reach the same conclusions. Errors of the observations may stem from measurementproblems, misinterpretations, unlikely random events etc. A common error is to think that correlation implies a causal relationship. This is not necessarily true. ERRORS IN RESEARCH Logically, there are possible to make two types of errors when drawing conclusions in research: Type 1 error is when we accept the research hypothesis when the null hypothesis is in fact correct. Type 2 error is when we reject the research hypothesis even if the null hypothesis is wrong.. 9.
(10) Ph.D. Course Work | M.Phil. Paper-1 | 2010 Dr. Rahul Kundu | Dept. of Biosciences. Chapter-2. WHAT IS THE SCIENTIFIC METHOD? The scientific method, as defined by various scientists and philosophers, has a fairly rigorous structure that should be followed. In reality, apart from a few strictly defined physical sciences, most scientific disciplines have to bend and adapt these rules, especially sciences involving the unpredictability of natural organisms and humans. In many ways, it is not always important to know the exact scientific method, to the letter, but any scientist should have a good understanding of the underlying principles. In many ways, if you are going to bend and adapt the rules, you need to understand the rules in the first place. WHAT IS THE SCIENTIFIC METHOD? - EMPIRICAL Science is based purely around observation and measurement, and the vast majority of research involves some type of practical experimentation. This can be anything, from measuring the Doppler Shift of a distant galaxy to handing out questionnaires in a shopping center. This may sound obvious, but this distinction stems back to the time of the Ancient Greek Philosophers. Cutting a long story short, Plato believed that all knowledge could be reasoned; Aristotle that knowledge relied upon empirical observation and measurement. This does bring up one interesting anomaly. Strictly speaking, the great physicists, such as Einstein and Stephen Hawking, are not scientists. They generate sweeping and elegant theories and mathematical models to describe the universe and the very nature of time, but measure nothing. In reality, they are mathematicians, occupying their own particular niche, and they should properly be referred to as theoreticians. Still, they are still commonly referred to as scientists and do touch upon the scientific method in that any theory they have can be destroyed by a single scrap of empirical evidence. THE SCIENTIFIC METHOD RELIES UPON DATA The scientific method uses some type of measurement to analyze results, feeding these findings back into theories of what we know about the world. There are two major ways of obtaining data, through measurement and observation. These are generally referred to as quantitative and qualitative measurements. Quantitative measurements are generally associated with what are known as „hard‟ sciences, such as physics, chemistry and astronomy. They can be gained through experimentation or through observation. For example: . At the end of the experiment, 50% of the bacteria in the sample treated with penicillin were left alive. The experiment showed that the moon is 384403 km away from the earth. The pH of the solution was 7.1. As a rule of thumb, a quantitative unit has a unit of measurement after it, some scientifically recognized (SI) or SI derived unit. Percentages and numbers fall into this category. Qualitative measurements are based upon observation and they generally require some type of numerical manipulation or scaling. As an example, a social scientist interviewing drug addicts in a series of case studies, and documenting what they see, is not really performing science, although the research is still useful. However, if he performs some sort of manipulation, such as devising a scale to assess the intensity of the response to specific questions, then he generates qualitative results. . On average, the subjects showed an anxiety level of four. 91% of respondents stated that they preferred Hershey bars.. Generally, qualitative measurements are arbitrary, a scale designed to measure abstract responses and constructs. Measuring anxiety, preference, pain and aggression are some examples of concepts measured qualitatively. For a small group of long-established tests, the results are often regarded as quantitative, such as IQ (Intelligence Quotient) and EQ (Emotional Quotient). Both types of data are extremely important for understanding the world around us and the majority of scientists use both types of data. A medical researcher might design experiments to test the effectiveness of a drug, using a placebo to contrast. However, she might perform in depth case studies on a few of the subjects, a pilot study, to ensure that her experiment has no problems.. 10.
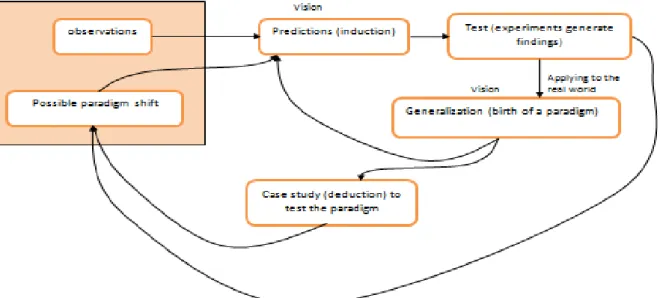
(11) Ph.D. Course Work | M.Phil. Paper-1 | 2010 Dr. Rahul Kundu | Dept. of Biosciences. WHAT IS THE SCIENTIFIC METHOD? - INTELLECTUAL AND VISIONARY Science requires vision, and the ability to observe the implications of results. Collecting data is part of the process, and it also needs to be analyzed and interpreted. However, the visionary part of science lies in relating the findings back into the real world. Even pure sciences, which are studied for their own sake rather than any practical application, are visionary and have wider goals. The process of relating findings to the real world is known as induction, or inductive reasoning, and is a way of relating the findings to the universe around us. For example, Wegener was the first scientist to propose the idea of continental drift. He noticed that the same fossils were found on both sides of the Atlantic, in old rocks, and that the continental shelves of Africa and South America seemed to fit together. He induced that they were once joined together, rather than joined by land bridges, and faced ridicule for his challenge to the established paradigm. Over time, the accumulated evidence showed that he was, in fact, correct and he was shown to be a true visionary. SCIENCE USES EXPERIMENTS TO TEST PREDICTIONS This process of induction and generalization allows scientists to make predictions about how they think that something should behave, and design an experiment to test it. This experiment does not always mean setting up rows of test tubes in the lab or designing surveys. It can also mean taking measurements and observing the natural world. Wegener‟s ideas, whilst denigrated by many scientists, aroused the interest of a few. They began to go out and look for other evidence that the continents moved around the Earth. From Wegener‟s initial idea of continents floating through the ocean floor, scientists now understand, through a process of prediction and measurement, the process of plate tectonics. The exact processes driving the creation of new crust and the subduction of others are still not fully understood but, almost 100 years after Wegener‟s idea, scientists still build upon his initial work. WHAT IS THE SCIENTIFIC METHOD? - SYSTEMATIC AND METHODICAL Scientists are very conservative in how they approach results and they are naturally very skeptical. It takes more than one experiment to change the way that they think, however loud the headlines, and any results must be retested and repeated until a solid body of evidence is built up. This process ensures that researchers do not make mistakes or purposefully manipulate evidence. In Wegener‟s case, his ideas were not accepted until after his death, when the amount of evidence supporting continental drift became irrefutable. This process of changing the current theories, called a paradigm shift, is an integral part of the scientific method. Most groundbreaking research, such as Einstein‟s Relativity or Mendel‟s Genetics, causes a titanic shift in the prevailing scientific thought. SUMMARY The scientific method has evolved, over many centuries, to ensure that scientists make meaningful discoveries, founded upon logic and reason rather than emotion. The exact process varies between scientific disciplines, but they all follow the above principle of observe – predict – test – generalize.. Illustration of the Scientific Method (by A. Keita). 11.
(12) Ph.D. Course Work | M.Phil. Paper-1 | 2010 Dr. Rahul Kundu | Dept. of Biosciences. EXPERIMENTAL ERRORS: TYPE I ERROR - TYPE II ERROR Whilst many will not have heard of Type I error or Type II error, most people will be familiar with the terms ‟false positive‟ and ‟false negative‟, mainly as a medical term. A patient might take an HIV test, promising a 99.9% accuracy rate. This means that 1 in every 1000 tests could give a ‟false positive,‟ informing a patient that they have the virus, when they do not. Conversely, the test could also show a false negative reading, giving an HIV positive patient the all-clear. This is why most medical tests require duplicate samples, to stack the odds up favorably. A one in one thousand chance becomes a 1 in 1 000 000 chance, if two independent samples are tested. With any scientific process, there is no such ideal as total proof or total rejection, and researchers must, by necessity, work upon probabilities. That means that, whatever level of proof was reached, there is still the possibility that the results may be wrong. This could take the form of a false rejection, or acceptance, of the null hypothesis. HOW DOES THIS TRANSLATE TO SCIENCE TYPE I ERROR : A Type I error is often referred to as a ‟false positive‟, and is the process of incorrectly rejecting the null hypothesis in favor of the alternative. In the case above, the null hypothesis refers to the natural state of things, stating that the patient is not HIV positive. The alternative hypothesis states that the patient does carry the virus. A Type I error would indicate that the patient has the virus when they do not, a false rejection of the null. TYPE II ERROR : A Type II error is the opposite of a Type I error and is the false acceptance of the null hypothesis. A Type II error, also known as a false negative, would imply that the patient is free of HIV when they are not, a dangerous diagnosis. In most fields of science, Type II errors are not seen to be as problematic as a Type I error. With the Type II error, a chance to reject the null hypothesis was lost, and no conclusion is inferred from a non-rejected null. The Type I error is more serious, because you have wrongly rejected the null hypothesis. Medicine, however, is one exception; telling a patient that they are free of disease, when they are not, is potentially dangerous. REPLICATION This is the reason why scientific experiments must be replicatable, and other scientists must be able to follow the exact methodology. Even if the highest level of proof, where P < 0.01 (probability is less than 1%), is reached, out of every 100 experiments, there will be one false result. To a certain extent, duplicate or triplicate samples reduce the chance of error, but may still mask chance if the error causing variable is present in all samples. If however, other researchers, using the same equipment, replicate the experiment and find that the results are the same, the chances of 5 or 10 experiments giving false results is unbelievably small. This is how science regulates, and minimizes, the potential for Type I and Type II errors. Of course, in non-replicatable experiments and medical diagnosis, replication is not always possible, so the possibility of Type I and II errors is always a factor. One area that is guilty of ignoring Type I and II errors is the lawcourt, where the jury is not told that fingerprint and DNA tests may produce false results. There have been many documented miscarriages of justice involving these tests. Many courts will now not accept these tests alone, as proof of guilt, and require other evidence. TYPE III ERRORS Many statisticians are now adopting a third type of error, a type III, which is where the null hypothesis was rejected for the wrong reason. In an experiment, a researcher might postulate a hypothesis and perform research. After analyzing the results statistically, the null is rejected. The problem is that there may be some relationship between the variables, but it could be for a different reason than stated in the hypothesis. An unknown process may underlie the relationship. CONCLUSION Both Type I errors and Type II errors are a factors that every scientist and researcher must take into account. Whilst replication can minimize the chances of an inaccurate result, this is one of the major reasons why research should be replicable. Many scientists do not accept quasi-experiments, because they are difficult to replicate and analyze.. TYPES OF RESEARCH DESIGNS Different types of research designs have different advantages and disadvantages. The design is the structure of any scientific work. It gives direction and systematizes the research. The method you choose will affect your results and how you conclude the findings. Most scientists are interested in getting reliable observations that can help the understanding of a phenomenon. There are two main approaches to a research problem:. 12.
(13) Ph.D. Course Work | M.Phil. Paper-1 | 2010 Dr. Rahul Kundu | Dept. of Biosciences. . Quantitative Research Qualitative Research. What are the difference between Qualitative and Quantitative Research? DIFFERENT RESEARCH METHODS There are various designs which are used in research, all with specific advantages and disadvantages: . True Experimental Design Quasi-Experimental Design Double-Blind Experiment Descriptive Research Literature Review Case Study Survey Twin Studies Meta-analysis Systematic Reviews Observational Study Naturalistic Observation Field Experiment Cohort Study Longitudinal Study Cross Sectional Study Factorial Design Case Control Study Pilot Study. TYPICAL EXPERIMENTAL DESIGNS . Pretest-Posttest Design Control Group Randomized Controlled Trials Solomon Four-Group Design Between Subjects Design Within Subject Design Repeated Measures Design Counterbalanced Measures Design Matched Subjects Design Bayesian Probability. WHICH METHOD TO CHOOSE? What design you choose depends on different factors. . What information do you want? Feasibility How reliable should the information be? Is it ethical to conduct the study? The cost of the design. HOW TO CHOOSE FROM THE DIFFERENT RESEARCH METHODS Selecting the correct type from the different research methods can be a little daunting, at first. There are so many factors to take into account and evaluate. The research question, ethics, budget and time are all major considerations. 13.
(14) Ph.D. Course Work | M.Phil. Paper-1 | 2010 Dr. Rahul Kundu | Dept. of Biosciences. in any design. This is before looking at the statistics required, and studying the preferred methods for the individual scientific discipline. Every experimental design must make compromises and generalizations, so the researcher must try to minimize these, whilst remaining realistic. For „pure‟ sciences, such as chemistry or astrophysics, experiments are quite easy to define and will, usually, be strictly quantitative. For biology, psychology and social sciences, there can be a huge variety of methods to choose from, and a researcher will have to justify their choice. Whilst slightly arbitrary, the best way to look at the various methods is in terms of „strength‟. EXPERIMENTAL RESEARCH METHODS The first method is the straightforward experiment, involving the standard practice of manipulating quantitative, independent variables to generate statistically analyzable data. Generally, the system of scientific measurements is interval or ratio based. When we talk about „scientific research methods‟, this is what most people immediately think of, because it passes all of the definitions of „true science‟. The researcher is accepting or refuting the null hypothesis. The results generated are analyzable and are used to test hypotheses, with statistics giving a clear and unambiguous picture. This research method is one of the most difficult, requiring rigorous design and a great deal of expense, especially for larger experiments. The other problem, where real life organisms are used, is that taking something out of its natural environment can seriously affect its behavior. It is often argued that, in some fields of research, experimental research is „too‟ accurate. It is also the biggest drain on time and resources, and is often impossible to perform for some fields, because of ethical considerations. The Tuskegee Syphilis Study was a prime example of experimental research that was fixated on results, and failed to take into account moral considerations. In other fields of study, which do not always have the luxury of definable and quantifiable variables - you need to use different research methods. These should attempt to fit all of the definitions of repeatability or falsifiability, although this is not always feasible. OPINION BASED RESEARCH METHODS Opinion based research methods generally involve designing an experiment and collecting quantitative data. For this type of research, the measurements are usually arbitrary, following the ordinal or interval type. Questionnaires are an effective way of quantifying data from a sample group, and testing emotions or preferences. This method is very cheap and easy, where budget is a problem, and gives an element of scale to opinion and emotion. These figures are arbitrary, but at least give a directional method of measuring intensity. Quantifying behavior is another way of performing this research, with researchers often applying a „numerical scale‟ to the type, or intensity, of behavior. By definition, this experiment method must be used where emotions or behaviors are measured, as there is no other way of defining the variables. Whilst not as robust as experimental research, the methods can be replicated and the results falsified. OBSERVATIONAL RESEARCH METHODS Observational research is a group of different research methods where the researches try to observe a phenomenon without interfering too much. Observational research methods, such as the case study, are probably the furthest removed from the established scientific method. This type is looked down upon, by many scientists, as „quasiexperimental‟ research, although this is usually an unfair criticism. Observational research tends to use nominal or ordinal scales of measurement. Observational research often has no clearly defined research problem, and questions may arise during the course of the study. For example, a researcher may notice unusual behavior and ask, „What is happening?‟ or „Why?‟ Observation is heavily used in social sciences, behavioral studies and anthropology, as a way of studying a group without affecting their behavior. Whilst the experiment cannot be replicated or falsified, it still offers unique insights, and will advance human knowledge. Case studies are often used as a pre-cursor to more rigorous methods, and avoid the problem of the experiment environment affecting the behavior of an organism. Observational research methods are useful when ethics are a problem. CONCLUSION In an ideal world, experimental research methods would be used for every type of research, fulfilling all of the requirements of falsifiability and generalization. However, ethics, time and budget are major factors, so any experimental design must make compromises. As long as a researcher recognizes and evaluates flaws in the design when choosing from different research methods, any of the scientific research methods are valid contributors to scientific knowledge.. 14.
(15) Ph.D. Course Work | M.Phil. Paper-1 | 2010 Dr. Rahul Kundu | Dept. of Biosciences. CHAPTER – 3: RESEARCH DESIGN TRUE EXPERIMENTAL DESIGN True experimental design is regarded as the most accurate form of experimental research, in that it tries to prove or disprove a hypothesis mathematically, with statistical analysis. For some of the physical sciences, such as physics, chemistry and geology, they are standard and commonly used. For social sciences, psychology and biology, they can be a little more difficult to set up. For an experiment to be classed as a true experimental design, it must fit all of the following criteria. . The sample groups must be assigned randomly. There must be a viable control group. Only one variable can be manipulated and tested. It is possible to test more than one, but such experiments and their statistical analysis tend to be cumbersome and difficult. The tested subjects must be randomly assigned to either control or experimental groups.. ADVANTAGES : The results of a true experimental design can be statistically analyzed and so there can be little argument about the results. It is also much easier for other researchers to replicate the experiment and validate the results. For physical sciences working with mainly numerical data, it is much easier to manipulate one variable, so true experimental design usually gives a yes or no answer. DISADVANTAGES : Whilst perfect in principle, there are a number of problems with this type of design. Firstly, they can be almost too perfect, with the conditions being under complete control and not being representative of real world conditions. For psychologists and behavioral biologists, for example, there can never be any guarantee that a human or living organism will exhibit „normal‟ behavior under experimental conditions. True experiments can be too accurate and it is very difficult to obtain a complete rejection or acceptance of a hypothesis because the standards of proof required are so difficult to reach. True experiments are also difficult and expensive to set up. They can also be very impractical. While for some fields, like physics, there are not as many variables so the design is easy, for social sciences and biological sciences, where variations are not so clearly defined it is much more difficult to exclude other factors that may be affecting the manipulated variable. SUMMARY True experimental design is an integral part of science, usually acting as a final test of a hypothesis. Whilst they can be cumbersome and expensive to set up, literature reviews, qualitative research and descriptive research can serve as a good precursor to generate a testable hypothesis, saving time and money. Whilst they can be a little artificial and restrictive, they are the only type of research that is accepted by all disciplines as statistically provable.. QUANTITATIVE RESEARCH DESIGN Quantitative research design is the standard experimental method of most scientific disciplines. These experiments are sometimes referred to as true science, and use traditional mathematical and statistical means to measure results conclusively. They are most commonly used by physical scientists, although social sciences, education and economics have been known to use this type of research. It is the opposite of qualitative research. Quantitative experiments all use a standard format, with a few minor inter-disciplinary differences, of generating a hypothesis to be proved or disproved. This hypothesis must be provable by mathematical and statistical means, and is the basis around which the whole experiment is designed. Randomization of any study groups is essential, and a control group should be included, wherever possible. A sound quantitative design should only manipulate one variable at a time, or statistical analysis becomes cumbersome and open to question. Ideally, the research should be constructed in a manner that allows others to repeat the experiment and obtain similar results. ADVANTAGES Quantitative research design is an excellent way of finalizing results and proving or disproving a hypothesis. The structure has not changed for centuries, so is standard across many scientific fields and disciplines. After statistical analysis of the results, a comprehensive answer is reached, and the results can be legitimately discussed and. 15.
(16) Ph.D. Course Work | M.Phil. Paper-1 | 2010 Dr. Rahul Kundu | Dept. of Biosciences. published. Quantitative experiments also filter out external factors, if properly designed, and so the results gained can be seen as real and unbiased. Quantitative experiments are useful for testing the results gained by a series of qualitative experiments, leading to a final answer, and a narrowing down of possible directions for follow up research to take. DISADVANTAGES Quantitative experiments can be difficult and expensive and require a lot of time to perform. They must be carefully planned to ensure that there is complete randomization and correct designation of control groups. Quantitative studies usually require extensive statistical analysis, which can be difficult, due to most scientists not being statisticians. The field of statistical study is a whole scientific discipline and can be difficult for nonmathematicians. In addition, the requirements for the successful statistical confirmation of results are very stringent, with very few experiments comprehensively proving a hypothesis; there is usually some ambiguity, which requires retesting and refinement to the design. This means another investment of time and resources must be committed to fine-tune the results. Quantitative research design also tends to generate only proved or unproven results, with there being very little room for grey areas and uncertainty. For the social sciences, education, anthropology and psychology, human nature is a lot more complex than just a simple yes or no response.. FIELD EXPERIMENTS For geologists, social scientists and environmental biologists, amongst others, field experiments are an integral part of the discipline. As the name suggests, a field study is an experiment performed outside the laboratory, in the 'real' world. Unlike case studies and observational studies, a field experiment still follows all of the steps of the scientific process, addressing research problems and generating hypotheses. The obvious advantage of a field study is that it is practical and also allows experimentation, without artificially introducing confounding variables. A population biologist examining an ecosystem could not move the entire environment into the laboratory, so field experiments are the only realistic research method in many fields of science. In addition, they circumvent the accusation leveled at laboratory experiments of lacking external or ecological validity, or adversely affecting the behavior of the subject. Social scientists and psychologists often used field experiments to perform blind studies, where the subject was not even aware that they were under scrutiny. Field experiments can suffer from a lack of a discrete control group and often have many variables to try to eliminate. For example, if the effects of a medicine are studied, and the subject is instructed not to drink alcohol, there is no guarantee that the subject followed the instructions, so field studies often sacrifice internal validity for external validity. For fields like biology, geology and environmental science, this is not a problem, and the field experiment can be treated as a sound experimental practice, following the steps of the scientific method. A major concern shared by all disciplines is the cost of field studies, as they tend to be very expensive. For example, even a modestly sized research ship costs many thousands of dollars every day, so a long oceanographical research program can run into the millions of dollars. Pilot studies are often used to test the feasibility of any long term or extensive research program before committing vast amounts of funds and resources. The changeable nature of the external environment and the often-prohibitive investment of time and money mean that field experiments are rarely replicable, so any generalization is always tenuous.. EXPERIMENTAL RESEARCH Experimental research is commonly used in sciences such as sociology and psychology, physics, chemistry, biology and medicine etc. It is a collection of research designs which use manipulation and controlled testing to understand causal processes. Generally, one or more variables are manipulated to determine their effect on a dependent variable. The experimental method is a systematic and scientific approach to research in which the researcher manipulates one or more variables, and controls and measures any change in other variables.. 16.
(17) Ph.D. Course Work | M.Phil. Paper-1 | 2010 Dr. Rahul Kundu | Dept. of Biosciences. Experimental Research is often used where: 1. 2. 3.. There is time priority in a causal relationship (cause precedes effect) There is consistency in a causal relationship (a cause will always lead to the same effect) The magnitude of the correlation is great.. The word experimental research has a range of definitions. In the strict sense, experimental research is what we call a true experiment. This is an experiment where the researchers manipulates one variable, and control/randomizes the rest of the variables. It has a control group, the subjects have been randomly assigned between the groups, and the researcher only tests one effect at a time. It is also important to know what variable(s) you want to test and measure. A very wide definition of experimental research, or a quasi-experiment, is research where the scientist actively influences something to observe the consequences. Most experiments tend to fall in between the strict and the wide definition. A rule of thumb is that physical sciences, such as physics, chemistry and geology tend to define experiments more narrowly than social sciences, such as sociology and psychology, which conduct experiments closer to the wider definition. AIMS OF EXPERIMENTAL RESEARCH Experiments are conducted to be able to predict phenomenon. Typically, an experiment is constructed to be able to explain some kind of causation. Experimental research is important to society - it helps us to improve our everyday lives. IDENTIFYING THE RESEARCH PROBLEM After deciding the topic of interest, the researcher tries to define the research problem. This helps the researcher to focus on a more narrow research area to be able to study it appropriately. The research problem is often operationalization, to define how to measure the research problem. The results will depend on the exact measurements that the researcher chooses and may be operationalized differently in another study to test the main conclusions of the study. Defining the research problem helps you to formulate a research hypothesis, which is tested against the null hypothesis. An ad hoc analysis is a hypothesis invented after testing is done, to try to explain why the contrary evidence. A poor ad hoc analysis may be seen as the researcher's inability to accept that his/her hypothesis is wrong, while a great ad hoc analysis may lead to more testing and possibly a significant discovery. CONSTRUCTING THE EXPERIMENT There are various aspects to remember when constructing an experiment. Planning ahead ensures that the experiment is carried out properly and that the results reflect the real world, in the best possible way. SAMPLING GROUPS TO STUDY Sampling groups correctly is especially important when we have more than one condition in the experiment. One sample group often serves as a control group, whilst others are tested under the experimental conditions. Deciding the sample groups can be done in using many different sampling techniques. Population sampling may chosen by a number of methods, such as randomization, "quasi-randomization" and pairing. Reducing sampling errors is vital for getting valid results from experiments. Researchers often adjust the sample size to minimize chances of random errors. Here are some common sampling techniques: . probability sampling non-probability sampling simple random sampling convenience sampling stratified sampling systematic sampling cluster sampling sequential sampling disproportonal sampling. 17.
(18) Ph.D. Course Work | M.Phil. Paper-1 | 2010 Dr. Rahul Kundu | Dept. of Biosciences. . judgmental sampling snowball sampling quota sampling. CREATING THE DESIGN The research design is chosen based on a range of factors. Important factors when choosing the design are feasibility, time, cost, ethics, measurement problems and what you would like to test. The design of the experiment is critical for the validity of the results. TYPICAL DESIGNS AND FEATURES IN EXPERIMENTAL DESIGN . . Pretest-Posttest Design Check whether the groups are different before the manipulation starts and the effect of the manipulation. Pretests sometimes influence the effect. Control Group Control groups are designed to measure research bias and measurement effects, such as the Hawthorne Effect or the Placebo Effect. A control group is a group not receiving the same manipulation as the experimental group. Experiments frequently have 2 conditions, but rarely more than 3 conditions at the same time. Randomized Controlled Trials Randomized Sampling, comparison between an Experimental Group and a Control Group and strict control/randomization of all other variables Solomon Four-Group Design With two control groups and two experimental groups. Half the groups have a pretest and half do not have a pretest. This to test both the effect itself and the effect of the pretest. Between Subjects Design Grouping Participants to Different Conditions Within Subject Design Participants Take Part in the Different Conditions - See also: Repeated Measures Design Counterbalanced Measures Design Testing the effect of the order of treatments when no control group is available/ethical Matched Subjects Design Matching Participants to Create Similar Experimental- and Control-Groups Double-Blind Experiment Neither the researcher, nor the participants, know which is the control group. The results can be affected if the researcher or participants know this. Bayesian Probability Using Bayesian probability to "interact" with participants is a more "advanced" experimental design. It can be used for settings where there are many variables which are hard to isolate. The researcher starts with a set of initial beliefs, and tries to adjust them to how participants have responded. PILOT STUDY It may be wise to first conduct a pilot-study or two before you do the real experiment. This ensures that the experiment measures what it should, and that everything is set up right. Minor errors, which could potentially destroy the experiment, are often found during this process. With a pilot study, you can get information about errors and problems, and improve the design, before putting a lot of effort into the real experiment. If the experiments involve humans, a common strategy is to first have a pilot study with someone involved in the research, but not too closely, and then arrange a pilot with a person who resembles the subject(s). Those two different pilots are likely to give the researcher good information about any problems in the experiment. CONDUCTING THE EXPERIMENT An experiment is typically carried out by manipulating a variable, called the independent variable, affecting the experimental group. The effect that the researcher is interested in, the dependent variable(s), is measured. Identifying and controlling non-experimental factors which the researcher does not want to influence the effects, is crucial to drawing a valid conclusion. This is often done by controlling variables, if possible, or randomizing variables to minimize effects that can be traced back to third variables. Researchers only want to measure the effect. 18.
(19) Ph.D. Course Work | M.Phil. Paper-1 | 2010 Dr. Rahul Kundu | Dept. of Biosciences. of the independent variable(s) when conducting an experiment, allowing them to conclude that this was the reason for the effect. ANALYSIS AND CONCLUSIONS In quantitative research, the amount of data measured can be enormous. Data not prepared to be analyzed is called "raw data". The raw data is often summarized as something called "output data", which typically consists of one line per subject (or item). A cell of the output data is, for example, an average of an effect in many trials for a subject. The output data is used for statistical analysis, e.g. significance tests, to see if there really is an effect. The aim of an analysis is to draw a conclusion, together with other observations. The researcher might generalize the results to a wider phenomenon, if there is no indication of confounding variables "polluting" the results. If the researcher suspects that the effect stems from a different variable than the independent variable, further investigation is needed to gauge the validity of the results. An experiment is often conducted because the scientist wants to know if the independent variable is having any effect upon the dependent variable. Variables correlating are not proof that there is causation. Experiments are more often of quantitative nature than qualitative nature, although it happens.. STATISTICS TUTORIAL This statistics tutorial is a guide to help you understand key concepts of statistics and how these concepts relate to the scientific method and research. Scientists frequently use statistics to analyze their results. Why do researchers use statistics? Statistics can help understand a phenomenon by confirming or rejecting a hypothesis. Statistics is often vital to change scientific theories. You don't need to be a scientist though; anyone wanting to learn about how researchers can get help from statistics may want to read this statistics tutorial for the scientific method. RESEARCH DATA This section of the statistics tutorial is about understanding how data is acquired and uses. The results of a science investigation often contain much more data or information than the researcher needs. This data-material, or information, is called raw data. To be able to analyze the data sensibly, the raw data is processed into "output data". There are many methods to process the data, but basically the scientist organizes and summarizes the raw data into a more sensible chunk of data. Any type of organized information may be called a "data set". Then, researchers may apply different statistical methods to analyze and understand the data better (and more accurately). Depending on the research, the scientist may also want to use statistics descriptively or for exploratory research. What is great about raw data is that you can go back and check things if you suspect something different is going on than you originally thought. This happens after you have analyzed the meaning of the results. The raw data can give you ideas for new hypotheses, since you get a better view of what is going on. You can also control the variables which might influence the conclusion (e.g. third variables). CENTRAL TENDENCY AND NORMAL DISTRIBUTION This part of the statistics tutorial will help you understand distribution, central tendency and how it relates to data sets. Much data from the real world is normal distributed that is, a frequency curve, or a frequency distribution, which has the most frequent number near the middle. This is a reason why researchers very often measure the central tendency in statistical research, such as the mean (arithmetic mean or geometric mean), median or mode. The central tendency may give a fairly good idea about the nature of the data (mean, median and mode shows the "middle value"), especially when combined with measurements on how the data is distributed. Scientists normally calculate the standard deviation to measure how the data is distributed. But there are various methods to measure ho data are distributed: variance, standard deviation, standard error of the mean, standard error of the estimate or "range" (which states the extremities in the data). To create the graph of the normal distribution for something, you'll normally use the arithmetic mean of a "big enough sample" and you will have to calculate the standard deviation. But, the distribution will not be normal distributed if the distribution is skewed (naturally) or has outliers (often rare outcomes or measurement errors) messing up the data. One example of a distribution which is not normally distributed is the F-distribution, which is skewed to the right. So, often researchers double check that their results are normally distributed using range,. 19.
Figure
Related documents
It is concluded that cognitive aspects of information processing as well as elaboration likelihood model need to be taken into account when creating online
This Chronologiste treatment is formed of two essential par ts: restorative caviar pearls packed with active ingredients to protect and revitalise your hair and a rich cream masque
• Upload valid load chart file • Replace central unit E56 Error in crane data file. • No valid data in the crane data file
The course is designed around four primary activities (1) Defining research and the research problem; (2) the research proposal and its critical steps; (3) defining the
In gen eral, trans ac tion costs can be brought down by im prov ing in fra struc ture such as roads, schools, and com mu ni ca tions; by ti - tling prop erty so that it can serve
a) Analysis phase: The Analysis phase is the foundation of instructional design. This phase is a process of defining what is to be learnt in SQL, include specific research such
A trend has emerged, as the only month of positive consumer inflation during the past six months was in February, when a spike in gasoline prices lifted the headline measure.. On
Just as individual research questions in- fluence the quality of data collected, suites of related questions within a research project influence the qual- ity of extended research
