in North Carolina Triathletes
By
Joshua N. Tennant
A Master's Paper submitted to the faculty of the University of North Carolina at Chapel Hill
in partial fulfillment of the requirements for the degree of Master of Public Health in
the Public Health Leadership Program.
in North Carolina Triathletes
By
Joshua N. Tennant
A Master's Paper submitted to the faculty of the University of North Carolina at Chapel Hill
in partial fulfillment of the requirements for the degree of Master of Public Health in
the Public Health Leadership Program.
Chapel Hill
2006
(Advisor)
(Second Reader)
Introduction
The sport of triathlon is a physically demanding activity that has seen great growth in popularity among physically active individuals in recent years20 Because of the potential risks involved in training for and competing in triathlons, it is the responsibility of the public health and medical community to assess the safety issues with the intent of offering injury prevention methods for those involved with the sport.
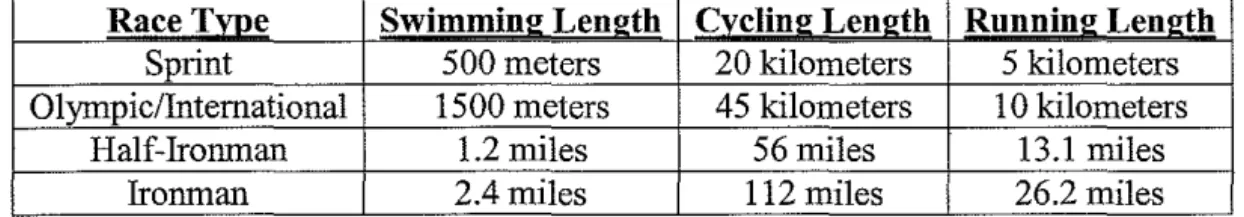
Triathlon is traditionally composed of swimming, biking, and running-usually in that order. Lengths of triathlons vary, ranging from the sprint triathlon (0.5 mile swim, 12 mile bike, and 3.1 mile run) to the lronman triathlon (2.4 mile swim, 112 mile bike, and 26 mile run). Intermediate lengths include the Olympic (1 mile swim, 24 mile bike, and 6.2 mile run) and half-lronman (half the length of the lronman) distances (Table 1). All such races are considered full triathlons.
The purpose of this paper is to: 1) provide a systematic review of the epidemiological injury literature concerning triathletes, 2) compare this body of literature to similar epidemiological survey studies in the component disciplines of swimming, cycling, and running, and 3) offer a study design to more accurately characterize the needs for injury prevention in triathletes based on lessons learned from existing literature.
Significance
History and growth of the sport
triathlons began as a creative alternative for runners in California training for marathons and 1 OKs. Organizers from the San Diego Track club intended the races, first held in San Diego's Mission Bay on summer evenings in 1974, to be entertaining and lighthearted breaks from constant running training regimens. Triathlon's popularity grew tremendously after the creation of the lronman in Hawaii in 1978, with television broadcasts of the event beginning in 1980. While the lronman remains the sport's most recognizable event, the average triathlete is more likely to participate in the more popular Olympic and Sprint distances.2
According to USA Triathlon, the governing body of the sport, the most recent estimate for U.S. triathlon participants is approximately 450,000 people. With the rapid growth of the sport in Europe and Asia over the past several years, the number of triathletes in the world is approaching 2 million people.20
In the year 2005, the North Carolina Triathlon Series (NCTS), the largest triathlon series of its kind in the United States, had 11 ,000 online entries by 4,000 unique individuals. Sixteen races between the months of March and October comprise the series, including 11 Sprint, 3 Olympic, and 2 Half-lronman distance events. The Endurance Development Series (EDS), a smaller North Carolina series designed for more novice triathletes, enrolled 2,050 unique participants in only its second year since beginning in 2004. The EDS consists of 12 races, 10 Sprint and 2 Olympic distance events, held between March and September.23
This fast growing sport attracts 450,000 people in the United States and 2 million people worldwide, therefore begging the question of what the short and long-term risk of injury might be for the group of individuals which ranges in age from 6 to 90 years old.
The physical demands and health risks of the sport, given the perceived benefits of exercise, competition, and camaraderie of the sport, further
emphasize the need for researchers to study the sport. With the current
popularity of and influx of new participants to triathlon, it is important to consider the injury profile that is unique to multisport training and competition. While cross-training in several different disciplines may serve to reduce the stresses of repetitive over-training, the unique combination of swimming, biking, and running in a sustained training regimen or an intense endurance race may cause the triathlete to be more prone to certain types of injuries. Risk factors for injury may be multifactorial, classified as extrinsic (factors independent of the athlete) or intrinsic (factors inherent to the athlete).6
By identifying risk factors, we may be able to decrease the number of preventable injuries sustained by triathletes. We are seeking to better
understand training regimens affect injury patterns within a temporal context, with the hope of identifying quantifiable relationships between training practices and patterns of injury. Such important information will serve to guide future practice of injury prevention for triathletes, coaches, and health care providers who care for injured and non-injured triathletes.
Inconsistent findings in previous studies
Review of the literature
We conducted a systematic review of the literature to identify important patient-oriented factors that might be associated with increased injury incidence in persons training for and competing in triathlons.
Methods
Selection of Articles
The Medline (Pubmed) electronic database was searched for relevant studies published between 1974 and June 2006,1imiting the search to human and English-only articles. The search terms "triathlon injury" yielded 26 non-review articles. In addition, use of the MeSH search terms "swimming injury overuse not diving not drowning," "bicycle injury overuse," "running
musculoskeletal injury," and "running injury overuse" yielded 136 human, English-only, and non-review studies. The primary reviewer (JT) also found an additional seven studies by manually reviewing the citation lists of pertinent studies and review articles.
The inclusion of swimming, bicycling, and running studies in the initial search was meant for comparison of these component discipline study results with triathlon study results. As discussed in the external validity assessment
below, one must be aware that there is both value and limitation when comparing triathletes to swimmers, cyclists, and runners.
physiological measures as their primary outcomes, such as hydration status, heart rate, V02 max, hormone levels, hyperthermia, or blood enzyme activity levels pre- and post-activity. We excluded two case studies from the initial group of articles, and we included four studies 12• 17• 19• 28 found from manual review of other study references. We proceeded with a total of 15 triathlon-related studies.
For research studies that examined swimming, biking, and running
injuries, studies were excluded from further review if their focus was on a specific traumatic injury case series, such as ankle sprains, or specific age populations, such as pediatric or older runners. We excluded studies that included individuals in sports beyond running, swimming, or cycling. We also excluded five case reports from further review after analysis of their abstracts. No swimming studies fit our search criteria.
Upon further review of full-text articles, we included four triathlon-specific studies,12• 17• 19· 28 two running-specific studies, 3• 9 and one cycling-specific study26 found from a manual review of other study references. We excluded an
additional two articles for a survey response rate of less than 1
0%_'7·
21 and two other articles for not defining the number of individuals in their sourcepopulation.6• 7 At the end of the selection process, we proceeded with critical appraisal of a total of 15 triathlon-related musculoskeletal injury studies: 8 triathlon-specific, 5 running-specific, and 2 cycling-specific injury survey studies (Table 2).
A Word on Study Design
of Sports Medicine, a top-tier journal in the sports medicine and orthopaedic field, includes the descriptive epidemiological study design as one of its 12 acceptable study designs. The inherent weaknesses of the study design include a lack of comparison group and an inability to measure associations between variations in training and injury types.
Several studies in this systematic review can be viewed as a foundation for developing further and more sophisticated research designs. A research plan for a randomized controlled trial is included in the discussion section below.
Moreover, we hope to combine a descriptive epidemiological survey with a prospective cohort study design for our current study. This will allow our study to reach a large number of individuals for descriptive epidemiological statistics, as well as providing comparisons between the cohorts of participants. Our survey will have more subjects than any of the previously published studies of amateur triathletes8•10•14•15• 24· 25• 27• 28• We optimistically hope that our study will enroll more study subjects than all studies in our systematic review combined (approximately 1500).
Appraisal of Literature Exploring Triathlete Injury Incidence
A. Data abstraction
The primary reviewer designed and used a standard data abstraction template to create a consistent method for my appraisal of each of the 8 triathlon injury survey studies and 7 running or cycling survey studies found in the
size, survey response rate, methods and measures of outcome assessment, and results (Tables 3 and 4).
B. Quality assessment
Internal Validity Ratings
Each of the 15 articles were classified according to study design
(retrospective or prospective surveys) and given a quality rating. We assigned the quality ratings using a 0-3-point scale (O="poor'', 1 ="fair", 2="good",
3="excellent") for each of four categories: selection of study populations,
measurement methods and/or tools, statistical analysis, and overall reporting of results (Tables 3 and 4).
Selection of Study population
The quality rating of the study population selection for each article was based on 1) the description of the source population, and 2) how well the study population represented the source population.
teams, 22• 25• 27 or if they included only single race finishers (instead of all race participants) in their source population.8 Four studies received a rating of
excellent for defining their source population as participants in a race or event, 9· 16• 18
• 26 despite the generalizability drawbacks of such a method for an injury study (addressed in the external validity discussion below).
We rated the degree to which the study population represented the source population largely based on survey response rate, with additional consideration given to recruitment technique. Surveys with a response rate between 10% and 25% (surveys with response rates less than 10% were not reviewed) were universally given a rating of "poor'' for not representing their source populations well. 14• 18• 24 One study with a "fair'' response rate had such a poorly defined source population that it was necessary to assign a rating of "poor'' for its source population representation.3 A response rate between 26% and 50% yielded a quality rating of "fair'' for three studies. 8• 10• 27 Studies receiving a "good" rating were those with response rates of 51% to 75%."· 15• 25· 28 Lastly, four studies (two running and two bicycling studies) received an "excellent" rating for a survey response rate of greater than 75%.9• 16• 22· 26 These four studies were unique in that participation was more strongly encouraged, either by coaches monitoring athletes22 or event organizers including the survey as a part of the event registration process.9• 16• 26
Measurements
We rated measurement methods for each study according to the
description of the measurement tool and identification of data collectors. Studies received a higher score if authors disclosed survey questions, topics, and
the surveys served as their own data collectors, every study started at a baseline of "fair'' for data collector rating. We gave a higher score to studies which used and identified data collectors beyond individuals taking surveys.
The quality of the description of the measurement tools was generally high for this group of studies. No study received a "poor'' rating, as all of them defined to some degree the questions and topics of their survey. Two studies gave very cursory descriptions of the topics covered in their respective surveys and the methods of collecting data, for which each received a "fair'' rating.15• 28 One of these "fair'' studies, Manninen and Kallinen, 15 piloted and reported their survey tool in an unpublished paper, which was not available for review. Four studies received an "excellent" rating for thorough description of the questions, topics, and administration methods of their surveys.9• 18• 22• 26 McKean et.al. gave
a clear description of their survey, primarily using an online survey format, which included the use of passwords to ensure validity of the study population, email invites for publicity, and a system of creating a raffle-style drawing for incentives to increase participation.18 Another example of an excellent survey tool was that of Dannenberg et.al., which consisted of a pre-ride and post-ride bicycle injury with appropriately thorough and detailed survey questions-" The remainder of the studies received a rating of "good" for sufficiently describing survey questions and methods, just not to the extent of the studies that received an "excellent" rating.
Two studies received a rating of "good" for their identification of data collectors. Rauh, Koepsell, Rivara, et af2 used high school cross country coaches to collect daily data on high school cross country runners. Each of the coaches had received training for use of the measurement tool for athletes' injuries and activity, which took approximately five minutes each day for each of the 23 coaches involved in the study. The study did not receive a rating of "excellent" because of the large number of data collectors, the variation between which could affect the precision of the measurement tool.
The study by Weiss26 received a "good" rating because the author himself was intimately involved with the data collection and the event under evaluation. On the fifth day of an 8-day, 500-mile bicycle tour, the author administered the survey directly to his fellow tour-riders. If participants had questions about the survey, the author was able to provide direct answers while the participant took the survey. The author also cared for the medical needs of the tour riders, and he recorded incident injuries for use in his study data. The study did not receive an "excellent" rating because of the reliance on a survey method with untrained individuals.
Statistical Analysis and Confounding
We assessed the quality of statistical analysis for appropriate choice of statistical methods and the potential for confounding of the results. No study received the highest quality rating of "excellent", as all study designs had a significantly high degree of inherent confounding.
Four studies received a quality rating of "good" for an adequate description of their statistical methods that included a consideration of
confounding.10· 18• 22• 24 All four sets of authors used the best-described statistical
f
methods, including logistic regression in their analysis of possible confounding variables.
We assigned a quality rating of "fair'' to the majority of the statistical analysis methods in our group of studies. Most of these authors did not include an assessment of confounding in their analysis, or at least did not clearly describe their analysis in the methods section of their papers. The majority of studies reported statistical tests used for analyzing descriptive statistics. Kaplan
et a/13 received a "fair" rating, despite poorly reporting the methods of analysis. However, the study showed good results and an excellent analysis of differences between survey respondents and non-respondents, thus raising the quality to "fair''. One study analyzed data only in terms of percentages, ranges, means, and standard deviations, and for this it received a rating of "poor''. 27
Results
We rated the quality of reporting of results for each study, based on the use of p values or confidence intervals. Four studies received a rating of 3 (excellent) for thorough use of p values and confidence intervals.9• 10• 16· 24 The presentation of results in tables was difficult to interpret Williams et at, which received a rating of "fair''.28 Wilk, Fisher, and Rangelli reported no p values or confidence intervals, giving it a quality rating of "poor''. 27 The remainder of the studies received a rating of "good" for adequate use of p values or confidence intervals.
Results
measured injury incidence, as well as association of training level, age, and athletic experience with injury.
Injury incidence rates
All studies reported incidence of injury, using percentage of injured participants or incidence rate as the measure of their findings. Because of the variety of survey designs employed in different studies, comparison of results is difficult among all the studies. Variability in the definition of injury and
characteristics of study populations were the most obvious sources of
incongruence between studies. For retrospective triathlete injury surveys, the reported incidence of injury (over varying amounts of time) included 15%,28 49%,8 62%,24 and 75% 10• 25• 27 of survey participants. Korkia, Tunstaii-Pedoe, and
Maffuli14 reported a 37% injury rate over 8 weeks in their prospective survey study. In addition to percentages of participants injured, Egermann, Brocai, Lill, and Schmitt10 also reported an incidence rate of0.711 injuries per 1000 exposure hours. Manninen and Kallinen 15 did not report overall injury incidence, rather percentages of patients who had injuries of certain parts of their body (discussed further in the following section).
while Weiss reported percentages of participants with specific injuries, not overall rates (discussed below)26
Location of injury
In the triathlon, running, and cycling studies reviewed, the most common location of injury in every study involved the lower extremity. Most triathlon-specific studies reported the knee to be the most common site of injury, 8• 10• 15• 28 as well as single studies identifying the Achilles tendon25 and the ankle 14 as most common. The lower back, shoulder, thigh, and calf were also among more common injury sites in several studies.
Cause of injury
In almost all triathlon studies, participants considered running as the most common cause of injury. Studies reported figures of 58.7-62.0%25, 70%8, and 53%28 for the percentage of injuries with a running etiology, with corresponding cycling etiology reported from each study as 15.9-34.5%, 12.5%, and 50%, respectively. In their study involving Iron man triathlon participants, Egermann, Brocai, Lill, and Schmitt10 reported cycling as the most common cause of injuries (54.8%), which one may attribute to the proportionally longer amount of time that lronman distance triathletes spend training and competing on the bicycle.
Williams et af-8 also reported a statistically significant relationship between cycling distance per week and injury incidence in their study population. Swimming was associated with the lowest number of injuries in every study; in fact, Shaw, Howat, Trainor, and Maycock24 concluded that time spent swimming did not correlate with increase incidence of injury.
Cause of Injury- Mechanism
Several studies also asked participants to report if their injuries were the result of overuse or trauma. Wilk, Fisher, and Rangelli27 reported that 78.9% of injured participants had injuries attributed to "overuse", and 33.3% had injuries due to trauma. Egermann, Brocai, Lill, and Schmitt10 used a slightly different definition for measurement, differentiating between fractures (11.9% ),
contusions/abrasions (51.1%), muscle/tendon injuries (33.1 %), capsule/ligament injuries (29.0%), and chronic complaints (76.2%).
Running-specific studies generally showed a higher incidence of overuse injuries in their study populations. The findings of McKean, Manson, and Stanish showed that running more times per week increased the risk of injury for all age groups in their study, suggesting overuse as an important etiology for injury.18 Marti, Vader, Minder, and Abelin reported acute traumatic injuries to be 27% and overuse injuries to be 70%.16
In contrast to running studies, cycling-specific studies showed a higher incidence of traumatic injury compared to overuse injury. As mentioned
previously, the study by Dannenberg, Needle, Mullady, and Kolodner showed 85 acute injuries (15.4 injuries per 100,000 person-miles cycled) and 76 overuse injuries (13.7 injuries per 100,000 person-miles cycled) during that particular bicycle tour, showing a slightly greater incidence of traumatic than overuse injury in their study population.9 The cycling-specific study by Weiss showed nine (8%) traumatic injuries, with two hospitalizations for traumatic injuries, but it did not report an overall injury rate for overuse injuries. 26
Two triathlon-specific studies considered the differences between injury rates during training for triathlons and during triathlon competitions. Egermann, Brocai, Lill, and Schmitt10 found a six-fold higher incidence of injury in triathlon competition compared to training in their population of lronman triathletes. Korkia, Tunstoe-Pedall, and Maffuli14 reported similar findings in a study
population of triathletes involved in shorter race distances, with injury incidence rates of 5.4 injuries per 1000 training hours and 17.4 injuries per 1000
competition hours.
Other reasons
The studies in our review considered several other covariates in their analyses of injuries. Six of the studies (including one running and one cycling study) found no correlation between injury incidence and age8• 13-15• 25• 26, and x
studies found that sex and injury incidence were not related8.10• 14• 15• 28
In contrast, several studies reported significant differences in injury related to age. Egermann, Brocai, Lill, and Schmitt10 reported a statistically significant greater incidence of fractures in older triathletes. Dannenberg, Needle, Mullady, and Kolodner9 reported a decrease in number of cycling injuries with age, hypothesized to be due to more cautious riding or developed resistance to injury. Additionally, McKean, Manson, and Stanish focused on the comparison of injury rates between runners under age 40 and runners over age 40.18 Their findings included a significantly greater overall injury rate, greater number of multiple injuries, and greater prevalence of calf, Achilles, and hamstrings injuries in older runners.
reported that girls had a significantly higher overall injury rate (19.6/1,000 AEs) than boys did (15.0/1,000 AEs) (incidence rate ratio: 1.3, 95% confidence interval: 1.0, 1.6). Weiss26 also reported a significantly higher number of bicycling knee injuries for women compared to men in his study.
Several other independent variables were considered by various studies in our review. Egermann, Brocai, Lill, and Schmitt found that faster race
performance time was associated with greater injury rate in lronman triathletes 10• Two studies with triathletes involved in shorter triathlons found no such
association between performance level and injuries14•25. In congruence with both of these findings, Williams et af-8 reported a significant positive correlation of injury incidence with increasing triathlon race distance. Various studies found amount of total time training both positively 15" 24" 25 and negatively8• 14 correlated with injury incidence.
Discussion
Summary of Internal Validity of Studies in the Systematic Review: Quality of
Reviewed Data
non-triathlete comparison group within all of the study designs diminished the meaning of each study's findings.
The description of the source population was a significant weakness for many of the studies, as some authors did not sufficiently describe which
individuals were eligible to take their survey. The representation of the source population in the study population was also a problem, with poor quality largely determined by poor survey response rates.
Because all the studies relied on self-report, the quality of the data collection was generally rated "fair''. Asking the location of an injury, while still subject to misinterpretation, seems less susceptible to incorrect reporting than asking triathlon or running survey participants to assess and self-report the cause of their own injuries. It was surprising to find that most of the studies asked participants to define injury causes in this way. If one can assume that these very physically-active adult study populations possessed greater than average knowledge about their own bodies, it may be possible to consider the self-report of injury as valid to some degree.
Summary and Analysis of Most Common Findings
The collective incidence of injury varied over a wide range among the studies analyzed. This seems understandable, given that each study focused on a relatively small group of athletes. Each study varied in its actual source
Our review showed that overuse was the most common mechanism of injury in our cohort of studies, as one might expect. Triathlon is not a contact sport and it rarely involves rapid changes in direction ("cutting"-type maneuvers). It also does not involve the acute acceleration or deceleration actions seen in various non-contact ball sports. The potential for acute trauma in triathlon arises mostly from extrinsic factors such as terrain- and traffic-related incidents in the cycling and running portions of the event, which are usually tightly regulated in order to reduce such risk. This lack of predisposition towards situations favoring acute injury, coupled with the high-intensity repetitive motions involved in training and competition, naturally favors overuse as the primary mechanism of injury.
In the studies that differentiated between injuries during competition and training, the higher incidence of injury during competition also seems logical. Competitions generally involve athletes moving in close groups at high speeds, increasing the potential for injury by contact or bicycle crash. However, as noted above, racing safety regulations reduce such risk of acute traumatic injury. One therefore might consider an injury etiology of competitive strain or overuse. Most athletes exert themselves at a higher level during competition than during training, potentially pushing their bodies over a threshold for injury. Athletes also are often more likely to continue competing, in spite of a competition injury, in an attempt to "finish the race," whereas such behavior is not as frequently seen during training. By failing to notice, ignoring, or dealing with an injury during competition, athletes likely place themselves at higher risk of worsening that injury or even sustaining other injuries.
the overall race), triathlon does not place a high demand on the upper extremity. Sudden or awkward movements of the upper extremity are rarely, if ever,
required in the course of training or competition. The lower extremity, on the other hand, bears most of the burden for the triathlete, as all three component disciplines place varying demands on the lower extremity in both training and competition. This pattern of injury is in fact similar to that of the general public, in whom leg and knee symptoms constitute the second-most common reason for visiting a physician'.
The association of most injuries with running in either training or
competition also seems logical, especially when considered in conjunction with some of the other findings discussed above. Running is the only high-impact, full weight-bearing discipline in triathlon, as both swimming and cycling do not involve impact or weight-bearing. In competition, running is usually the final event of the three disciplines - making athletes potentially more at-risk for injury due to the collective effects of cumulative microtrauma, fatigue, and even the "final push" at or near the finish line.
External Validity of Findings from the Systematic Review:
Generalizability to Triathlete Populations
We did not quantify the external validity with quality scores for our analysis, but several general strengths regarding external validity existed for most of the studies. First of all, although several studies in our review used populations of German, British, or New Zealand triathletes, the results from these international studies are likely highly generalizable to American triathletes. With an international governing body, traditional swim-bike-run triathlon is fairly similar
from country to country throughout the world. Second, although most of the study populations were predominantly male, the majority of participants in most triathlons are also male, 1 demonstrating congruence between study and source populations. For example, in 2005, 68% of USA Triathlon's 59,000 members were male.1 We therefore expect studies to have generally more males than females, although the results of such studies may not be as generalizable to female triathlete populations. Lastly, inclusion of running and cycling survey studies allows a comparison of triathlon to its component disciplines, despite differences between the whole and its parts.
Several weaknesses existed in external validity for our group of studies. First, the source population of each study, because of limitations created by survey eligibility criteria, was a very small and unique group of people. In cases where the authors allowed only members of a few triathlon clubs 14· 15• 25• 27 or participants in specific races8• 10• 28 to be included in the source population, the generalizability of the study may have been compromised with the narrower source population. As a specific example of this weakness, Egermann, Brocai, Lill, and Schmitt10 looked solely at lronman triathletes in their source population. Such ultra-endurance athletes train and compete over distances five to twenty times that of typical amateur triathletes doing sprint or Olympic distance triathlons. The lronman triathlete source population therefore may not be generalizable to the broader amateur athlete population. Likewise, studies of elite triathletes, who train and compete professionally at a high level, may not be generalizable to amateur or novice triathlete populations, who may only train a few days per week.
included in the source population. The data from such studies9• 13• 16· 26• 28 would therefore underestimate prevalence or incidence (in studies using follow-up surveys) of injury, as a serious barrier to participation in an endurance athletics event would be musculoskeletal injury. Such a generalizability problem would only be magnified in studies that included only race finishers in their source populations, for the similar reason of missing individuals injured during a race.8• 10
The external validity of pure swirnrning, cycling, and running studies for triathlete populations remains an obvious valid criticism, despite their each being a part of the sport. The injuries of triathletes, while similar to those of swimmers, cyclists, and runners, would involve more complex interactions of different
disciplines both in training and competition that could exacerbate injury. Likewise, the theory exists that cross-training in different disciplines alleviates the
musculoskeletal strain associated with constant training in the same discipline. One could argue, therefore, that a study with a pure long distance cycling tour population9• 26 or a pure running population3• 13• 16• 22 would not be generalizable to a triathlete population. Nevertheless, we included these discipline-specific studies in our analysis mainly for the purposes of 1) direct comparison with similar studies based only on triathlon, and 2) illustrating the paucity and lower quality of survey studies within triathlon.
(e.g., triathlon club membership) to be part of the source population, their
exclusion is another significant weakness for the external validity of all 15 survey studies in our review.
Conclusion/Future Directions
As illustrated by our systematic literature review, some important findings about the patterns of musculoskeletal injury within triathlon and within each of its component disciplines have been previously investigated with some success. Although the existing studies are limited by the aforementioned weaknesses, our systematic evaluation of internal validity was generally favorable. It is particularly interesting that none of the triathlon-specific studies reached the same level of quality as the discipline-specific studies- suggesting that the quality of triathlon research can be improved. The generalizability of the findings of these studies to the overall population of triathlon participants may be limited, but at present no other better data exists. Future research into the musculoskeletal injury patterns in triathlon participants should consider both the successes and shortcomings of the currently available literature.
Current Research Study Proposal Research Questions and Hypotheses
lower back pain and cycling training (distance and intensity)? 3) Is there an association between shoulder injuries and swimming training (distance and intensity)? We hypothesized that we would be able
to
observe associations of specific injuries with measurable increases in training distance and intensity for specific training disciplines.Secondary research questions include observing for associations between diagnoses of select traumatic and overuse injuries and individuals' experience in the sport; somatotype and anatomical factors such as height, weight, and body mass index; gender; and use of dietary supplements.
Materials and methods Subjects
We administered the initial survey
to
171 (as of 6/1/2006) triathletes in the North Carolina Triathlon Series (NCTS) and the Endurance Development Series (EDS) (see Dummy Table 3 for participant characterisitics) over the period from Marchto
October 2006. Eligible participants were any individuals between the ages of 18 and 75 who participated in any one of the 16 NCTS or 12 EDS triathlon races, which was approximately 6000 unique individuals for the 2006 triathlon season23.Pilot Study
items or format issues. In addition to the pilot group, the primary investigator (JT) used cognitive feedback with two participants to gain insight into thoughts and feelings elicited during the process of taking the survey and made changes based on this feedback4· 5
Instrument Design
Our study consisted of an initial online survey, followed by shorter monthly online follow-up surveys administered to each participant. We divided participants into cohorts, defined as the groups of participants who took the initial survey within in the same calendar month. The research team sent each
participant a monthly email, personalized and confidential, with a link to each monthly follow-up survey. We used the professional subscription version of the online survey website SurveyMonkey.com for the 10 months of the study.
The initial survey consisted of approximately 100 questions and took most participants approximately 15 minutes to complete. Participants initially read a complete study description, including the background, purpose, and incentives for the study, as well as a required informed consent, without which participants could not proceed with the survey. The survey asked questions about past, present, and planned athletic and triathlon experience; swimming, cycling, running, and general training practices over the previous year, both during the competitive season and off-season; general medical conditions; injuries over the past three years to the toe/foot/ankle, lower extremity, torso, upper extremity, head/neck/back, with details on location, type, cause, mechanism, level of health care provider sought, method of treatment, time missed from training or
competition, and the training disciplines stopped for each injury; quality of life assessment (short form-7); nutritional supplements, alcohol, and tobacco use;
demographic information (age, sex, height, weight, education level, marital status, occupation, race/ethnicity, and state of residence). We created the questions using the variety of formats allowed by the Surveymonkey website. The Retired NFL Player Survey11 served as a guide for creating our survey instrument.
The follow-up surveys were of a similar format to the initial survey, but consisted of approximately 30 questions and took about 5 minutes to complete. The survey asked about events since the individual had completed his or her last survey, such as triathlon race participation, training practices, and injuries.
At the end of each initial and follow-up survey, the survey thanked the participants and reminded them that we would contact them in approximately one month for the next follow-up. The survey then directed the finished participants back to the survey homepage.
Recruitment
Set-Up, Inc., the race organizer for the NCTS and EDS, put
advertisements and links to the initial survey on its website (www.set-upinc.com), as well as links to the survey in prerace email reminders sent to race participants the week before each race in the series. Because 95% of NCTS and EDS race registrations were online registrations, most of the triathletes in these two series had access to the internet. UNC Orthopaedics also provided an email sign-up sheet at four of the NCTS races for people who had not seen previous
completed, he or she received one additional entry into the raffle. For example, an individual who took the initial survey in March and completed a monthly follow-up survey every month until the end of the survey (October) would have received the maximum total of
8
raffle entries.Statistical Analysis
All data will be downloaded from the on-line survey to an Excel spreadsheet, and then converted into an SPSS statistical software package (SPSS Inc., Chicago, IL). After the data is cleaned, Chi-square tests of association will be conducted to determine if significant relationships exist between the select injuries and the variables outlined in the research questions and hypotheses section. All hypotheses will be tested with an apriori P value of .05.
Results and Discussion
As of the publication of this Master's paper, we are continuing to collect data for this study. Our goal is to focus on promoting our survey, which we have trimmed to 10 minutes by eliminating questions we felt were not necessary to the aim of the study. Data collection will continue until the end of the triathlon
season in October 2006, at which time we will analyze the data using the methods described.
and clinicians could use in trying to prevent injuries in this population. Our study could potentially detect "training thresholds" for each discipline of swimming, cycling, and running at which certain injuries occur more frequently. Other items in our survey, while not our primary research questions, may lead us in important directions for future research.
Future Studies
One idea for a future study on this topic would be a clustered randomized trial design, wherein amateur triathletes are randomized to different training groups to assess the effect of training practices on injury incidence. The following section describes the protocol for one such idea of a clustered randomized trial.
The Effect of Training Regimen on Injury Incidence in Amateur Triathletes:
A Clustered Randomized Trial Design
Main research question: Does the amount of running in an organized training program for amateur triathletes affect lower extremity overuse injury incidence over the course of a 9 month competitive triathlon season?
The research evidence is incomplete for this question. A Cochrane review of randomized trials exists for soft tissue overuse injuries in runners showed that modification of training schedules can have some impact on lower limb soft tissue injuries29. Upon systematic review of the literature, the primary
Secondary questions: Does an increased amount of running in an organized training program for amateur triathletes improve running performance and overall performance?
Parent population: Eligible persons for the study will be North Carolina Triathlon Series race participants from the last three years (approximately 6,000 individuals in 42 races).
Sample inclusion/exclusion: Participants must be between age 18 and 65; injury-free at beginning of study; and non-elite, age-group level participants who have competed in at least 5 triathlons (exclude novices). Exclusion criteria include having had a lower extremity overuse injury within the last 6 months that caused the individual to stop running for at least 1 week; and history of Ml, cardiac arrhythmias, or other medical conditions that would limit participant's ability to participate in a strenuous exercise training program.
Sample size, availability: Survey study literature shows an incidence range of 0. 711 to 5.4 injuries per 1000 training hours. Depending on ability to recruit study volunteers, a lower power, Jess sensitive sample size may be required. With alpha = 0.05, and power of 0.8, the sample size needed to detect a 10% difference in injury incidence between the intense running group and the control (balanced swim, bike, and run) group would be 408 subjects for each arm. To detect a 20% difference with the same parameters, the sample size would be 103 for each arm. Calculations were done using the sam psi command from the STAT A (College Station, Texas) software package.
reduce confounding, giving more scientific validity to the study. Incentives for participation will not be coercive, and informed consent will be provided by each participant. Although survey studies and anecdotal evidence suggest that running causes more overuse injuries than a balance of swimming, biking, and running, it is unproven whether a more intense running regimen, with the goal of improving racing performance, affects overuse injury incidence. Thus equipoise exists for this study.
Organization/monitoring: A primary investigator and group of co-investigators will comprise the research team, along with data collection and coaching from the certified coaches (1 coach per 25 athletes), clinical support from sports medicine physicians to assess and treat incident injuries,
biostatistical support from biostatisticians and data managers, and administrative support for the study. A sponsor, such as a triathlon race organizer, would be included to help recruit subjects and provide incentives. Approval from an Institutional Review Board and monitoring from a Data and Safety Monitoring Board would also be a part of the study.
Randomization: Block randomization (using blocks of 4 and 8) would be performed by a computer, balancing the groups for baseline characteristics (see below).
Masking: Coaches and subjects cannot be masked, as this is a
behavioral study. Investigators, clinicians (possibly, although they may need to know past training regimen to assess an injury), and biostatistical support could be masked.
would be done in 6 days, doing 2 workouts on two of the days (normal practice for many triathletes), with one day of complete rest per week. The control group would have a balanced workout regimen, with 2-3 days of running, 2-3 days of cycling, and 2-3 days of swimming per week. Again, this group would have a total of 8 workouts over 6 days, having combined workouts on two days, and one day of complete rest (see Appendix A}. Both of these regimens would be
considered reasonable by most triathletes competing at the age group racing category. Moreover, the "running intense" regimen would still be considerably less running than that of many recreational runners.
Compliance measure: Athletes will self-report to cluster coach in weekly online training and injury log. Coach will also be able to directly observe some of the workout sessions. Athletes will be encouraged to follow coaches'
recommendations. Subjects in both groups will be offered the incentive of free coaching (funded by study grants) for the duration of the year.
Follow-up procedures (including stopping): Comparative analyses between groups every 3 months. Stop study for adverse events or 50% or greater difference of injury incidence between intervention and control groups. Stopping requires contacting all coaches and subjects, with explanation of reasons for stopping.
Baseline measurements: Age, height, weight, sex, years doing triathlons, history of recent injuries, other medical conditions.
Injury will be defined as "as any musculoskeletal aliment that caused you to stop training for at least 1 day, reduce mileage, take medicine, or seek medical care"8 Any bursitis, tendonitis, stress fracture, muscle strain, or other overuse injury from the waist down, self-reported and assessed by the research study clinical staff, will be considered as a main outcome. Adverse events will be non-overuse injury or illness, including cardiac events, traumatic injuries, and other illnesses caused by athletic training.
Analyses: Non-inferiority trial will use ITT analysis. Baseline
characteristics will be compared between control and intervention groups using Student's paired !-test. Compare variance of medians of primary outcome measurements (number of incident injuries in each group and number of days of disability caused by injuries in each group) using Wilcoxon Rank-Sum test. Confounding should not be an issue if true randomization occurs, as measured by baseline characteristics.
Appendix A: Sample training week for each study group
Monday Tuesday Wednesday Thursday Friday Saturday Sunday
Intervention Run: 1 mile Swim:
(running warm-up, 3 Swim: 2500 Bike: 25-35 2500 yds; Bike: 25- Run:7
intense) mile tempo run. 1 mile yds; Run: 4 miles miles Run:4 35miles miles Off group
cool down miles
Run: 1 mile
Bike:
25-Control warm-up, 3 Bike: 25-35 Swim: 2500
Bike: 25-35 Swim: 35 miles;
(balanced) mile tempo
miles yds; Run: 4 miles 3500 yds Run:4 Off
group run, 1 mile miles
Acknowledgements:
Many thanks to Kevin Guskiewicz, PhD, Marion Herring, MD, Russell Harris, MD, and Brad Bushnell, MD, for their help in revising the literature review portion of this paper.
Funding source: Small Student Grant from the University of North Carolina at Chapel Hill Injury Prevention Research Center
References
1.
USA Triathlon Demographics [website]. Available at:
http://www.usatriathlon.org/News Info/demographics.htm. Accessed June
7th, 2006.
2.
USA Triathlon History [website]. Available at:
http://www.usatriathlon.org/history.asp. Accessed April 29th, 2006.
3.
Bovens AM, Janssen GM, Vermeer HG, et al. Occurrence of running
injuries in adults following a supervised training program. Int
JSports
Med. Oct 1989;10 Suppl3:Sl86-190.
4.
Boynton PM. Administering, analysing, and reporting your questionnaire.
Bmj. Jun 5 2004;328(7452):1372-1375.
5.
Boynton PM, Greenhalgh T. Selecting, designing, and developing your
questionnaire. Bmj. May 29 2004;328(7451):1312-1315.
6.
Burns J, Keenan AM, Redmond AC. Factors associated with
triathlon-related overuse injuries.
JOrthop Sports Phys Ther. Apr 2003;33( 4):
177-184.
7.
Clements K, Yates B, Curran M. The prevalence of chronic knee injury in
triathletes. Br
JSports Med. Jun 1999;33(3):214-216.
8.
Collins K, Wagner M, Peterson K, et al. Overuse injuries in triathletes. A
study of the 1986 Seafair Triathlon. Am
JSports Med. Sep-Oct
1989;17(5):675-680.
9.
Dannenberg AL, Needle S, Mullady D, et al. Predictors of injury among
1638 riders in a recreational long-distance bicycle tour: Cycle Across
Maryland. Am
JSports Med. Nov-Dec 1996;24(6):747-753.
10.
Egermann M, Brocai D, Lill CA, et al. Analysis of injuries in
long-distance triathletes. Int
J
Sports Med. May 2003;24(4):271-276.
11.Guskiewicz
K.Retired NFL Player Survey. 2002.
13.
14.
15. 16. 17. 18. 19. 20. 21. 22.23.
24.
25.
26.
27.
28. 29.Koplan JP, Powell KE, Sikes RK, et aL
Anepidemiologic study of the
benefits and risks of running.
Jama. Dec 17 1982;248(23):3118-3121.
Korkia PK, Tunstall-Pedoe DS, Maffulli N.
Anepidemiological
investigation of training and injury patterns in British triathletes.
Br
J
Sports Med. Sep 1994;28(3):191-196.
Manninen JS, Kallinen M. Low back pain and other overuse injuries in a
group ofJapanese triathletes.
Br J Sports Med. Jun 1996;30(2):134-139.
Marti B, Vader JP, Minder CE, et al. On the epidemiology of running
injuries. The 1984 Bern Grand-Prix study.
Am J Sports Med. May-Jun
1988;16(3):285-294.
Massimino FA, Armstrong MA, O'Toole ML, et aL Common triathlon
injuries: Special considerations for multisport training.
Annals of Sports
Medicine. 1988;4(2):82-86.
McKean KA, Manson NA, Stanish WD. Musculoskeletal Injury in the
Masters Runners.
Clin J Sport Med. Mar 2006;16(2):149-154.
Migilorini S.
Anepidemiological study of overuse injuries in Italian
national triathletes in the period 1987-1990.
J Sports Traumata! Rel Res.
1991; 13( 4): 197-206.
Mucher J. USA Triathlon participation statistics estimate.
USA Triathlon
Official Website. 2006.
O'Toole ML, Hiller WD, Smith
RA,et a!. Overuse injuries in
ultraendurance triathletes.
Am J Sports Med. Jul-Aug 1989;17(4):514-518.
Rauh MJ, Koepsell TD, Rivara FP, et aL Epidemiology of musculoskeletal
injuries among high school cross-country runners.
Am J Epidemiol. Jan 15
2006; 163(2):151-159.
Scott B. Set-Up, Inc. Company Statistics. 2006.
Shaw T, Howat P, Trainor M, et aL Training patterns and sports injuries in
triathletes.
J Sci Med Sport. Dec 2004;7(4):446-450.
Vleck VE, Garbutt G. Injury and training characteristics of male Elite,
Development Squad, and Club triathletes.
Int J Sports Med. Jan
1998;19(1 ):38-42.
Weiss BD. Nontraumatic injuries in amateur long distance bicyclists.
Am
JSports Med. May-Jun 1985;13(3):187-192.
Wilk BR, Fisher KL, Rangelli D. The incidence of musculoskeletal
injuries in an amateur triathlete racing club.
J Orthop Sports Phys Ther.
Sep 1995;22(3):108-112.
Williams M, Hawley J, Black R, et aL Injuries amongst competitive
triathletes.
The New Zealand Journal of Sports Medicine. March 1988:2-6.
Table 1: Triathlon Race Lengths
Race Type
Swimming Length Cycling Length Running Length
Sprint
500 meters
20 kilometers
5 kilometers
Olympic/International
1500 meters
45 kilometers
10 kilometers
Half-Ironman
1.2 miles
56 miles
13.1 miles
Ironman
2.4 miles
112 miles
26.2 miles
Figure 1: Results of literature search
Study
Authors, Study Design Source Population Study Population Measurements Significant Results/Outcome Measures Year
74.8% (95% Cl: 71.3-78.1) of all participants sustained at least one injury since starting triathlon 6.7
±
4.1 yearsago.
German-speaking 656 responses (36%) Mail-in questionnaire distributed by race Overall injury incidence: 0.711 injuries per 1000 exposure finishers in lronman used for final data promoter to all German finishers of lronman hours.
Egermann, Europe 2000 (1833 analysis Europe 2000. Only significant risk factor for injury due to triathlon was eligible individuals),
Brocai, Lill Retrospective
July 9'", 2000 in Roth, Sex: Questions about demographic data, sport race performance time; faster the race time, higher the and Schmitt, survey Germany. No other
588 (90%) men, 68 participation history, training data, and injury risk of injury (OR= 0.766; 95% Cl: 0.663- 0.884). 2002 description given. women data answered by numbers and multiple
choice. Most injuries (54.8%) attributed to cycling. Age: mean 35 y
42.7% of athletes had a knee injury, 31.2% had a back injury, and 27.4% had an Achilles tendon injury 6wfold higher incidence of injury in triathlon competition compared to training.
116 responses (60%)
Mailwin questionnaires distributed to Overuse injuries occurred in 75.0% of Elite, 75.0% of used for final data Development, and 56.3% of Club triathletes. Elite, developmental, analysis triathletes with stamped reply envelopes. Athletes instructed to complete forms during
and club male
a hard training week without taper when Most common and most severe injuries were located in Vleck and Retrospec1ive triathletes in specific Sex:
close to peaking for a major race. Subjects the Achilles tendon, the lower back, and the knee. Garbutt, 1998 survey clubs in Great Britain 116 (100%) men, 0
reported location of injuries and subsequent (194 eligible women
training days lost. Returns encouraged by Elite Development Club
individuals) Running injuries: 62.1% 64.3% 58.7%
Age: mean 27 y for elite personal contact, by a second questionnaire and personalized letter, and by telephone Cycling injuries: 34.5% 25.0% 15.9% and development, 35 y
calls. P value: <0.05 <0.05 <0.05 for club
Tennant 38
"""'1!t!lftlr!'""'~i<''H'tJJT;j""'
Collins,
Wagner, Retrospective Seafair Triathlon (July participation history, coaching, medical 20, 1986) (600 eligible Sex:
Peterson and survey
individuals) 197 (77%) men, 60 history, and injuries. Returns encouraged 62% of injuries due solely to running; 8% running plus Storey, 1989 by second mailing to 25 non-responders, other; 12.5% cycling, and 11% swimming.
women
yielding 6 replies; T -shirt given to
Age: mean 32 y participants. Knee, shoulder, and ankle were most frequently affected. 730 questionnaires distributed to triathletes:
258 directly by one of the investigators or 155 responses (21%) via club secretaries; 250 by the National
used for final data Triathlon Coach at competitions; 222 via 37% of respondents reported at least one injury over the Recreational, analysis triathlon clubs. 8 week period.
Korkia,
intermediate, and elite Tunstall- Prospective
British triathletes (730 Sex: 580 started the questionnaire. Returns Ankle/foot, thigh, knee, lower leg, and back were most Pedoe and training diary through club secretaries or using self- frequent injury sites reported.
Maffulli, 1994 eligible individuals) 124 (80%)men, 31 addressed, stamped envelopes. Telephone women
calls to encourage non-responders. Injury incidence rate: 5.4 injuries per 1000 training hours Age: mean 34 y and 17.4 injuries per 1000 competition hours
Questions about demographics, training data; 8 week detailed training and injury diarv.
15% of triathletes surveyed reported injuries: 86% of these individuals had been involved with the sport for less 332 responses (59%) Mailed questionnaire randomly mailed to than two years.
Participants in three used for final data 200 short course, 200 middle course, and
53% oftriathletes reported running as the activity Williams, triathlons of different analysis 160 long course triathletes via race directors
associated with injury Hawley, Retrospective lengths in New
Black, Freke Zealand; 560 total Sex: Demographics, sport participation history,
and Simms, survey questionnaires 251 (76%) men, 81 weekly training, and injuries (defined as Knee was the most frequent site of injury (22%), followed 1988 distributed women feeling " ... really uncomfortable ... during by lower back (17%), and fooVankle (14%)
training or racing" or if required "stopping
Greater number of injuries associated with long course Age: mean 29 y training or pulling out of a race"
compared to middle and short course distance triathlons. Good discussion section in this article.
Runner's Club were 24 survey items used to identify 78.9% of injured participants had injuries attributed to identified as the largest Sex: demographics, injuries, and the impact of "overuse", 33.3% had injuries due to trauma. group of amateur 41 (57%) men, 31 women injuries on training, racing, working, or daily
triathletes that was activities. Triathlon related injuries hindered daily activity 63.9% of easily accessible." Age: mean 38 y the time, caused permanent loss of function 4.2% of time,
Questions were closed-end, fixed yes/no and significant absence from work 15.3% of time. format.
Non-triathlon injuries prevented training or competition The term 'injury' was clearly defined. 45.8% of time.
Manninen Retrospective 185 members of 10 92 responses (50%) used Demographics, injuries (focus on low back Low back pain (LBP) experienced by 32% of subjects and Kallinen, survey Japanese triathlon for final data analysis pain) over the past year. over the previous year.
1996 clubs in Kinki, Chubu,
and Kanto in March Sex: Questionnaire piloted, found to have high 54% of LBP lasted < 7 days, 19% lasted > 3 months. 1994 70 (76%) men, 22 women test-retest reliability.
Knee (33%) was the most common site of injury, followed Age: mean 31 y Questionnaires mailed to representatives of by back and shoulder.
the 10 clubs, who then distributed
questionnaires to club members. Theorize about LBP and triathlon training/competition. Authors raise point of selection bias
because uninjured triathletes do not participate in survev.
Shaw, Howat, Retrospective Sample of 500 258 responses {52%) Mail-in questionnaire, small prize offered as 62% of individuals sustained at least one injury in the last Trainor and survey triathletes was used for final data incentive. triathlon season.
Maycock, randomly selected analysis
2004 from the Triathlon Questions about demographics, injuries 30%.> sustained 1 injury, 22% sustained 2 injuries, 10% Association of Western Sex: (clearly defined), training practices sustained 3 or more injuries.
Australia's members' 190 (74%) men, 68
mailing list. women Triathletes who train for the longest and shortest periods of time tend to sustain injuries more often than those who Age: mean 35 y train the intermediate lengths of time.
Time spent on swimming training does not affect injury risk.
Authors, Study Design Source Population Study Population Measurements Significant Results/Outcome Measures Year
Marti, Vader, Retrospective Male participants, 4,358 responses (83.6%) Race participants received questionnaire in 45.8% of participants had sustained "jogging" {German Minder, survey residents of used for final data mail with race information. On race day, all joggen means running) injuries in the past year.
Abel in, 1988 Switzerland, over the analysis. participants were required to turn in the
age of 16, in the 1984 questionnaire, completed or not, in order to 14.2% of participants had required medical care. Grand Prix 16 km road Sex: 100% men register for the race.
race in Bern, 2.3% had missed work because of injuries.
Switzerland. Age: no mean age Questions about training and injury over the
reporled previous 12 months; asked total number of Occurrence of injuries was independently associated with kilometers run in the past year, years of higher weekly mileage (P< 0.001 ), history of previous running, type of shoes, usual running running injuries (P<0.001 ), and competitive training surface, use of orthotics, height, weight, motivation (P = 0.03).
medical visits, work absences, motivation
for training and competing. In 33 to 44 year old men, number of years of running was inversely related to injury incidence (p = 0.02).
Achillodynia (11.6%) and calf muscle (8.9%) symptoms were the most commonly reported overuse injuries, occurring more with increasing mileage. Knee, lower leg, and foot/ankle were the most frequent general areas of injury.
Acute traumatic injuries: 27%; overuse injuries: 70%.
Tennant 41
Hoeberigs, survey/diary regional Netherlands experience; 73 (65%) Recurrent injuries not counted twice. Increased incidence of injury over time in successive Janssen, and newspaper for people completed their training phases of training: 13%, 17%, and 18%, respectively. Verstappen, with little or no running diaries adequately for Participants had all-day access to an
1989 experience who final analysis experienced coach, with weekly group Related to exposure time, there was a decreased injury wanted to train for a training sessions. Special attention was incidence over the total study period.
marathon in 1.5 years. Sex: 83 (72%) men, 32 paid to preventive measures for all athletes.
women Knee (25%) and lower leg (21%) were most common Study participants progressed through 3 location of injury.
Age: mean 35 y phases, competing in a 15km, 25km, and
42km race at the end of respective phases. Achilles tendon injuries localized more to left side. Training consisted of endurance, speed, Chance of injury increased with running distance and interval training. covered.
Reasons for dropouts (42 total) included P value < .05 considered significant. lack of motivation, illness, vacation, and
iniurv(14).
August 2002, the Masters runners ~ 40 than younger runners (45%) (P<0.05). largest running relay in years old): The survey contained 27 questions
North America, with 34% of runners; 65% of including descriptive information about More masters runners suffered multiple injuries than approximately 12,300 these runners male running experience, training patterns, shoe younger runners (P<0.001 ).
participants. characteristics, orthotic use, injury patterns,
Younger runners (<40 and diagnosis. A running injury was defined Significantly more masters runners were male, had 7 or The 36 legs of the years old): as an event that affected the athlete's ability more years of running experience, run more than 30 relay ranged from 3.9 66% of runners; 50% of to train or race over the previous 1 year miles/wk, 6 or more times/week and wear orthotics than to 8.2 miles. these runners male period. younger runners (P<0.001 ).
Overall age not reported. Each participant was required to log into the The knee (19.6%) and foot (16.2%) were the most survey, using the assigned username and common locations of injury for both groups. Overall sex: -1587 (55%) password. This ensured each participant
men, 1299 women could complete the survey only once. The prevalence of softRtissueRtype injuries to the calf, (based on calculations achilles, and hamstrings was greater in masters runners from rounded An email was also sent to the captains of than their younger counterparts
percentages) each team of 12, informing them about the (P<0.001). study and asking them to encourage their
team to participate. Younger runners suffered more knee and leg injuries than masters runners (P<0.005).
As an incentive to participate in the study,
runners who completed the survey were Running more times/wk increased the risk of injury for entered in a drawing for prizes. both groups.
Campbell, from participant list of Knee was the most common site of injury (0.14 knee 1982 the July 4, 1980 693 (49%) men and 730 Random sample of non-respondents to both injuries per person-year of running).
Peachtree 10-K women questionnaires given phone interview to
road race in Atlanta, Ga determine if any differences between No confidence intervals or p values given for injury data. (- 25,000 participants); Age: mean 31 y respondents and non-respondents.
-80% of race Good discussion about external validity.
participants were men Respondents vs. non- Questions about demographics, smoking,
respondents (phone reasons for starting running, weekly I interview): 66 (91.7%) of mileage, hazard encounters, injuries, and
72 men and 32 (86.5%) response to injuries. of women
non respondents differed significantly only from respondents by age (respondents older); more non respondents stopped running and had been hit by a thrown object.
Tennant 44
Margherita study during the 1996 crossw crosswcountry teams in 12 prior running and injury experience, (19.6/1 ,000 AEs) than boys did (15.0/1 ,000 AEs) and Rice, country season. Seattle, Washington, high anthropometric measurements, and (incidence rate ratio: 1.3, 95% confidence interval: 1.0,
2006 schools. coaches' training logs. 1.6).
No differences between Injury clearly defined by authors: A running Compared with boys, girls had significantly higher rates participants and non- injury was defined as any reported muscle, of injuries resulting in .:::_15 days of disability.
participants regarding joint, or bone problem/injury of the back or
gender. lower extremity (i.e., hip, thigh, knee, shin, For the overall sample and for girls, Cox regression calf, ankle, foot) resulting from running in a revealed that a quadriceps angle of ::,20° and an injury Sex: 235 (56%) boys and practice or meet and requiring the runner to during summer running prior to the season were the most 186 girls be removed from a practice or meet or to important predictors of injury.
miss a subsequent one.
Age: no mean age For boys, a quadriceps angle of .:::_15
°
and a history of reported; presume all Injuries that occurred outside of practices multiple running injuries were most associated with injury. participants between 14 and meets were excluded.and 18 y The shin was the most common body part initially injured Quadriceps angle measured by one of (3.6/1 ,000 AEs), followed by the knee (2.5/1 ,000 AEs) authors at beginning of study. and ankle (1.2/1 ,000 AEs).