Master‟s Paper for the M.S. in L.S degree. April, 2011. 54 pages. Advisor: Claudia Gollop
Over the past few decades, reference work has altered as a result of advances in
information technology. The purpose of this study is to investigate how questions posed at the Internet Public Library (IPL) virtual reference desk changed over time in difficulty, a concept challenging to define and to measure. Evaluation of reference work has taken a great variety of forms, but no consistent measure examining reference question difficulty has dominated. Few studies have examined reference question difficulty, and those looking at difficulty over time are even rarer. A modified content analysis was used to analyze questions posed to the IPL from 1996 to 2008. An intercoder agreement measure was completed to test reliability. No significant change was found in difficulty of IPL questions over time but satisfactory intercoder reliability was found for the difficulty rating approach. This study supports use of difficulty rating of questions and suggests future research.
Headings:
Internet Public Library/Reference services Reference services/Evaluation
Electronic mail
by
Kathryn J. Oberg
A Master‟s paper submitted to the faculty of the School of Information and Library Science of the University of North Carolina at Chapel Hill
in partial fulfillment of the requirements for the degree of Master of Science in
Library Science.
Chapel Hill, North Carolina April 2011
Approved by
Contents
List of Tables and Figures... 2
Introduction ... 3
Organization ... 6
Motivation for the Study ... 6
Literature Review... 7
Reference Question Type ... 7
Studies of Reference Questions over Time ... 12
Studies of Reference Question Difficulty ... 14
Method ... 21
Results ... 27
Question Difficulty ... 27
Question Length ... 30
Discussion ... 32
Reliability and Validity of the Difficulty Rating ... 32
No Change in Difficulty Found ... 32
Scale Size ... 34
Question Length ... 34
Conclusion ... 35
Improvements ... 36
References ... 38
Acknowledgements ... 43
Appendices ... 44
Appendix A. Examples of the Internet Public Library question forms. ... 44
Appendix B. Coding Scheme ... 48
Appendix C. Difficulty rating scales used by other researchers ... 49
List of Tables and Figures
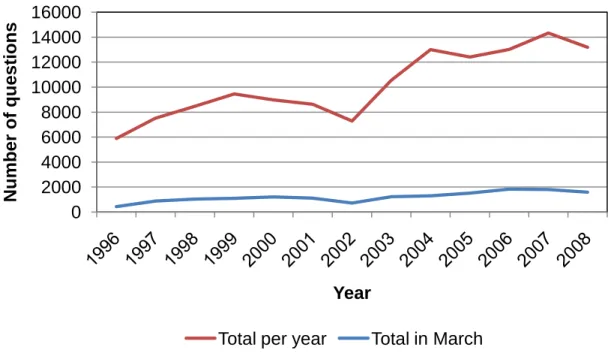
Figure 1. Questions posed to the Internet Public Library 1996-2008. ... 27
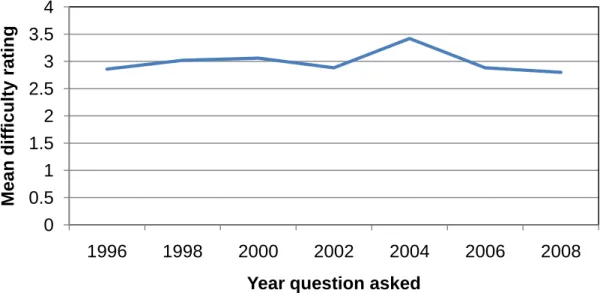
Figure 2. Mean difficulty rating of questions over time 1996-2008. ... 28
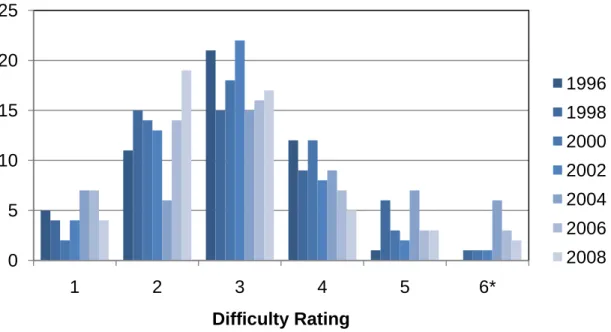
Figure 3. Histogram of number of questions by difficulty rating and year.. ... 29
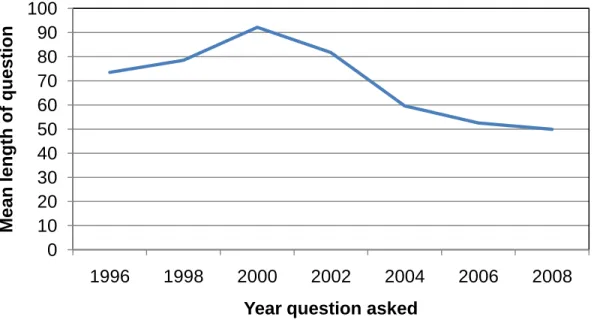
Figure 4. Mean length of questions over time 1996-2008. ... 30
Figure 5. Box plot distribution of length of e-mails for each year 1996-2008. ... 31
Figure A1. Ask an ipl2 Librarian Question Form. http://www.ipl.org/div/askus/ Retrieved March 28, 2011 ... 45
Figure A2. IPL Ask a Question form. http://www.ipl.org/ref/QUE/RefFormQRC.html retrieved by the Wayback machine at archive.org May 14, 1997 ... 47
Figure D1. Percentage of questions by rating 1996-2008. ... 50
Table D1. Means of difficulty rating by year 1996-2008. ... 50
Table D2. Regression analysis of the relationship of time on difficulty. ... 51
Table D3. Regression analysis of the relationship of time on length of question. ... 51
Introduction Desk Reference Services Today and Yesterday
The Reference and User Services Association of ALA (2008) defines “reference work” as including “reference transactions and other activities that involve the creation, management, and assessment of information or research resources, tools, and services.”
In the beginning of a reference transaction, a patron has a question and
approaches a reference desk or librarian to find an answer or further information. In the new era of virtual reference, approaching a librarian or desk can take many forms.
Sending an e-mail, engaging in IM or chat reference with a librarian, making a phone call and walking up to a physical desk are among the most common acts.
Over the past twenty years, the numbers of questions asked at academic library reference desks have dropped dramatically but have not disappeared (Martell, 2008). Numerous studies have examined reference both before and after this decline began (Powell, 1984; Saxton, 1997; Kuruppu, 2007). Some researchers have specifically examined the reference question (Derr, 1984; Pomerantz, 2005). Other studies have looked at question type for its utility in examining other aspects of reference (Jahoda, 1974; Saint Clair, Aluri & Pastine, 1977; Lynch, 1978; Sullivan, 2004) with a few
Over the past few decades, the rise of the internet has dramatically changed the technology that the general U.S. population uses. Personal computers and internet access are now quite common in the home. In 1997, only 18% of homes had access to internet. In 2009 that number had risen to over 68% (U.S. Census Bureau, 2010).
Along with the rise in access, new developments have emerged in internet tools, data storage and retrieval, and other information technologies (Bunch, 2004, p. 625). Information has become increasingly important to society, and techniques and tools for retrieving information have multiplied. Data acquisition has increased to the point that in certain fields of study, there is too great an amount of data to be processed at one time (Bunch, 2004, p. 632). The tools patrons may use to access the internet are improving but sheer amounts of information have also increased, making former database search
techniques less effective. Search engines like Google and Yahoo! emerged during the 1990s offering features like page ranking as opposed to traditional Boolean searching of thesauri and revolutionized the way many people search for information (Girard, 2009, p. 12). Google.com, beginning in 1996 as the BackRub search engine (Google, n.d.)
eventually became the main search engine for many millions. Some go so far as to say that for millions of people Google is synonymous with the internet (Vise, 2005, p. 1) and that by offering “free” instant access to information Google has changed the lives of millions (Vise, 2005, p. 11). With the development of various search technologies, internet users have easier access to information they need.
answering questions from the general public (Internet Public Library,2009). From the very beginning the library was both a collection of links to online resources and a
reference service. The founding of the IPL predates Google‟s swift rise to prominence. While these means to access information have emerged, reference questions at physical reference desks have slumped. Janes (2003) and others attribute the decline in reference questions directed toward librarians to the rise of the internet and other technologies (p. 24-25). Patrons now have the ability to find and access many answers somewhere other than the library. Despite these significant changes, patrons are still asking questions of librarians. This raises several questions:
What are the characteristics of the questions patrons are asking librarians today compared to the past?
Have the questions that are still asked at reference desks changed substantively in level of difficulty because less difficult questions can presumably be answered easily by an internet search?
Have patrons' questions changed so much in difficulty that past studies need to be re-examined and re-imagined?
The first question is rather broad and cannot be easily answered here. However this research explores the second question, and partially provides an answer to the third question. The purpose of this study was to investigate the effect of time on the predicted difficulty of reference questions. The study sought to answer the question: How have the questions posed to the Internet Public Library changed over time in regard to predicted difficulty? Difficulty is defined here with a definition from the Oxford English
Organization
After the remainder of the introduction that discusses research motivation, the second section of this paper is a literature review, situating the research problem within the LIS literature. The third is a methods section exploring the procedures that were undertaken to look into the research question. The results section illustrates the findings and the discussion section analyzes the findings. The last section of the paper offers conclusions.
Motivation for the Study
In response to this decline in reference questions, Janes (2003) suggests that librarians “…declare victory and move on” (p. 25). People are still finding answers to their questions, albeit not through the library. Yet to move on one must consider the present state of affairs in desk reference services. Many questions are still asked at reference desks every day all across the nation. Library schools still train students to be reference librarians and despite the decline in the quantity of desk questions, the
reference desk is still an important component of reference work.
Literature Review
The goal of this literature review is to place studies of reference questions within the larger body of reference research, review previous studies of reference question difficulty, and show that while this topic is of importance, no one has directly measured question difficulty over time. The first section of the literature review discusses findings from articles examining large numbers of reference studies and synthesizes and compares selected articles that have undertaken study of reference questions, whether as the direct aim of the study or as part of a larger objective. The second section reviews studies of reference questions over time. The last section examines studies on reference question difficulty.
Reference Question Type
The classification of reference questions has a long history in the library and information science literature. Powell‟s (1984) literature review describes large numbers of empirical studies in the area of reference effectiveness. Powell (1984) observed that many studies focused on enumerating questions types as opposed to evaluating the response to questions. Powell emphasized specific studies of question type that were relatively sophisticated (p. 9).
Despite a long history of studies evaluating question type, no uniform reporting measures have developed. Some libraries divide questions by categories such as
classifications practiced in libraries, see Novotny (2002). Reference data have a long history of being inconsistent and varying by the location under study and researchers‟ individual requirements and choices. Saxton (1997) investigated the possibility of meta-analysis being used to study reference service evaluation. While only concerned with reference accuracy as an outcome variable, Saxton noted for the independent variables a total of 38 evaluative concepts defined 162 different ways. Only ten were repeated from study to study and none of those were reference question statistics. Saxton concluded a lack of standards in reporting variables and their measurement. If studies with the same goal are compared and found to vary widely, the variability in all studies is undoubtedly greater.
Kuruppu (2007) conducted a review of much of the literature in evaluation of reference research using both qualitative and quantitative methods. When looking at studies that examined reference statistics, Kuruppu went further to question the
has been very important in this study to get as close to the raw reference question as possible.
Some studies have individually focused only on the question asked, even though the question does not represent the full interaction between patron and librarian and does not evaluate the entire interaction. These studies have often broken down questions into categories. Many academic libraries in the United States keep track of question types (without also keeping track of the reference interview) for evaluative and reporting needs (Worley, 1989) because reports question type can be useful for internal purposes to provide a description of reference work at an individual library. The study of question type by itself may not be highly useful to the researcher; this is an issue that Cottrell and Eisenberg (2001) examine.
provide information professionals with deeper knowledge of patron questions (Derr, 1984).
Pomerantz (2005) reviewed five different question taxonomies for the purpose of examining their levels of linguistic analysis for possible use in machine analysis, in some ways analogous to earlier work by Jahoda (1974). The taxonomies found by Pomerantz include 1) Wh- words (who, what, where…) 2) Subjects of questions 3) The functions of expected answers to questions 4) The forms of expected answers to questions and 5) Types of sources from which answers may be drawn.
The two studies listed above have found classifying reference questions useful. Other studies have not focused directly on dissecting reference question type but have looked at it as a characteristic affecting the results of the study, rather than as data measured by itself. Examples of these studies include Jahoda (1974), who speculated as to machine effectiveness of answering reference questions. Also, Saint Clair, Aluri and Pastine (1977) examined question type as affecting whether paraprofessionals would be qualified to answer questions, while Lynch (1978) used question type in order to analyze the reference interview. Reference researchers have often focused on the reference interview when examining interaction between patrons and librarians. Lastly, Sullivan (2004) examined question type in order to observe whether it might affect costs and benefits in e-mail reference.
Jahoda (1974) examined 28 questions using a nine-step manual procedure,
by a brute force approach and that the human reference librarian would continue to be a main player in the reference process in the foreseeable future. It should be noted that the questions were not chosen randomly, but were rather a convenience sample.
Saint Clair, et al. (1977) examined reference questions, categorizing them into four types (directional, instructional, reference and extended reference, which were then further subdivided) to examine the proportion of questions that could be answered by carefully trained non-professionals as opposed to professional librarians. They concluded that 80% of the questions could be answered by the non-professionals, indicating that some questions required special training. The sample used was from a single period of time and was not described.
The purpose of Lynch‟s (1978) study was to describe the structure and form of the verbal reference interview in small public libraries. She used audio recordings of 309 interview transcripts, divided them into transaction types (directional, holdings, substantive and moving) and created two models of the reference interview which pertained to certain types of questions (Lynch, 1978). Considerable numbers of studies since have analyzed and evaluated the reference interview (White, 1981; Bunge, 1984; White, 1985). In the past fifteen years virtual services such as chat reference have enabled the automatic capture of reference interviews.
physical desk reference to answer the same question. About half of the questions examined were research questions and each took a little more than an hour to answer, leading her to question the benefits of offering e-mail reference for research questions when other services may be cheaper and better fulfill library aims.
In all of the reference studies discussed above, questions have been categorized for a specific purpose and the typing techniques differ from one another. While none look at reference question difficulty directly, by looking at question type, some, indirectly, include difficulty in their analysis. Thus, a change in reference question difficulty over time might affect the results of these studies. While some studies may be replicable, none of those mentioned are longitudinal studies and very little cross-comparison of question type can be made. Longitudinal study, cross-comparison, and replication would be very difficult, if not impossible without going back to the raw data, the reference question and/or entire reference process. The next section addresses studies that have looked at change over time.
Studies of Reference Questions over Time
question (p. 404). It must be added that reference questions have increased in virtual reference, a reference service nearly nonexistent twenty years ago.
Seng (1978) examined reference questions over a three year time period at her academic library. Seng‟s study focused on reducing numbers of directional and informational questions in order to increase staff time spent on difficult “general
reference” questions and other duties. The questions were collected over three years and analyzed at the end of the period. Results showed a decrease in “directional” and
“informational” questions in comparison to “reference” questions. The study suggests that libraries can improve their efficiency and effectiveness by noting questions over a six-month period and tabulating the results. She also argues that collecting such a sample would 1) pinpoint deficiencies, 2) provide a basis for comparison for later smaller
samples, 3) push librarians to focus on the improvement of service, 4) alert librarians to new questions, 5) help departmental evaluation, 6) help in training, 7) justify new positions and acquisitions, 8) help formulate policy and 9) help librarians note interests for user programs. These possible benefits are very institution-specific but point toward the value of keeping historical data.
Saxton (1997) and White and Iivonen (2002) note the absence of longitudinal reference evaluations studies. Saxton (1997) attributes this to a lack of standards for reporting results, and for variation in variables chosen and their measurement (p. 282). This lack of longitudinal studies indicates a deficiency in the literature which this study addresses.
While some reference questions have stayed the same, patron behavior has undoubtedly been influenced by the increasing numbers of sources of information available online. Now a question that was previously asked at a library may well be typed into a browser search box almost anywhere. The specific content of many questions has changed, but have questions changed in difficulty? While difficulty might often be implied by
categories chosen for reference statistics in the works discussed above, other research has examined difficulty directly. The next section discusses this subset of studies that examine difficulty specifically.
Studies of Reference Question Difficulty
Difficulty has not historically been considered an easy concept to measure. Robinson (1989) defines “difficulty” as the term for the librarian-judged “level of effort anticipated or required to handle a question” (p. 52). Her study describes the
development of a model of question handling including a vocabulary and a conceptual framework. The model provides for 1) developing a strategy to address questions 2) evaluation of the strategy and 3) relating levels of service to resource needs (p. 48). Robinson (1989) contends that librarian judgments when carrying out the reference services are challenging to quantify (p. 49). She concludes by arguing that: “If libraries were to generate statistics using the concepts provided in this model, we would have a clearer understanding of how reference staff spend their time and the level of information resources they deploy” (p. 61).
of work, Childers, et al. (1991) state that such studies “have considered time, effort, and skills required to perform a task as measures of the complexity or difficulty of the task, and also have used assessments of task difficulty made by the individuals who performed the tasks” (p. 239).
Along with Robinson (1989) and Childers, et al, (1991) a few other researchers have studied the relative difficulty of questions including Michell and Dewdney (1998), White and Iivonen (2002) and Janes (2002). As mentioned, Saint Clair, et al. (1977) concluded that 80% of questions asked on randomly selected days at the University of Nebraska at Omaha library could be answered by non-professionals, implying that some questions would be harder for non-professionals to answer and should be routed to experienced professional librarians. Brown (1985) characterized phone reference questions by level of complexity (as well as Dewey Decimal subject and answer format) and related these variables to each other. Brown (1985) defined complexity in terms of the specificity of the source needed to answer the question. Later studies have included (see White & Iivonen, 2002) complexity as a component of reference question difficulty, but again, these measures do not appear to be comparable.
The purpose of Childers, et al. (1991) study was to create a measurement method of reference question difficulty and, secondarily, to find out if other, more easily
to record the data on questions forwarded from local libraries to the system offices providing reference back-up (Childers, et al., 1991). Variables were measured through the use of numerical scales, except for time spent and number of sources, which were measured directly and then converted to scaled variables (Childers, et al., 1991).
The researchers calculated the correlations between other variables and actual (perceived) difficulty, and predicted difficulty with knowledge of subject and sources (by the librarian answering the question). They found that the actual difficulty and predicted difficulty were correlated with a Pearson‟s r of .52 (Childers, et al., 1991). Childers, et al. (1991) suggest a measure for difficulty of reference questions and enumerate a number of possible proxies that might be used instead of actual difficulty. Of these proxies, they contend that time spent answering a question, number of sources consulted, ease of access to sources and predicted difficulty are all moderately-to-strongly (0.52 and above) correlated with actual difficulty (Childers, et al., 1991).
The researchers indicated that there might have been bias from two sources. One source might have been the recording of one variable possibly affecting the recording of others. A second source was possible librarian (the recorders) fear that the forms would be used for performance evaluations (Childers, et al., 1991). The study did not analyze changes in difficulty over time.
questions, time spent answering may not be a valid measure, despite its usefulness in the Childers, et al. study. Predicted difficulty is the only measure that would be feasible, of the ones Childers, et al. (1991) suggest, for comparing questions alone without examining entire reference interviews.
Michell and Dewdney (1998) conducted an empirical study of perceived level of difficulty of reference questions reported by patrons and librarians before and after reference transactions in order to examine the mental models theory. They analyzed 33 pairs of interviews. They found no statistically significant correlation between the level of difficulty both users and librarians assigned the questions before and after the
transaction. In particular, the researchers found that there was no correlation between how difficult librarians perceived the question to be before and after the question was asked (Michell & Dewdney, 1998). Michell and Dewdney suggested two reasons for this: 1) The questions asked may not be the actual query the patron wants answered and 2) Librarians may face unexpected challenges in searching for what appears to be a straightforward answer. The researchers attributed this second reason to the librarian‟s conceptual model not living up to the reality (Michell & Dewdney, 1998). Michell and Dewdney‟s (1998) study discouraged the idea that predicted difficulty can proxy for actual difficulty in contrast with the moderate correlation found by Childers, et al. (1991). However, the Michell and Dewdney study only concerned a very small sample of 33, whereas the Childers, et al. (1991) study consisted of analysis of data from 658 questions. Neither study examined intercoder reliability in their study.
reasoning of experienced web searchers on sixteen different search questions of four types: closed/predictable source, closed/unpredictable source, open/predictable source, and open/unpredictable source. The authors found that participants consistently view closed/predictable source questions as easy and open/unpredictable source questions as difficult. The study also indicates additional qualities of questions that make them perceived as more difficult. In the qualitative part of the study the researchers found that participants think that numerous variables also affect ease and difficulty, respectively. The variables affecting ease were searchability, clarity, familiarity/currency, public knowledge, simplicity, and specificity. The variables affecting difficulty were searchability problems, diffusion of information, noise, breadth, lack of clarity,
postsearch processing, overload, unspecified "feeling," likelihood of being on the web, unfamiliarity, and complexity. This breakdown of aspects of questions that affect level of difficulty is valuable, but there is no numerical quantification of how prevalent these characteristics are in questions either now or in the past.
White and Iivonen (2002) specifically point out a lack of research on the difficulty of questions, which they found surprising given its importance in other areas such as information retrieval (p. 206). The studies above use diverse measures for
difficulty, but there are few of them. Not one analyzes change in question difficulty over time, indicating a possible deficiency in the literature. Yet other authors have made attempts to address this question, with inconclusive results.
sizes asking questions about 1) their experiences and attitudes toward technologies used in reference, 2) experience and attitudes toward print and digital resources, 3)
demographic questions, 4) professional training and position, and 5) their perception about changes in numbers and difficulty of questions their reference services were receiving. One question was “Would you say that the reference questions your library receives overall are getting easier to answer, more difficult to answer, or staying about the same?” (Janes, 2002, p. 566). The results of this particular survey question have direct bearing on the research question. The results revealed that while 9% thought that questions at their desks were increasingly easier, 31% thought they were getting more difficult and 55% said the questions were staying about the same level of difficulty. Janes argues that this result provides evidence that overall questions are getting
somewhat more difficult although he noted that the survey relied on librarian recall rather than examination of actual questions (Janes, 2002, p. 553). Janes‟ study is interesting in that it directly addresses the subject of the research question and finds a mixture of opinions on whether questions have become more difficult in general.
also to select the best databases to meet their research needs” (Gray, 2000, p. 367). While using tangentially related literature to support this assertion, Gray does not explain this further. The lack of evidence found in the literature review suggests few empirical studies have been made despite a general assumption that questions are getting more difficult.
The most significant challenge implied by the literature is the challenge of defining the concept of difficulty. However, as previous studies indicate, research has been performed in this area using various methods. There appears to be little consensus on the best way to measure reference statistics, let alone question difficulty.
Furthermore, historically there has been a deficiency in longitudinal studies. A
longitudinal study of the change in predicted difficulty of reference questions fills a gap and supports the research and educational needs of present and future librarians.
Method
The method chosen to examine the research question is a modified form of content analysis. Content analysis is a quantitative method aiming to systematically and objectively analyze message characteristics (Wildemuth, 2009). Originally designed to turn qualitative messages into quantitative data, content analysis depends on the
application of the scientific method. Characteristics of message content are counted and can be used to look at distribution and relationships between messages, even across time. Most content analysis deals with manifest content, content that is directly observable. Some content analysis studies have examined latent content, which is more difficult to measure and may present challenges to establishing validity (Wildemuth, 2009).
A reference question is a form of message, and thus in its textual form presents rich data that can be analyzed by content analysis. The researcher was interested in examining changes in the difficulty of reference questions, and difficulty is an example of latent content. The latent difficulty of the question is the dependent variable examined at regular intervals over time in this study. This conceptualization of difficulty, as defined in the introduction and described in the literature review, cannot be measured directly. It is examined indirectly through a rating of the overall message, a modification of content analysis.
members of the public to the IPL. All correspondence was received through an e-mail or through the reference form. Examples of these forms are in Appendix A. Internet Public Library data is available from every year since 1995 and was chosen because of its availability to the researcher. Significant time and effort was put into finding other sources of data at reference desks, with no success. E-mail reference by its nature is text-based and easily stored.
The use of this data required application to the University of North Carolina at Chapel Hill (UNC-CH) Institutional Review Board (IRB) for permission to use
secondary data. This step in the process was completed and IRB expedited approval was given for this study (UNC-CH IRB Study No. 11-0159). Question confidentiality was one of the central concerns of the research and included making sure that confidentiality of all questions was kept through appropriate storage and data handling. Data was stored on the researcher‟s laptop and in a de-identified paper form. All data was also stored on the encrypted storage network Carbonite, with a password known only to the researcher although encryption is managed by the company.
Once permission was gained from the Institutional Review Board, the data was cleaned and prepared for analysis. Despite alternatives, the unit of analysis was the e-mail message with a question or questions sent to the Internet Public Library. The numbers of questions in 1995 is not a large number and since the library was in its beginning stages, included many test questions, 1995 was not be studied. The sample chosen was a random selection of e-mailed questions asked from 1996, 1998, 2000, 2002, 2004, 2006, and 2008. The even years were chosen because they presented a way of consistently measuring the data. It did not appear feasible to analyze a statistically significant sample from all years. Care was taken to account for any seasonal differences in questions by choosing only questions from the same month, March, of each year. Fifty questions were examined from each year. The sample of questions studied was selected by the use of a random number generator. Questions were de-identified completely and stripped of the librarian responses if given, as it is the question rather than the full exchange under study. Some e-mails contained multiple questions or statements, but were analyzed as a single “question” or unit of analysis.
In e-mail reference the process of negotiation is lessened and in this study, only the initial e-mail was examined, even if a librarian request for more information received a response from the patron, a rare occurrence. Additionally, because of the large volume of queries relative to volunteers in the past, some questions were not answered by
librarians because there were not enough volunteers to answer them. Instead, a standard message was sent back to question askers, explaining that the large number of questions received prevented a response. The researcher‟s sample included both answered
rejected at random (e.g. sometimes questions were rejected because they were wider in scope), looking at librarian response in many cases was not even possible. Some
questions are frequently asked questions, and these questions often received answers that directed the patron to the relevant frequently asked reference question page of the
Internet Public Library site.
The questions were split into a database that contains links to date and other associated data. This was so that the data could be coded without knowledge of this information affecting coding. Masking the date information allowed analysis to proceed without knowledge of date biasing the study, although question content may have
occasionally revealed approximate year and other date information. Only the subject and body of the initial e-mail were kept for scrutiny.
Questions were rated on a five-point difficulty rating scale (see Appendix B for coding scheme) with an alternative category of unable to be determined. A rating of 1 means the question was very easy and a 5 means the question was very difficult with the numbers in between signaling the intervening levels of difficulty. The questions for which difficulty was unable to be determined were given a label of 6. The categories are mutually exclusive as is recommended with content analysis (Wildemuth, 2009).
This scheme is adapted from the instrument presented by Childers, et al. (1991) but using five-point scale instead of seven-point. It is similar to the coding of difficulty by Michell and Dewdney (1998) and similar to the survey question used by Janes (2002). See appendix C for their instruments. It is the coding scheme where this method differs from typical content analysis, as no manifest content was directly counted; instead, coders examined each e-mail and rated the latent difficulty of the question.
While the coding sheets were set-up to be used in a questionnaire type format, actual coding was done by printing out each e-mail onto a separate sheet of paper (separated from identifying elements) and dividing them into piles corresponding to the categories outlined above. This made rating and recording data a rapid process.
Questions were rated in batches of 65 to 100 questions, so that questions could be compared for consistency.
All preparation and rating of data was carried out during February and March 2011.
The validity of rating for difficulty is significant (although moderate) as shown by the Childers, et al. (1991) study, which found a correlation of rating difficulty with actual difficulty. The reliability of rating difficulty has not been examined in previous studies. For this reason, an intercoder agreement measure was done to examine reliability of the coding by the researcher and increase validity of the study. One experienced librarian with twenty years of experience was asked to help determine intercoder agreement to look at the consistency of the difficulty ratings of the researcher. Experience was required because the experience was believed to increase the validity of the intercoder agreement measure. Intercoder agreement is necessary in content analysis to make sure that results are not affected by a single researcher coding with bias and lack of this measure may invalidate studies (Wildemuth, 2009). The additional coder examined a percentage of the questions (100 of 350) to determine whether the measure has reliability. Statistical methods were used to compare their ratings with the researcher‟s and
determine the intercoder agreement reliability measure.
Results Question Difficulty
Description of data.
The sample of 50 questions from each year came from March of each year studied: 1996, 1998, 2000, 2002, 2004, 2006 and 2008. The number of reference
inquiries to the Internet Public Library over the months and years is illustrated in Figure 1 and shows an increase over time.
Figure 1. Questions posed to the Internet Public Library 1996-2008. The difficulty of each question was determined by rating each question
holistically and giving each question a rating of 1 to 5 with an unable to be determined
label of 6 given to some questions, which were removed from analysis. The excluded data were very few (zero to six for each year out of 50 per year), with only fourteen
e-0 2000 4000 6000 8000 10000 12000 14000 16000
Numb
e
r
of
que
s
tions
Year
mails of 350 (four percent) removed from analysis of both difficulty and length. Of the e-mails removed, six were questions rejected for legal or medical reasons because they were about topics a library is not ethically allowed to answer. Eight others were removed because the investigator was unable to determine to what the question referred.
The mean difficulty ranged from 2.68 to 3.07 over the years 1996 to 2008 as shown in Figure 2. The standard errors of the means overlap between some years. A table of the means is in the Appendix D (Table D1).
Figure 2. Mean difficulty rating of questions over time 1996-2008.
To better show the frequencies of different ratings over time, a histogram of ratings by rating and year was created (Figure 3). This shows the approximately normal distribution of ratings for each year. An area graph of difficulty ratings over time by percent is in Appendix D (Figure D1) showing the distribution in an alternate way.
0 0.5 1 1.5 2 2.5 3 3.5 4
1996 1998 2000 2002 2004 2006 2008
M e a n diff ic ulty ra ting
Figure 3. Histogram of number of questions by difficulty rating and year. (Note: *refers to questions for which difficulty was unable to be determined.) Regression analysis.
A linear regression model was run to see if there has been a significant change in difficulty levels over time. Years were entered as independent dummy variables and difficulty was used as the dependent variable. Results are shown in Appendix D (Table D2). The results indicated no significant change in difficulty over time. This followed the indications that the means overlap.
Intercoder agreement.
While the researcher coded all the data, because of interest in examining the reliability of difficulty, another librarian was asked to code a randomly chosen sample of 100 of the same questions. These ratings were statistically compared with this
researcher‟s to create an intercoder agreement measure illustrating the reliability of the difficulty rating.
0 5 10 15 20 25
1 2 3 4 5 6*
Difficulty Rating
1996
1998
2000
2002
2004 2006
Lombard, Snyder-Duch, and Bracken (2002) recommended several statistics for an intercoder agreement (reliability) measurement. However, they pointed out that there is no consensus on which is the best index (p. 593). Cronbach‟s alpha was recommended and used. Cronbach‟s alpha was found to be .716 when comparing the two raters with 91 items (all items coded as 6, unable to be determined, were removed from analysis) which indicates a satisfactory degree of agreement between the two sets of ratings.
Question Length Description of data.
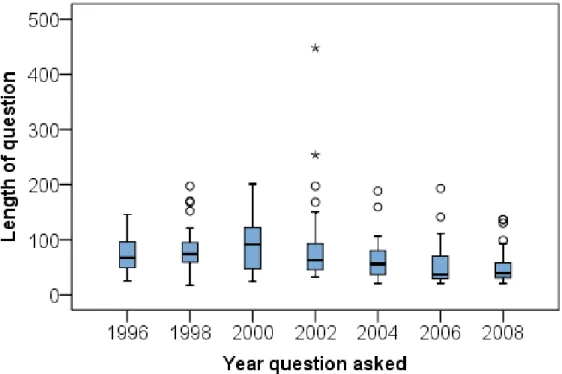
Length of questions was also examined as a variable possibly subject to change over time. Mean length of e-mails increased from1996 to 2000 while from 2000 to 2008 e-mailed questions were progressively shorter as illustrated in Figure 4. Length of question had a similar distribution, although there were more outliers with unconstrained measurement, shown in the box plot in Figure 5.
Figure 4. Mean length of questions over time 1996-2008. 0 10 20 30 40 50 60 70 80 90 100
1996 1998 2000 2002 2004 2006 2008
M e a n le ngt
h of ques
tion
Figure 5. Box plot distribution of length of e-mails for each year 1996-2008. Regression analysis.
Discussion Reliability and Validity of the Difficulty Rating
The results from this analysis, while inconclusive for difficulty over time, support the use of difficulty rating as a measure of looking at questions. The high intercoder reliability measurement is significant in its own right. The high intercoder agreement indicates that this measure has a significant level of consistency across different
investigators and samples and that this particular content analysis measurement could be used by different researchers to separate easy questions from difficult ones.
Validity for this measure depends of the work of a previous researcher, Childers et al. (1991). Combining the reliability found by this research and the correlations with actual difficulty found by Childer‟s et al. (1991) means that the measurement can be said to have satisfactory reliability and validity and that this approach may be generalized for use in other contexts.
No Change in Difficulty Found
There may be multiple reasons why no change was found in difficulty over time. Time may stand proxy for multiple variables. So, while the lack of significance in the regression analysis indicates that there appears to be no change in difficulty related to time, multiple forces may be acting in opposition to one another.
But this trend may be countered by a second influence on difficulty: an increase in the number of people with access to computers. These increases in worldwide internet access may be causing segments of the world population who were unable to ask questions before to join the digital forum and ask questions (which accounts for the increase in questions). These populations may have different characteristics and ask easier questions. For example, these new entries may have less advanced research skills compared to people who asked questions of the IPL earlier. A third factor affecting question difficulty might be the increase in the volume of information available on the internet. Despite an increase in ability to access information in general, relevant information may still remain difficult for non-librarians. An example might include people looking for specific information searching through irrelevant search results like blogs or commercial sites without finding useful information. While the information may be easier to access (e.g. freely available on the web) compared to information located in a book many miles away, it may still be challenging for users to find, whereas for librarians trained to identify more relevant sources and access parts of the deep web, the question may be easy. Fourthly, reference questions may have certain inherent characteristics that make them questions people ask at a reference desk. In other words, the idea that
someone is willing to bring a question to the reference desk automatically means the question is likely to fall within a certain range of difficulty. Finally, the format or medium used to ask a reference question may have an effect on the resulting difficulty levels.
in-person, via chat, or by phone for example. Virtual reference may lend itself to types of questions with a different difficulty profile than in-person reference.
Overall, the data support the measurement used in this study but do not support a conclusive change in difficulty of reference questions over time.
Scale Size
In the future, researchers may want to use a larger scale for difficulty to tease out differences over time. Colton and Covert (2007, p. 194) suggest that scales with more options can offer more precision than scales with fewer choices but that the research in this area is conflicting. A seven-point scale may be a more precise way to show
difference in difficulty among questions without sacrificing reliability. While there were no specific expectations on the part of the researcher, the lack of significance in
difference over time indicates that adjustments to the measurement technique might shed more light on changes in difficulty.
Question Length
Conclusion
In recent years the rise in internet technologies and other developments have significantly affected how patrons find information. Concurrent with the rise in internet use, numbers of questions at the reference desk have declined. Virtual reference questions have increased but not enough to account for the drop. The questions that are still asked (whether virtual or in person) may differ in content from questions asked in the past, specifically with respect to question difficulty.
Studies of reference questions are numerous, but the lack of uniformity due to attention to local needs prevents comparison across time. Few studies of reference questions over time have been completed. Studies of reference question difficulty differ in measurement methods and approach as improvements are sought. The one study that directly addressed reference question difficulty over time, Janes (2002), leaves the outcome ambiguous as to whether questions have increased in difficulty or not.
Anecdotal evidence suggests that reference questions may have become more difficult as technology has increased patron access to alternative sources for answers to their
questions. The reasoning for this assumption is that the easy questions can now be answered with a quick Google search and are not brought to the reference desk.
this study alone is not enough to determine definitively whether reference questions have increased or decreased in difficulty over time.
By showing that the intercoder agreement (reliability) was high despite a wide difference in rater professional experience, the study did confirm that question difficulty rating is a measure that can be generalized across work by different researchers. This study also contributes to the study of reference question difficulty by being the first to examine question difficulty over time through content analysis.
Improvements
This inconclusive result and the process of completing the study indicated the importance of a larger scale in coding difficulty. A five point-scale may not discriminate to the level necessary to note differences among questions. A larger scale such as seven-point or ten-seven-point scale may illuminate more subtle changes. In other words, a finer instrument may yield more interesting results without compromising validity and reliability.
illuminate changes in difficulty of reference questions. Finally, finding connections between question difficulty and specific populations might be attempted so as to see where information literacy efforts may have the most effect and to allow for more representation of underrepresented populations.
General assumptions about the change in difficulty of questions are not enough to justify decisions regarding staffing choices, the training of new librarians, and replication of previous studies. If future studies were to show that questions are changing
References
Brown, D. M. (1985). Telephone reference questions: A characterization by subject, answer format, and level of complexity. RQ, 24, 290-303.
Bunch, B. H. (2004). The history of science and technology: A browser's guide to the great discoveries, inventions, and the people who made them, from the dawn of
time to today. Boston, MA: Houghton Mifflin.
Bunge, C. A. (1984). Interpersonal dimensions of the reference interview - a historical review of the literature. Drexel Library Quarterly, 20(2), 4-23.
Childers, T., Lopata, C., & Stafford, B. P. (1991). Measuring the difficulty of reference questions. RQ, 31(2), 237-243.
Colton, D., & Covert, R. W. (2007). Designing and constructing instruments for social research and evaluation. San Francisco, CA: Jossey-Bass Publishing
Cottrell, J. R., & Eisenberg, M. B. (2001). Applying an information problem-solving model to academic reference work: Findings and implications. College & Research Libraries, 62(4), 334-347.
Derr, R. L. (1984). Questions - definitions, structure, and classification. RQ, 24(2), 186-190.
Difficulty, n. (n.d.). In OED Online. Retrieved from http://www.oed.com:80/Entry/52490 06 December 2010.
Google. (n.d.) Milestones. Retrieved from
http://www.google.com/corporate/milestones.html
Gray, S. M. (2000). Virtual reference services: Directions and agendas. Reference & User Services Quarterly, 39(4), 365-375.
Internet Public Library.(2009, April 27). Timeline of ipl2/IPL History. Retrieved from http://www.ipl.org/div/about/timeline/
Jahoda, G. (1974). Reference question analysis and search strategy development by man and machine. Journal of the American Society for Information Science, 25(3), 139-144. doi:10.1002/asi.4630250303
Janes, J. (2002). Digital reference: Reference librarians' experiences and attitudes.
Journal of the American Society for Information Science and Technology, 53(7), 549-566. doi:10.1002/asi.10065
Janes, J. (2003). What is reference for? Reference Services Review, 31(1), 22-25. doi: 10.1108/00907320310460852
Kuruppu, P. U. (2007). Evaluation of reference services—A review. Journal of Academic Librarianship, 33(3), 368-381.
Lombard, M., Snyder-Duch, J., & Bracken, C. C. (2002) Content analysis in mass communication: Assessment and reporting of intercoder reliability. Human Communication Research 28(4), 587-604. doi:
10.1111/j.1468-2958.2002.tb00826.x
Martell, C. (2008). The absent user: Physical use of academic library collections and services continues to decline 1995-2006. Journal of Academic Librarianship, 34(5), 400-407.
Michell, G., & Dewdney, P. (1998). Mental models theory: Applications for library and information science. Journal of Education for Library and Information Science, 39(4), 275-281.
Nicolaisen, J. (2009). Compromised need and the label effect: An examination of claims and evidence. Journal of the American Society for Information Science and Technology, 60(10), 2004-2009. doi:10.1002/asi.21129
Novotny E. (Ed.). (2002). Reference service statistics & assessment: A SPEC kit.
Washington, DC: Association of Research Libraries, Office of Leadership and Management Services.
Pomerantz, J. (2005). A linguistic analysis of question taxonomies. Journal of the American Society for Information Science and Technology, 56(7), 715-728. doi:10.1002/asi.20162
Powell, R. R. (1984). Reference effectiveness: A review of research. Library & Information Science Research, 6(1), 3-19.
Reference and User Services Association. (2008). Definitions of reference. Retrieved from http://www.ala.org/ala/mgrps/divs/rusa/resources/guidelines
/definitionsreference.cfm
Saint Clair, J. W., Aluri, R., & Pastine, M. (1977). Staffing the reference desk:
Professionals or nonprofessionals? Journal of Academic Librarianship, 3(3), 149-153.
Saxton, M. L. (1997). Reference service evaluation and meta-analysis: Findings and methodological issues. Library Quarterly, 67(3), 267-289.
Scott, V. A. (2008). Google. Westport, CT: Greenwood Press.
Seng, M. (1978). Reference service upgraded using patrons' reference questions. Special Libraries, 69, 21-28.
Sullivan, D. (2004). Characteristics of e-mail reference services in selected public libraries, Victoria, Australia. Reference Librarian, 41(85), 51-80. doi: 10.1300/J120v41n85_05
U.S. Census Bureau. (2010). U.S. Census Bureau. (2010). Computer Use and
Ownership: Current Population Survey (CPS) Reports [Data file].Available from http://www.census.gov/population/www/socdemo/computer.html [20 November 2010].
Vise, D. A. (2005). The Google story. New York, NY: Delacorte Press.
White, M. D. (1981). The dimensions of the reference interview. RQ, 20(4), 373-381. White, M. D. (1985). Evaluation of the reference interview. RQ, 25(1), 76-84.
White, M. D., & Iivonen, M. (2002). Assessing level of difficulty in web search questions. Library Quarterly, 72(2), 205-233.
Wildemuth, B. M. (2009). Applications of social research methods to questions in information and library science. Westport, CT: Libraries Unlimited.
Acknowledgements
I would like to thank my advisor, Claudia Gollop, for her extraordinary support and guidance; Tommy Nixon, for being the other coder and taking the time; Diane Kelly for helping me create my research proposal; Rebecca Vargha for assisting me with finding previous research, Darcy Gervasio, Bethany Mott, and David Pratt for their editing and proof-reading; Augustus Anderson at the Odum Institute for his help with the statistical analysis; and Jeffrey Pomerantz for helping me gain access to the data.
Appendices
Figure A2. IPL Ask a Question form.
Appendix B. Coding Scheme
Very Easy
Very Difficult
Unable to be Determined
Question 1 1 2 3 4 5 6
Question 2 1 2 3 4 5 6
Question 3 1 2 3 4 5 6
Etc.
Appendix C. Difficulty rating scales used by other researchers
1) “Both users and librarians were asked, independently:
1. Initially, how easy did you think it was going to be to find an answer to this question?
2. As it turned out, how easy was it to find an answer to the question?
A five-point rating scale was used where one indicated „extremely difficult‟ and five indicated „extremely easy.‟”
(Michell & Dewdney, 1998, p. 278) 2)
Predicted Difficulty, on a scale of one to seven, judged on intake of the question by the recipient. Recipients were instructed to estimate the average difficulty of the entire question.
(Childers, et al., 1991, p. 241)
3) (Survey Question)
Appendix D. Additional Figures and Tables
Figure D1. Percentage of questions by rating 1996-2008.
(Note: Pay attention to the width between the lines rather than the slope of the lines.)
Table of Means
Year N Mean Std. Error
1996 50 2.86 0.137
1998 49 2.96 0.165
2000 49 3.00 0.140
2002 49 2.82 0.136
2004 44 3.07 0.193
2006 47 2.68 0.161
2008 48 2.67 0.144
Table D1. Means of difficulty rating by year 1996-2008. 0%
10% 20% 30% 40% 50% 60% 70% 80% 90% 100%
1996 1998 2000 2002 2004 2006 2008
Year
Linear Regression Model Summary
Model R R Square Adjusted R Square
Std. Error of the Estimate
1 .133a 0.018 0 1.065
a. Predictors: (Constant), Dummy variable for 2008, Dummy variable for 2004, Dummy variable for 2006, Dummy Variable for 1998, Dummy variable for 2000, Dummy variable for 2002
Coefficientsa Model Unstandardized Coefficients Standardized Coefficients
t Sig. B Std. Error Beta
1 (Constant) 2.86 0.151 18.994 0
Dummy Variable for 1998 0.099 0.214 0.033 0.463 0.643 Dummy variable for 2000 0.14 0.214 0.046 0.654 0.513 Dummy variable for 2002 -0.044 0.214 -0.014 -0.204 0.838 Dummy variable for 2004 0.208 0.22 0.066 0.946 0.345 Dummy variable for 2006 -0.179 0.216 -0.058 -0.828 0.408 Dummy variable for 2008 -0.193 0.215 -0.064 -0.899 0.37 a. Dependent Variable: Rating of difficulty
Table D2. Regression analysis of the relationship of time on difficulty. Linear Regression Model Summary
Model R R Square Adjusted R Square Std. Error of the Estimate
1 .328a 0.107 0.091 42.883
a. Predictors: (Constant), Dummy variable for 2008, Dummy variable for 2004, Dummy variable for 2006, Dummy Variable for 1998, Dummy variable for 2000, Dummy variable for 2002
Coefficientsa Model Unstandardized Coefficients Standardized Coefficients
t Sig. B Std. Error Beta
1 (Constant) 73.5 6.07 12.116 0
Dummy Variable for 1998 5.3 8.62 0.04 0.62 0.54
Dummy variable for 2000 19.4 8.62 0.15 2.26 0.03
Dummy variable for 2002 8.8 8.62 0.07 1.02 0.31
Dummy variable for 2004 -11.0 8.86 -0.08 -1.24 0.21 Dummy variable for 2006 -21.1 8.71 -0.16 -2.42 0.02 Dummy variable for 2008 -23.0 8.67 -0.18 -2.65 0.01 a. Dependent Variable: Length of question (word count before removal of data)
Linear Regression Model Summary
Model R R Square Adjusted R Square Std. Error of the Estimate
1 .348a 0.121 0.103 1.009
a. Predictors: (Constant), Length of question, Dummy variable for 2004, Dummy Variable for 1998, Dummy variable for 2002, Dummy variable for 2006, Dummy variable for 2008, Dummy variable for 2000
Coefficientsa
Model
Unstandardized Coefficients
Standardized Coefficients
t Sig. B Std. Error Beta
1 (Constant) 2.27 0.17 13.22 0.000
Dummy Variable for 1998 0.06 0.20 0.02 0.28 0.781
Dummy variable for 2000 -0.02 0.20 -0.01 -0.08 0.935 Dummy variable for 2002 -0.11 0.20 -0.04 -0.56 0.573
Dummy variable for 2004 0.30 0.21 0.09 1.42 0.156
Dummy variable for 2006 -0.01 0.21 0.00 -0.04 0.966 Dummy variable for 2008 -0.01 0.21 0.00 -0.04 0.969
Length of question 0.01 0.00 0.34 6.22 0.000
a. Dependent Variable: Rating of difficulty