ABSTRACT
LING-KWEI TSENG. Optimization of the Uranine Wash-Off
Method for Measuring Aerosol Concentrations. (Under the
Direction of Dr. Russell W. Wiener)
In the fluorescence-washing technique, oleic acid
particles tagged with uranine are washed out and analyzed
fluorometrically. The possible sources of errors in the
technique are evaluated in this study. First, the
sensitivity of uranine fluorescence in different solutions
is compared. The results indicate that uranine in distilled
water with pH 10 buffer and in sodium hydroxide have high
readings. Second, the interference of oleic acid in uranine
solutions is investigated. The results indicate that there
is no interference of oleic acid in distilled water and
sodium hydroxide under our operating conditions. However,
there is a significant quenching effect of oleic acid in
ethanol. Third, the extraction ability of different
solutions from glass fiber and Teflon filters is tested.
The results indicate that distilled water and sodium
hydroxide have high extraction ability. Fourth, based on
the results above, distilled water is the best washing
solution for inlet washing. Fifth, two commercial samplers,
the Portable Indoor Particulate Samplers (PIPS) and
Saturation monitors, have been calibrated in the test
chamber. Sixth, some potential errors generated using this
fluorescence-washing technique in practice are discussed.
Seventh, a set of optimal operating conditions and a
Wiener, for his guidance and encouragement during this
study. I am grateful to thank my academic advisor.
Professor Richard M. Kamens, for his positive criticism and
support during the preparation of this report. In addition,
I wish to thank Dr. James E. Watson for serving on my
research committee.
I appreciate my friend, Fu-Lin Chen, for his
encouragement and technical assistance during this study. I
also thank Dr. Douglas W. VanOsdell for his technical
guidance.
I am especially grateful to my mother Yeo-Hsien Han and
my wife Ming-Hsun Lin for their patience and encouragement.
Finally I wish to thank the Air and Industrial Hygiene
Program in cooperation with the U.S. Environmental
Protection Agency, Grant No. CR81515202-0, which supported
this project and made possible my education at Environmental
11
TABLE OF CONTENTS
Page
I. INTRODUCTION 1
II. BACKGROUND AND LITERATURE REVIEW 5
II.A. Principles of Fluorescence 5
II.B. Uranine; Tracer 6
II.C. Fluorescence-Washing Technique 8
III. EXPERIMENTAL APPARATUS 12
III.A. Fluorometer 12
III.A.I. General Description 12
III.A.2. SLM Aminco Fluoro-Colorimeter II 13
III.A.3. Perkin-Elmer Fluorescence 13
Spectrophotometer
III.B. Aerosol Generator 14
III.B.l. General Description 14 III.B.2. Solute, Solvent, and Washing 16
Solution
III.B.2.a. Solute; Liquid 16
III.B.2.b. Solvent 17
III.B.2.C. Washing Solution 17
III.B.3. Calculation of Particle Diameter 18
III.e. Test Chamber 19
III.D. Samplers 20 III.D.l. Portable Indoor Particulate Sampler 20
III.D.2. Saturation Monitor 23
IV. METHODS AND PROCEDURES 27
IV.A.2.a. Uranine and Distilled Water 27
Solution
IV.A.2.a.i. PH Value Test 27
IV.A.2.a.ii. Determination 28
of Amount of Buffer in Uranine and Distilled Water Solution
IV.A.2.b. Calibration Procedure 28
IV.A.3. Sensitivity Comparison 29
IV.A.3.a. Sensitivity Test 29
IV.A.3.b. PH Value Test 30
IV.B. Interference Test 31
IV.B.l. Test Summary 31
IV.B.2. Oleic Acid in Solution Test 31
IV.B.3. Scanning Fluorometer Test 32
IV.C. Filter Extraction Test 33
IV.C.l. Test Svimmary 33
IV.C.2. Pure Filter Background Test 33
IV.C.3. Uranine Extraction Test 34
IV.C.4. Uranine and Oleic Acid Extraction 36
Test
IV.D. Portable Indoor Particulate Sampler and 36
Saturation Monitor Determination
- ---_.. IV
IV.D.B.a. SxMunary of Operation 39
IV.D.3.b. Portable Indoor Particulate 40 Sampler Standard Operating
Procedure
IV.D.3.C. Saturation Monitor Standard 41
Operating Procedure
IV.D.4. Particle Mass Recovery 42
IV.D.4.a. Test Sxuninary 42
IV.D.4.b. Normal Filter Extraction 42
and Interior Rinse Procedure
for Portable Indoor
Particulate Sampler
IV.D.4.C. Normal Filter Extraction 44
and Interior Rinse Procedure
-- - for Saturation Monitor
V. RESULTS, DISCUSSION, AND CONCLUSIONS 47
V.A. Sensitivity Test 47
V.A.I. Calibration Curve
V.A.I.a. Determination of Amount of 47
_. Buffer in Uranine and Distilled
Water Solution
V.A.l.b. Calibration Curves 50
V.A.2. Sensitivity Comparison 57
V.A.2.a. Sensitivity Test 57
V.A.2.b. PH Value Test 60
V.A.3. Conclusions of Sensitivity Test 60
V.B. Interference Test 62
V.B.I. Oleic Acid in Solution Test 62
V.B.I.a. Interference Test of Oleic 62
Acid in Distilled Water
V.B.2. Scanning Fluorometer Test 68
V.B.2.a. Fluorescence Intensity in 70
Different Solutions
V.B.2.b. Fluorescence Intensity in 70
Ethanol
V.B.3. Conclusions of Interference Test 72 V.C. Filter Extraction Test 73
V.C.I. Pure Filter Background Test 73
V.C.I.a. Pure Solvent Background 73
V.C.l.b. Glass Fiber Filter 73
V.C.I.e. Teflon Filter 73
V.C.2. Uranine Extraction Test 76 V.C.3. Uranine and Oleic Acid Extraction Test 82 V.C.4. Conclusion of Filter Extraction Test 90
V.D. Inference of Inlet Wash 91
V.E. Portable Indoor Particulate Sampler and 92
Saturation Monitor Determination
V.E.I. Results and Discussion 92 V.E.2. Conclusions 102 VI. SUMMARY AND RECOMMENDATIONS 104
VI.A. Summary and Optimal Washing Solutions 104
VLB. Recommendations 106
VI.C. Standard Operating Protocol 107
VI.C.l. Operating the SLM Aminco Fluoro- 107
Colorimeter IIVI
VI.c.3. Preparing the Calibration Curves 109
—VI.C.4. Filter Wash 110
Vl.C.4.a. Gelman Glass Fiber Filter 110
Wash
VI.C.4.b. Gelman Teflon Filter Wash 111 VI.C.4.C. Other Kinds of Filter Wash 112
VI.C.4.c.i. Background 112
Test
VI.C.4.c.ii. Filter Wash 112
Test
VI.C.5. Impaction Plate Wash 114
VI.C.6. Inlet Wash 115Vl.C.e.a. Inlet with Holes 115
Vl.C.e.b. Inlet without Holes 116
VI.C.7. Caution 118
Table Title Page
1. Fluorescence intensity vs amount of buffer 49
2. Fluorometer accuracy test 52
3. Comparison of sensitivity at high concentration 59
4. Comparison of sensitivity at low concentration 59
5. Interference test of oleic acid in distilled 63
water with buffer
6. Interference test of oleic acid in 0.001 N sodium 64
hydroxide
7. Interference test of oleic acid in 0.01 N sodium 66
hydroxide
8. Interference test of oleic acid in 0.1 N sodium 67
hydroxide
9. Interference test of oleic acid in ethanol 69
10. Scanning fluorometer test 71
11. Quenching test in oleic acid and ethanol solution 71
12. Pure solvent background 74
13. Background reading for glass fiber filters 75
14. Background reading for Teflon filters 77
15. Uranine on glass fiber filters extracted by 78
distilled water
16. Uranine on glass fiber filters extracted by O.OOl 79
Vlll
17. Uranine on glass fiber filters extracted by 0.01 80
N sodium hydroxide
18. Uranine on glass fiber filters extracted by ethanol 81
19. Uranine and oleic acid on glass fiber filters 83
extracted by distilled water
20. Uranine and oleic acid on glass fiber filters 84
extracted by 0.001 N sodium hydroxide
21. Uranine and oleic acid on glass fiber filters 85
extracted by 0.01 N sodium hydroxide
22. Uranine and oleic acid on glass fiber filters 86
extracted by ethanol
23.- An example of glass fiber filters extracted by 87
distilled water
24. An example of Teflon filters extracted by 89
distilled water
25. Collection efficiency of 10 nm PIPS 93
26. Collection efficiency of 2.5 nm PIPS 95
27. Calibration of the EMSI pumps and mass flow meters 97
Figure Title Page
1. EPA aerosol test facility 21
2. Overview of the chamber layout 22
3. Portable Indoor Particulate Sampler (PIPS) 24
4. Saturation Monitor 26
5. Ratio of buffer to distilled water vs pH value 48
6. Calibration curve of distilled water 51
7. Calibration curve of 0.001 N sodium hydroxide 54
8. Calibration curve of 0.01 N sodium hydroxide 55
9. Calibration curve of ethanol 56
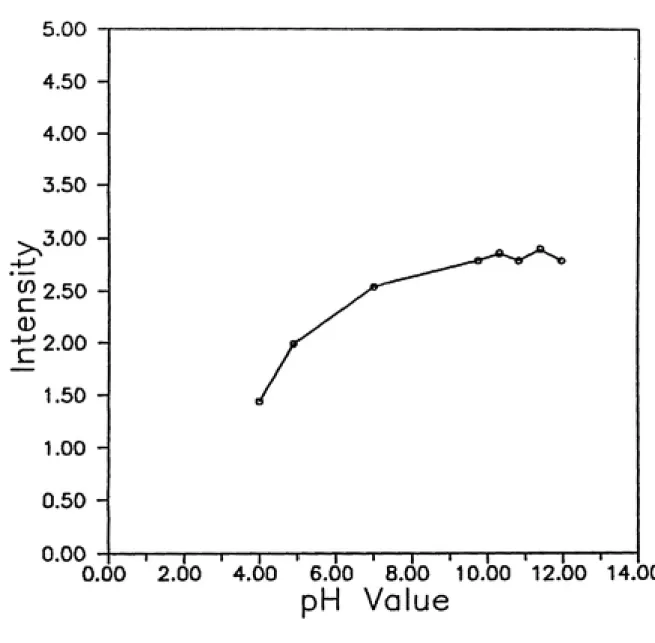
10. Comparison of calibration curves 58 11. Fluorescence intensity vs pH value 61 12. Collection efficiency of 10 /xm PIPS 94 13. Collection efficiency of 2.5 /nm PIPS 96
I. INTRODUCTIOM
Oleic acid particles, tagged with uranine produced from
a vibrating orifice monodisperse aerosol generator (VOMAG),
have been used as the basic aerosol standard for a long time
(Willeke 1975, Tufto and Willeke 1982, Liu et al. 1984,
Okazaki et al. 1987, Wiener 1987, Marple et al. 1987 and
1989, Wang and John 1988, VanOsdell et al. 1990, and
Martinez et al. 1990). This method provides aerosols of
high monodispersity and accurately known sizes. In this
procedure, particles deposit on the collecting surface;
then, they are washed out and analyzed fluorometrically.
This fluorescence-washing technique provides a simple,
rapid, inexpensive, and highly sensitive method to determine
aerosol quantity. However, no investigator has thoroughly
considered the sources of possible errors in the
fluorescence-washing technique in detail and established an
optimal operating procedure.
The purpose of this study is to evaluate the sources of
possible errors in the fluorescence-washing technique and
try to provide a set of optimal operating conditions which
could increase the sensitivity and lower the errors of this
factors are types of solutions and pH values. Distilled
water, sodium hydroxide, and ethanol are the most frequent
solutions used in fluorescence-washing technique, but the
sensitivity and linear response of uranine fluorescence in
these solutions were not checked in detail by any
investigators. Moreover, pH value in uranine solutions
plays an important role in the uranine fluorescence and
should be investigated. In the sensitivity test section,
the fluorescence intensity of uranine and linear
relationship in distilled water, sodium hydroxide, and
ethanol is compared. In addition the influence of pH value
in uranine solutions is described.
When uranine is washed out from collecting surfaces,
oleic acid also exists in the washing solutions. It is
necessary to know if the oleic acid will produce
interference in the uranine solutions. In the interference
test section, the possible interference of oleic acid in
uranine and distilled water, sodium hydroxide, and ethanol
solutions is tested by using both the filter fluorometer and
scanning fluorometer.
Filters are the most frequent surface used in
collecting uranine and oleic acid particles. There exist
two potential problems in filter wash. First, filters
3
solutions which will bias the actual reading of uranine
fluorescence. Second, these washing solutions probably
could not extract all the uranine on the filters when
uranine is covered by oleic acid. In the filter extraction
test section, the background of glass fiber filters and
Teflon filters in distilled water, sodium hydroxide, and
ethanol is compared. Moreover, the extraction ability of
distilled water, sodium hydroxide, and ethanol to oleic acid
tagged with uranine on glass fiber filters and Teflon
filters is compared.
Like filter wash, there exist two similar potential
problems in the inlet wash. First, inlets could be made of
any materials, and they may react with washing solutions
which will produce high background reading. Second, these
washing solutions may not extract all the uranine on the
inlets when uranine is covered by oleic acid. In the inlet
wash inference section, the best washing solution for inlet
wash is proposed based on the results in the sensitivity
test, interference test, and filter extraction test
sections.
In the Portable Indoor Particulate Sampler (PIPS, MSP
Corp., Minneapolis, MN) and Saturation Monitor (Pro-2, Lane
Regional Air Pollution Authority, Springfield, OR) section,
Monitors. Particle sizes are calculated from VOMAG
equations. The collected particles are washed out by distilled water and analyzed in the fluorometer. Hence,
collection efficiency curves of the PIPS and the Saturation
Monitors are obtained. Some potential problems are
discussed when we apply the fluorescence-washing technique
to calibrate a real sampler.
The federal regulation (Federal Reference Method, 40
CFR, Part 53, 1987) requires VOMAG and fluorescence-washing
technique to be used for PM 10 analysis in wind tunnel
tests. In the final section, a set of optimal operating
II. BACKGRODKD AND LITERATURE REVIEW
II.A. Principles of Fluorescence
When a molecule absorbs radiation, its energy level is
increased. If part of this energy is converted to
vibrational energy, the remainder, if radiated within 10'*
seconds, is emitted as light of lower energy (longer
wavelength) than the absorbed energy. This property is
called fluorescence. The shape of the excitation spectrum
is that of the absorbance curve of the molecule. If the
exciting light used is of a wavelength which is different
from that of the absorption peak, a smaller portion of the
light will be absorbed and proportionately less light will
be emitted. However, the shape and location of the emission
spectrum will not change. The fluorescence reading of a
fluorometer is proportional to the concentration of the
fluorescing molecule and the intensity of the exciting
wavelength (Sequoia-Turner Corp., 755 Ravendale Drive,
Mountain View, CA 94043).
Interference is a phenomenon where the real
fluorescence intensity is increased or decreased by a
quenching, collisional quenching and static quenching.
Collisional quenching involves a diffusion controlled
interaction between an excited molecule and some quencher.
Static quenching results from a complex formation between a
potentially fluorescent molecule in the ground state and a
quencher (Perkin-Elmer Corp., 1979).
Fluorescence is measured by fluorometers. Generally
there are two types of fluorometers, filter fluorometers and
spectrofluorometers. The major advantage of the filter
fluorometer is that it permits a greater quantity of light
to strike the sample which is desirable for trace analysis.
The lack of selectivity of filters, in so far as obtaining a
narrow wavelength is concerned, is their major disadvantage.
On the contrary, a fluorescence intensity can be obtained at
a specific excitation and an emission wavelength in a
spectrofluorometer.
II.B. Uranine? Tracer
A tracer used in aerosol experiments should meet the
requirements including low cost, nontoxicity, rapid
analysis, and high sensitivity. Uranine meets all the
7
using uranine dye. Since uranine is essentially insoluble
in liquid particles, it exists within liquid particles as a
precipitate (Liu and Agarwal 1974).Uranine (Fluorescein Sodium) has molecular formula
CjoH^oNajOj and molecular weight 376.27. It is a hydroscopic
orange-red powder and freely soluble in water (Windholz,
1983). Uranine and water solutions form a deep-red color at
a concentration of 10 percent changing to yellow-green in
more dilute concentrations. Uranine and water solutionsabsorb blue light between the wavelengths of 440 and 520 nm
and emit a brilliant yellow fluorescence between 510 and 590
nm (Robinson et al., 1959). Schulz et al. (1960) used a
Photovolt Meter (Model 52OM) to get a linear response
between 0.1 nq/ml and 0.01 /ng/ml and nonlinear response
below 0.01 Mg/rol in uranine and water solution. Burgess et
al. (1961) used the same instrument with proper selection of
light source and filters and detected concentration down to
0.0001 Mg/ml in uranine and water solution. He was able to
extend the linear relationship between 0.001 /ng/ml and 2
/xg/ml. Drabent et al. (1964) and Pant (1968) concluded that
uranine aqueous solutions under 10 /xg/ml have both the
maximum intensity of absorption and emission when pH value
is above 10 because only bivalent negative ions exist.
However, the fluorescence is dependent on pH value when pH
value is less than 10. The maximum excitation and emission
Since Berglund and Liu devised the vibrating orifice
monodisperse aerosol generator (VOMAG) in 1973, a lot of
different liquid particle solutions and washing solutions
have been used to measure aerosol concentration by
fluorometry. Liu and Agarwal (1974) observed aerosol
deposition in turbulent flow by using olive oil liquid
particles tagged with uranine. The solution of liquid
particles is composed of olive oil, uranine, isopropanol,
and distilled water. The particles are deposited on filters
and glass pipes and then are washed out by distilled water.
Turner and Hill (1975) used diotylphthalate (DOP) liquid
tagged with uranine to calibrate an Anderson two-stage
biological sampler. The solution of liquid particles is
composed of DOP, uranine, and ethanol. The particles
deposited on the glass fiber and aluminum foil and are
washed out by ethanol. Three drops of 0.1 N sodium
hydroxide were added to each cuvette containing washing
solutions to adjust the pH and enhance fluorescence.
Willeke (1975) found the characteristic of the slotted
impactor by using oleic acid tagged with uranine. The
solution used to generate liquid particles is composed of
oleic acid, uranine, and isopropanol. The particles are
collected on the surface of glass fiber filter and aluminum
9
level of the washing solutions was stabilized at about 10.5
by adding three drops of buffer to each sample. These three
papers presented above are the first publications which
described the fluorescence-washing technique in detail.
Liu and Pui (1981) tested a new inlet by using DOP
particles tagged with fluorescein, but Liu et al. (1984)
assessed power air purifying respirators by using oleic acid
particles tagged with uranine. The washing solutions which
they used were 0.01 N sodium hydroxide. Tufto and Willeke
(1982), Okazaki et al. (1987), Okazaki et al. (1987), and
Wiener (1987) still used the same technique developed by
Willeke (1975). They used distilled water to wash the
deposited uranine out of the interior of inlets and added pH
10 Buffer to get the transmission efficiency. Chen et al.
(1985 and 1988) used DOP liquid particles tagged with
uranine to calibrate a virtual impactor and to test an
aerosol generator connecting two virtual impactors in
series. They selected pure isopropanol as washing solvent.
In calibrating an impactor, Marple et al. (1987) also used
the same technique developed by Willeke (1975), but Marple
et al. used 0.001 N sodium hydroxide instead of distilled
water as washing solvent. Wang and John (1988) calibrated
the Berner impactor by using oleic acid particles tagged
with uranine. They used 50% distilled water and 50%
isopropanol as washing solution to extract uranine
VanOsdell et al. (1990) calibrated Personal Environmental
Monitors (PEM) and Microenvironmental Exposure Monitors
(MEM) by using oleic acid particles tagged with uranine.
The particle solution is composed of oleic acid, uranine,
and ethanol. They used 0.01 N sodium hydroxide to wash
uranine deposited on filters, impaction plates, and bodies
of 10 nia MEM, 10 nm PEM, and 2.5 /xm PEM, but pure ethanol to
extract uranine deposited on 2.5 nm MEM to prevent high
background readings. An SLM Aminco Fluoro-colorimeter II
(SLM Instruments Inc., Urbana, IL) was used in their
experiments. Martinez et al. (1990) also used the same
technique developed by Willeke (1975) to evaluate some
biological samplers, including Andersen single-stage and
two-stage cascade impactors, surface air sampler (SAS), and
biotest reuter centrifugal. A Perkin-Elmer
Spectrofluorometer (Model 650-40, Perkin-Elmer Corp.,
Nowalk, CT) was used in their experiments.
The federal regulation (Federal Reference Method, 40
CFR, Part 53, 1987) requires VOMAG and fluorescence-washing
technique to be used for PM 10 analysis in wind tunnel
tests. Monodisperse liquid particles of oleic acid tagged
with uranine should be used.
Based on all these studies it is clear that a complete
11
III. EZPERIMEMTAL APPARATUS
III.A. Fluorometer
III.A.l. General Description
There are two types of fluorometers, filter
fluorometers and spectrofluorometers. Filter fluorometers,
such as the Aminco Fluoro-Colorimeter and Turner Filter
Fluorometer, use a primary filter to select the desired
excitation wavelength from the lamp source and a secondary
filter that passes the sample fluorescence, but not the
excitation wavelength, to the detector. A spectrofluorometer
uses an excitation monochromator and an emission
monochromator instead of a primary filter and a secondary
filter. Both a filter fluorometer and a spectrofluorometer
are designed with the detector perpendicular to the lamp
beam. This configuration allows the analyst to adjust the
background reading (blank) to zero.
The lamp source is usually a mercury or a xenon arc.
The sample solution is exposed in a cell made of glass or
13
detector is displayed on the filter fluorometer by a meter.
Spectrofluorometers use recorders.
III.A.2. SLM Aminco Pluoro-colorimeter II
The borosilicate cuvettes (Disposable Culture Tubes,
Cat. No. 60825-538, VWR Scientific Inc., San Francisco, CA)
are placed in a SLM Aminco Fluoro-colorimeter II (SLM
Instruments Inc., Urbana, IL). This fluorometer is used for
all experiments performed. The fluorometer operates by
passing an ultra violet light through the primary filter.
The UG-1 primary filter (bandpass) passes maximum excitation
ait^ 360 nm, but passes less than 1% transmission at 300 nm
and from 420 to 670 nm. The KV 418 secondary filter (sharp
cutoff) transmits light over 405 nm and has 50% transmission
at 418 nm. Uranine is activated between 425 and 525 nm andemits between 475 and 650 nm. A photodetector can be used
between 300 and 650 nm. The photomultiplier is set at 550 V
and the fluorometer should be allowed to wairm up for atleast 30 minutes before use.
III.A.3. Perkin-Elmer Spectrofluorometer
A scanning spectrofluorometer (Model 650-40,
Perkin-Elmer Corp., Norwalk, CT) has been used to measure the
the light source. Both the excitation and emission
monochromators can pass the light in the range of 220 to 830
nm. The detector is a R928 photomultiplier detector used
form 220 to 830 nm wavelength. The scanning
spectrofluorometer has a pre-scan function with a speed of
960 nm/min. The spectrofluorometer should be allowed to
warm up for at least 30 minutes before use.
III.B. Aerosol Generator
III.B.l. General Description
In Section IV.D, two commercial samplers, Portable
Indoor Particulate Samplers (PIPS) and Saturation Monitors,
are calibrated in the test chamber. Aerosol particles are
generated using a vibrating orifice monodisperse aerosol
generator (VOMAG, Model 3050, TSI Inc., St. Paul, MN). A
solvent of high volatility containing a solute of low
volatility is injected by a pressurized liquid feed into a
tested air stream. A vibrating piezoelectric ceramic ring
imparts a distorting frequency that helps cause the solution
to shear into small equally sized droplets. The
piezoelectric crystal is oscillated by a sine wave generated
15
precision, Chicago, IL) and is measured by a frequency
counter (Model SM-2410, Heath Zenith Inc.,).
The solvent in the droplets evaporates so that a
smaller liquid or solid (depending upon the solute being
used) particle remains. This study uses ethanol (AAPER
Alcohol and Chemical Co., Shelbyville, KY) as the solvent
and oleic acid (Cat. No. A 195, Fisher Scientific Co., Fair
Lawn, NJ) tagged with uranine (Sodium Fluorescein, Cat. No.
A-833, Fisher Scientific Co., Pittsburgh, PA) for the
solute. The resultant oleic acid and uranine particle is an
oily liquid droplet.
Both dispersion and dilution air are adjusted by the
metering valves and rotameters. The rotameter (Model RMB,
Dwyer Instruments, Inc., Michigan City, IN) for dispersion
air has a range of 0 to 2500 ml/min. The rotameter (Model
RMB, Dwyer Instruments, Inc., Michigan City, IN) for
dilution air has a range of 0 to 6 MVhr. Typical flow
rates are 1500 ml/min for dispersion air and 6 MVhr for
dilution air.
A high performance liquid chromatography (HPLC)
programmable pump (Waters Model 590, Millipore Corporation,
Milford, MA) replaced the syringe pump in the original
generator system. This pump gives higher pressure delivery,
maintains a constant flow, and permits operation for
Milford, MA) between the HPLC pump and the orifice assembly
to prevent clogging during operation.The VOMAG rests on top of a charge neutralizer (Model
3077, TSI Inc., St. Paul, MN). Droplets from the VOMAG are
then sent down through a particle charge neutralizer and
dispersed into the air. The neutralizer consists of an
aluminum cylinder, 10.2 cm in diameter and 30.5 cm in
length, enclosing a Kr®^ radioactive gas with a strength of
10 mCi. The neutralizer, by removing the electrostatic
charges on the droplets, helps prevent agglomeration of the
aerosol and also inhibits electrical precipitation.
III.B.2 Solute, Solvent, and Washing Solution
III.B.2.a. Solute; Liquid
A solute could be a liquid or a solid. Liquid
particles are commonly used above 1 nn because they do not
bounce, and they are highly monodisperse, unifomn, and
spherical. A suitable liquid used for producing particles
should have low volatility, nontoxicity, low cost, and no
fluorescent or interference effect. Oleic acid and
diotylphthalate (DOP) have been the primary liquids used to
Acreate particles for a long time. Oleic acid is the only
liquid used in our study. It has molecular formula C^gHj^Oj
17
nearly colorless liquid and practically insoluble in water,
but soluble in alcohol. Oleic acid has a boiling point at
286*"C (WindholZ, 1983).
III.B.2.b. Solvent
A solvent used in VOMAG should have high volatility,
low cost, and nontoxicity. The most important thing is that
both liquid and tracer must be soluble in the solvent.
Hence, ethanol and isopropanol are two primary choices.
Ethanol is the only solvent in our study.
III.B.2.C. Washing Solution
Washing solutions play a very important role in the
fluorescence-washing technique. They must have high
extraction ability to wash uranine and liquid particles out
of the collecting surface, but should not react with the
surface to cause high background reading. Uranine in
washing solutions should be stable and give a highly
sensitive reading. Distilled water, sodium hydroxide,
ethanol, and isopropanol are the most common washing
III.B.3. Calculation of Particle Diameter
If the liquid feed rate, the disturbance frequency of VOMAG, and the ratio of uranine, oleic acid, and ethanol are
specified, the resulting particle size can be calculated. The droplet diameter before vaporizing is:
where D^^ is the droplet diameter before vaporizing in /xm, Q
is the liquid feed rate in ml/sec, and f is the disturbance
frequency (Hz). However, uranine exists in the droplet as
an impurity, so that the corrected diameter after vaporizing
is:
Dp,corrected=(C+I)1/'Dd
where D corrected ^® ^^® corrected diameter in /xm, C is the
volumetric concentration of oleic acid in the oleic acid and
ethanol solution^ and I is the volumetric concentration of
uranine in ethanol. Hence, the aerodynamic diameter of the
resulting uranine and oleic acid particle can be calculated
19
a * avg' p.corrected
where D^ is the aercKjynamlc diameter in /xm, and e is the
average density of uranine and oleic acid in solution in
g/ml. Similarly, the optimal disturbance frequency can be
calculated by reversing the calculation steps above if the
desired aerodynamic diameter is specified.
III.C. Test Chamber
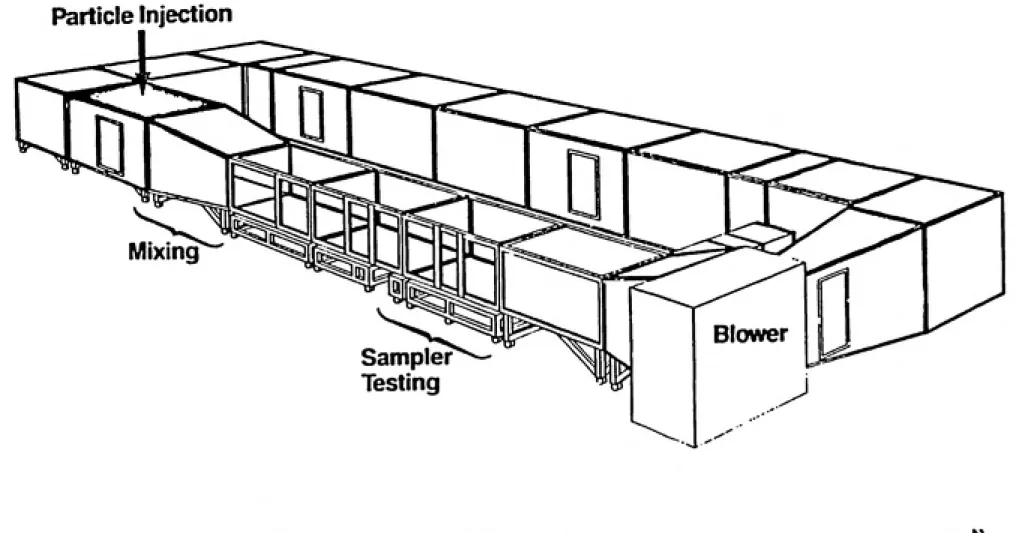
A cubical test chamber measuring 183 cm on each side was erected within the EPA Aerosol Test Facility wind tunnel. The walls of the wind tunnel formed the top, bottom, and two sides of the chamber. The section of the
wind tunnel chosen included an entry door that was used to
access the interior of the chamber. Temporary framing was
used to form the other two sides of the chamber. In order
to prevent any significant pressure difference between the
chamber and its surroundings, a 61-cm square HEPA filter was
installed in one wall to permit clean air exchange as
required by the samplers. All seams were taped to prevent
air entry except through the filter.
The test aerosol entered from the center of the chamber
top. A 40 cm diameter fan was positioned 1.5 m directly
below the aerosol entry point to provide mixing in the
the chamber floor at various points on a rough circle about
12 0 cm in diameter around the fan. Figure 1 and 2 give the
overviews of the wind tunnel and the chamber layout.
III.D. Samplers
III.D.l. Portable Indoor Particulate Sampler (PIPS)
The particulate sampling system consists of three major
assemblies, each contained in its own compartment: 1) the
PIPS which contained an active size removal system in
addition to the particle filter; 2) the Environmental
Monitoring Services Incorporation (EMSI, Esotemic Systems
Inc., Newbury Park, CA) sampling pump and integral motor; 3)
the electronics for controlling the pump flow-rate and
measuring elapsed time of pump operation.
The PIPS consists of three sections, each of which is
made of aluminum and anodized: 1) an inlet-nozzle section,
2) an impactor plate, and 3) an exit section.
The aerosol-laden sample airstream enters through four
holes and passes through each of ten nozzles located on the
inlet section's upstream surface. The inlet section is
Particle injection
B
Blower
Mixing
Sampler
Testing
Figure 1. EPA Aerosol Test Facility
ISO 4
ISO 3 0
FAN
A Saturation
ZAMonitor 2
•
PIPS1
PIPS 2
Saturation
Monitor 1 ^
A
(JlSOl
ISO 2
DOOR
23
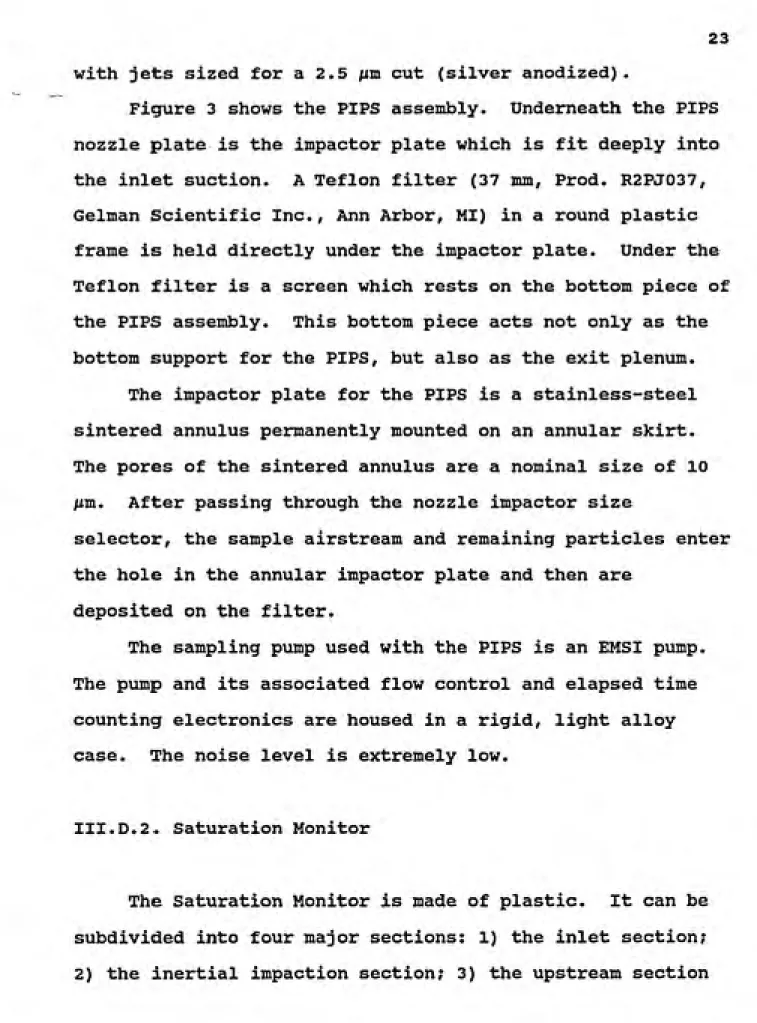
with jets sized for a 2.5 /nm cut (silver anodized) .
Figure 3 shows the PIPS assembly. Underneath the PIPS
nozzle plate is the impactor plate which is fit deeply into
the inlet suction. A Teflon filter (37 mm, Prod. R2PJ037,
Gelman Scientific Inc., Ann Arbor, MI) in a round plastic
frame is held directly under the impactor plate. Under the
Teflon filter is a screen which rests on the bottom piece of
the PIPS assembly. This bottom piece acts not only as the
bottom support for the PIPS, but also as the exit plenum.
The impactor plate for the PIPS is a stainless-steel
sintered annulus permanently mounted on an annular skirt.
The pores of the sintered annulus are a nominal size of 10
/im. After passing through the nozzle impactor size
selector, the sample airstream and remaining particles enter
the hole in the annular impactor plate and then are
deposited on the filter.
The sampling pump used with the PIPS is an EMSI pump.
The pump and its associated flow control and elapsed time
counting electronics are housed in a rigid, light alloy
case. The noise level is extremely low.
III.D.2. Saturation Monitor
Impactor
o
Cap
Filter
Frame
Filter
Filter
Frame
Support
Base
p;)^^-sr-^-' -^>--.'
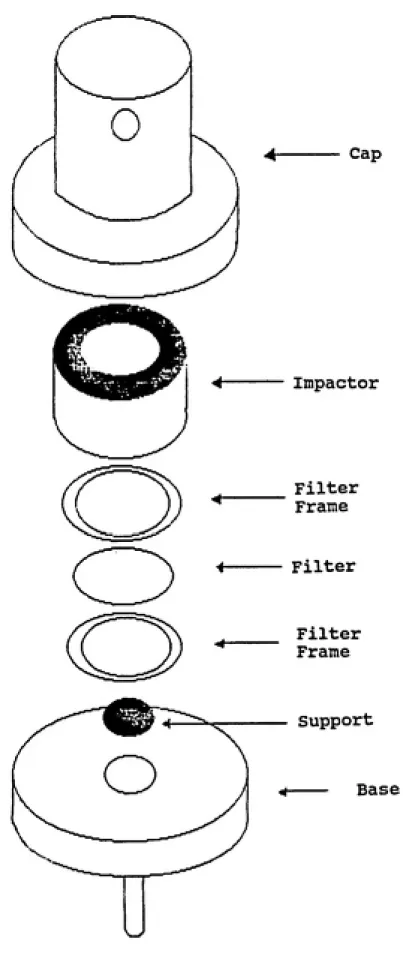
25 of the filter holder; and 4) the downstream section of the
filter holder. Figure 4 shows the Saturation Monitor
assembly.
-The pump draws air through the inlet and then through
the impactor. The inertial impactor section consists of two
major components, a nozzle and an impaction plate. Inside
the impactor, air is accelerated through a converging inlet
and cylindrical throat. The sample airstream next
encounters the impaction plate, a plastic disk with annular
tracks. This plate is held by three slender cylinders. The
space between the cylinders allows the sample airstream
passage around the plate.
After passing through the impactor section, the sample
airstream enters the upstream section of the filter holder.
In addition to providing the upstream filter support, this
section allows the airstream to redevelop fully after the
flow disturbance caused by the impactor section and to
deposit uniformly its particles on the filter.
A glass fiber filter (47mm, Type A/E, Gelman Scientific
Inc., Ann Arbor, MI) is used as the particle collection
medium. The downstream side of the filter is supported by a
drain disk. An anti-twist ring is put over the filter to
Support Grid
Size
Separation Impactor
Assembly Ring
Gasket
Impactor Section
1
Adapter Body
Gasket
Anti-Twist
Ring
Filter
Drain Disk
0-Ring
Base
J
Filter
ͨ
• Assembly
Figure 4. Saturation Monitor (From "Quality
Assurance Project Plan for Portable PM-10 Sampling." (Unpublished), EPA Region 10, 1200 6th Ave., Seattle,
27
IV. METHODS AMD PROCEDURES
IV.A. Sensitivity Test
IV.A.1. Test Summary
In the Calibration Curve Section, first the optimal
amount of buffer in uranine and distilled water solution is
determined. Then, the calibration curves of uranine in different solutions are obtained. In the Sensitivity
Comparison Section, the same amount of uranine and distilled
water solution is delivered into several different pH
solutions and the sensitivity is compared. The following
are lists of the step by step procedures used in performing
these experiments.
IV.A.2. Calibration Curve
IV.A.2.a. Uranine and Distilled Water Solution
IV.A.2.a. i. PH Value Test ^...__
buffer (Cat. No. SB116-1, Fisher Scientific Co.,
Pittsburgh, PA) into each 100 ml distilled water. Shake
for 10 minutes.
(3) Analyze using pH meter (pH/Temp Meter, Model-6719, Jenco
Electron, Co. LTD).
IV.A.2.a.ii. Determination of Amount of Buffer in Uranine
and Distilled Water Solution
(1) Prepare 2, 1, 0.5, 0.2, 0.1, 0.05, 0.02, 0.01, and 0.005 /xg/ml uranine and distilled water solutions.
(2) Pipet 3.3 ml each concentration solution into 6
different small cuvettes.
(3) Add 40, 50, 60, 75, and 100 /ul pH 10 Buffer into five
cuvettes separately. Leave one cuvette as blank. Keep
these cuvettes in the dark for 15 minutes.
(4) Analyze all samples fluorometrically using the SLM
Aminco Fluoro-Colorimeter II.
IV.A.2.b. Calibration Procedure
(1) Prepare uranine and distilled water stock solution 100
/ig/ml. Dilute it to 10 /Ltg/ml.
29
Dilute 10 Mg/ml to 1, 0.2, 0.05, 0.01 ^g/ml. Every new solution is shaken for 5 minutes and then put into the ultrasonic bath (Ultrasonic cleaner. Model B-52, Branson
Co., Shelton, CT) for 5 minutes.
(3) Pipet 3.3 ml solutions into small cuvettes.
(4) Add 50 ^1 pH 10 buffer into each cuvette separately.
Leave these cuvettes in the dark for 15 minutes.
(5) Analyze all samples fluorometrically using the SLM
Aminco Fluoro-Colorimeter II.
(6) Repeat steps (1), (2), (3) and (5) using 0.001 N and 0.01 N NaOH Solutions. Repeat steps (1) to (5) using ethanol.
IV.A.3. Sensitivity Comparison
IV.A.3.a. Sensitivity Test
(1) Prepare uranine and distilled water stock solutions 100
|ig/ml and 10 fig/jal.
(2) Prepare distilled water, 0.001 N NaOH, 0.01 N NaOH, 0.1 N NaOH, and ethanol solvents 100 ml in 5 different
flasks.
(3) Deliver 1 ml of uranine and distilled water 100 /xg/ml
into 5 different solutions. Shake for 5 minutes. The
distilled water. Leave these cuvettes in the dark for
15 minutes.
(6) Analyze all samples fluorometrically using the SLM
Aminco Fluoro-Colorimeter II.
(7) Repeat step (2).
(8) Deliver 0.1 ml of uranine and distilled water 10 /ng/ml
into distilled water, 0.001 N NaOH, 0.01 N NaOH, and O.l
N NaOH solutions. Shake for 5 minutes. The real
concentration in each flask is 0.01 /xg/ml.
(9) Repeat steps (4) to (6).
IV.A.3.b. PH Value Test
(1) Prepare 7 different pH value sodium hydroxide solutions
between concentration 0.001 N and 0.1 N.
(2) Prepare these 7 different pH NaOH solutions of 100 ml
each in 7 different flasks.
(3) Prepare uranine and distilled water stock solution 100
/ig/ml.
(4) Deliver 1 ml of uranine and distilled water 100 /xg/ml into 7 different pH solutions. Shake for 5 minutes.
The real concentration in each flask is 0.99 ^g/ml.
(5) Pipet 3.3 ml solutions into small cuvettes. Each
31
(6) Analyze all samples fluorometrically using the SLM
Aminco Fluoro-Colorimeter II.
IV.B. Interference Test
IV.B.l. Test Summary
The interference of oleic acid in different uranine
solutions is tested. In the Oleic Acid in Solution Test
Section, a specified amount of oleic acid is added into
different uranine solutions. Then, these solutions are
analyzed with the SLM Aminco Fluoro-Colorimeter. In the
Scanning Fluorometer Test Section, various uranine solutions
are analyzed with the Perkin-Elmer Spectrofluorometer,
specifically uranine, oleic acid, and ethanol solution.
IV.B.2. Oleic Acid in Solution Test
(1) Prepare an adequate amount of uranine and distilled
water solutions for a concentration of 1 /xg/ml and a
concentration of 0.01 /xg/ml.
(2) Deliver 10 nl oleic acid into 500 ml of 1 /xg/iiii uranine
and distilled water. Shake 2 minutes, put in the ultrasonic bath for 10 minutes, and shake 2 minutes
again.
(4) Add 50 /il pH 10 buffer in cuvettes. Leave these
cuvettes in the dark for 15 minutes.
(5) Analyze cuvettes fluorometrically using the SLM Aminco
Fluoro-Colorimeter II.
(6) Repeat steps (2) to (5) using 0.01 fig/ml solution.
(7) Repeat steps (1) to (3) and (5) using uranine and 0.001
N NaOH, uranine and 0.01 N NaOH, uranine and 0.1 N NaOH,
and uranine and ethanol solution.
IV.B.3. Scanning Fluorometer Test
(1) Prepare 100 ml uranine and distilled water solution with
100 Mg/ml.
(2) Prepare 100 ml of the five following solvents
separately: distilled water, 0.001 N NaOH, 0.01 N NaOH,
0.1 N NaOH, and ethanol.
(3) Pipet 1 ml of 100 /xg/ml uranine and distilled water into
each solvent. The concentration is 0.99 /ig/ml. Shake
10 minutes.
(4) Pipet 3.3 ml solution into small cuvettes. Add 50 /xl pH
10 buffer into cuvettes with distilled water and with
ethanol. Leave these cuvettes in the dark for 15
minutes.
Perkin-33
Elmer Spectrofluorometer.
(6) Pipet 3.3 ml of the tested oleic acid, uranine, and
ethanol solution in step (7) in IV.B.2. into small
cuvettes. Add 50 /il pH 10 buffer and 0.1 N NaOH into
cuvettes separately. Leave these cuvettes in the dark
for 15 minutes.
(7) Analyze these cuvettes fluorometrically using the
Perkin-Elmer Spectrofluorometer.
IV.C. Filter Extraction Test
IV.C.l. Test Summary
The purpose of the filter extraction test is to
evaluate the background of different filters in various
solutions and the extraction ability of these solutions. In
the Pure Filter Background Test Section, the background of
glass fiber filters and Teflon filters in different
solutions is obtained. In the Uranine Extraction Test
Section, a certain amount of uranine is delivered on filters and washed out by different solutions. In the Uranine and
Oleic Acid Extraction Test Section, a certain amount of
uranine and oleic acid is delivered on filters and washed
out by different solutions.
(2) Pour 20 ml of the five following solvents separately
into three jars: distilled water, 0.001 N NaOH, 0.01 N
NaOH, 0.1 N NaOH, and
ethanol-(3) Put these 15 jars in the ultrasonic bath for one hour. (4) Take these 15 jars out of the ultrasonic bath. Pipet
about 3.3 ml solution from each jar into each cuvette separately. Centrifuge (2600 RPM) these cuvettes for 10 minutes in a centrifuge (Model TJ-6, Beckman Instruments
Inc., Palo Alto, CA).
(5) Analyze those cuvettes containing sodium hydroxide
solutions using the SLM Aminco Fluoro-Colorimeter II. (6) Add 50 Hi pH 10 buffer solution into those cuvettes
containing distilled water and containing ethanol.
Leave these cuvettes in the dark for 20 minutes and
analyze them using the SLM Aminco Fluoro-Colorimeter II.
(7) Repeat steps (1) to (6) using Teflon Filters (37mm,
Prod. R2PJ037, Gelman Scientific Inc., Ann Arbor, MI).
IV.C.3. Uranine Extraction Test
(1) Prepare uranine and ethanol stock solution with 40
/ig/ml.
(2) Put 12 Gelman glass fiber filters (47mm) on the edges of
35 (3) Deliver 0.5 ml stock solution to each filter. Let the
filters dry for 30 minutes.
(4) Put these 12 filters into twelve 2 oz jars.
(5) Pour 20 ml of the four following solvents separately
into three jars containing filters: distilled water,
0.001 N NaOH, 0.01 N NaOH, and ethanol.
(6) Pour 20 ml of the four following solvents separately
into four jars: distilled water, 0.001 N NaoH, 0.01 N
NaOH, and ethanol. Directly add 0.5 ml stock solution
into these four jars. These four jars are used as
blanks.
(7) Shake these samples gently for 15 minutes.
(8) Pipet about 3.3 ml of solution from each jar into each
cuvette. Centrifuge these cuvettes for 10 minutes.
(9) Analyze those cuvettes containing sodium hydroxide
solutions using the SLM Aminco Fluoro-Colorimeter II. (10) Add 50 ^1 pH 10 buffer into those cuvettes containing
distilled water and containing ethanol. Leave these
cuvettes in the dark for 20 minutes and analyze them
using the SLM Aminco Fluoro-Colorimeter II.
(11) Take these filters out and put them into twelve new
jars containing 20 ml of distilled water, 0.001 N NaOH,
0,01 N NaOH, and ethanol separately. Put these jars in
the ultrasonic bath for 30 minutes.
(12) Repeat steps (8) to (10).
(14) Repeat steps (8) to (10).
IV.C.4. Uranine And Oleic Acid Extraction Test
(1) Prepare uranine, oleic acid, and ethanol stock solution with 40 Mg/ml. The ratio of uranine and oleic acid is
0.05 g uranine to 1 ml oleic acid.
(2) Repeat steps (2) to (14) in IV.C.3.
IV.D. Portable Indoor Particulate Sampler (PIPS) and
Saturation Monitor Determination
IV.D.l. Test Summary
This test is designed to verify the 2.5 and 10 /im cut-point Portable Indoor Particulate Sampler (PIPS) and to determine the Saturation Monitor, which was designed to provide a 10 |xm cut point. The collection efficiency of
PIPS was previously determined by Marple (1989). The 2.5 fMm samplers were tested with monodisperse test particles
between 1.5 and 3.5 fim, and the 10 /xm samplers with particles between 6 and 25 /xro aerodynamic diameter.
37
filter collected within the sampler divided by the total
mass of particulate material that enters the sampler.
Fractional mass penetration to the filter is therefore one minus the collection efficiency. The total mass entering the sampler is taken to be the mass on the filter plus the mass that collected on the interior surfaces of the sampler and the impaction disk. Thus, only particle behavior inside
the samplers is evaluated during this test.
In overview, the test consisted of the following:
1. Generation of a monodisperse test aerosol in a
chamber.
2. Operation of the samplers within that chamber long
enough to obtain a suitable particle sample.
3. Analysis of the mass collected on the filter.
4. Analysis of the particulate mass collected within
the sampler not on the filter by washing down the
interior walls and the impaction stage.
5. Calculation of impactor efficiency as mass collected not on the filter divided by the total mass entering
the sampler.
IV.D.2. Test Aerosol
The sampler collection efficiency for aerosols with
vibrating orifice monodisperse aerosol generator (VOMAG), and are composed of oleic acid tagged with uranine. As is required to make particles with a VOMAG, the feed solution is composed of a dilute solution of oleic acid and uranine in ethanol. After the primary particle is generated by the VOMAG, the ethanol evaporates and the desired test particle
remains.
For particles less than 5 fMia in diameter, a 10 fxia
orifice is used in the VOMAG. The feed rate is 0.1 ml/min
at a VOMAG frequency of about 200 KHz. At 5 jum and above, a
20 Mm orifice is used in the VOMAG at a frequency near 70
KHz and a feed rate of 0.165 ml/min.
According to the federal regulation (Federal Reference Method, 40 CFR, Part 53, 1987), multiplets (doublets and triplets) in a test particle atmosphere shall not exceed 10 percent. For particle sizes above 5 nm, the particle size uniformity and number of doublets and triplets are checked using an optical microscope (Model Labophot-Pol, Nikon Inc., Garden City, NY). These particles are collected on slides
and the slide is examined. For particle sizes less than 5 /Ltm, the particle size uniformity and number of doublets and triplets are checked by an aerodynamic particle sizer (APS,
39
IV.D.3. Sampler Operation
IV.D.3.a. Summary of Operation
All samplers are not tested with all particle sizes.
The 2.5 /im cut-point PIPS are tested with particles from 1.5
to 3.5 /im aerodynamic diameter, while the 10 |xm PIPS and
Saturation Monitor tested with the particles larger than 5
fim in aerodynamic diameter.
Tests of the 10 jum cut-point samplers at particle sizes
above 5 /xm include the following:
1. Four 47 mm open-face filter samplers,
2. Two 10 um PIPS operated with the EMSI pumps,
3. Two 10 fjm Saturation Monitors operated with the EMSI
pump.
The open-face filter samplers are used for checking
aerosol uniformity and concentration in the chamber. For
test particles smaller than 5 /xm, two 2.5 fim cut-point PIPS
replace two 10 ^m cut-point samplers and two Saturation
Monitors.
The procedures used to operate the PIPS and Saturation
Monitor and to extract the fluorescent aerosol from the
samplers are given in IV.D.3.b and c. The impactor stages
eliminate possible reaction between the washing solvent and
the sampler surface. Thus, the fluorescence background
problem is minimized.
IV.D.3.b. Portable Indoor Particulate Sampler (PIPS)
Standard Operating Procedure
(1) Refer to Figure 3 to see the components of the PIPS.
(2) Lay out all of the components except the filter on a
surface that is free of contamination.
(3) With the base of the sampler flat on the plastic plate
with holes, facing upward, use the forceps to place a
pad onto the center of the base. Be sure that it is
centered and flat.(4) Load the Teflon filters into the round frames. Squeeze
the top and bottom frame evenly until the two frames are
jointed. During these procedures, the filter is to be
touched only with clean tweezers.
(5) Place the round filter frame on top of the pad,
carefully adjusting the frame so that it overlaps the
pad and also fits onto the base securely. When it is
securely in place, the frame will not move.
41
not move either.
(7) Keeping the base of the sampler still flat on the table,
carefully attach the inlet to the base. Screw the inlet
and the base evenly. Be sure that the inlet rests
exactly on the base.
(8) Attach the PIPS to the EMSI pump line.
IV.D.3.C. Saturation Monitor Standard Operating Procedure
(1) Refer to Figure 4 to see the components of the
Saturation Monitor.
(2) Lay out all of the components except the filter on a
—"^surface that is free of contamination.
(3) Insert the impactor into the assembly ring.
(4) With the base of the sampler flat on the plastic plate
with holes, facing upward, use the forceps to place a
glass fiber filter onto the center of the base. Be sure
that it is centered.
(5) Place the anti-twist ring over the filter. Be sure that
the anti-twist ring is tied with the base.
(6) Screw the adapter body into the base. Be sure that the
anti-twist ring and the filter are in the proper
position.
(7) Screw the assembly ring into the adapter body.
CA) and the EMSI pump line. After the pump has operated
for at least 5 minutes, check the flow on the mass flow
meter. Adjust the flow if necessary.
IV.D.4. Particle Mass Recovery
IV.D.4.a. Test Summary
The particle mass collected in each sampler is
determined as the sum of the mass collected on the filter
and the mass collected elsewhere in the sampler. The mass collected elsewhere is measured by washing the inside of the
sampler, then determining the mass collected
fluorometrically. The filter mass is determined by
extracting the filter and using fluorometric analysis. The sampler penetration for a given particle size is determined
by dividing the mass on the filter by the total sampler
mass.
Detailed explanations of the procedures used to obtain the filter and sampler wash extracts are given in IV.D.4.b and c.
IV.D.4.b. Normal Filter Extraction and Interior Rinse
43
(PIPS)
(1) Place sampler on the table.
(2) Use plastic electrical tape to seal the inlet slits. Do
not wrinkle the tape in order to prevent leaks.
(3) Remove the screws. Take the inlet out of the base and
put it upside down on the table. Be careful not to
contaminate the inlet.
(4) Using clean forceps, take the impactor out of the base
and place it in a 32 oz. polystyrene disposable
container, add 180 ml distilled water, cap and put in
the ultrasonic bath for 30 minutes.
(5) Again using clean forceps, separate the section of the
filter holding the frame and remove the Teflon filter.
(6) Insert the Teflon filter into a 2 oz. jar with the
exposed side down, add 20 ml distilled water, cap and put in the ultrasonic bath for 30 minutes.
(7) Put 40 ml distilled water in a clean 2 oz. bottle. Hold the taped inlet upside-down. Dip a clean cotton swab
(Food Lion Corp., Salisbury, NC) in the wash solution
and swab out the underside of the inlet. Pour all the
wash solution into the inlet through the small holes and
shake for 2 minutes. Cut the head of the cotton swab
and put it in this 2 oz. bottle. Drain the wash fluid
into this bottle and put in the ultrasonic bath with the
the fluid in each section that needs rinsing. Pour the
remaining wash solution into the inlet through the small
holes and shake for 2 minutes. Drain the wash fluid
into this bottle completely.
(9) Repeat step (4) two or three times until all the uranine
is washed out from the impactor.
(10) Pipet all sample solutions of 3.3 ml into small
cuvettes. Add 50 nl pH 10 buffer into each cuvette and
leave these cuvettes in the dark for 15 minutes.
(11) Analyze all the washing solutions using the SLM Aminco
Fluoro-Colorimeter II.IV.D.4.C. Normal Filter Extraction and Interior Rinse
Procedure for Saturation Monitor
(1) Place the sampler on the table.
(2) Unscrew the adapter from the base. Place the body
without the base upside down on the table. Using clean
forceps, take the anti-twist ring out of the base and
put it inside the upside-down body.
(3) Using clean forceps, insert the glass fiber filter into
a 2 oz. jar with the exposed side down, add 20 ml
distilled water, cap and put in the ultrasonic bath for
45
(4) Remove the cap out of the body. Pull the impactor out
of the assembly ring. Using clean forceps, place the
impactor in a 4 oz. jar, add 80 ml distilled water, cap
and put in the ultrasonic bath for 30 minutes.
(5) Put 40 ml distilled water in a clean 2 oz. bottle. Hold
the body upside-down exactly above the cap. Dip a clean
cotton swab in the wash solution and swab out the
underside of the body. Let the excess washing solution
flow into the cap. After swabbing the inside of the
body, swab the inside of the cap. Cut the head of the
cotton swab and put it in this 2 oz. bottle. Pour the
wash fluid out of the cap into this bottle and put in
the ultrasonic bath with the swab head for 20 minutes.
(6) Put 40 ml distilled water in a clean 2 oz. bottle. Use
a clean pipet and rinse the body by turning it so that
the fluid rinses each section. Let the excess wash
solution flow into the cap. Rinse the cap after rinsing
the body. Pour the wash solution completely out of the
cap into the bottle.
(7) Repeat step (4) two or three times until all the uranine
is washed out from the impactor.(8) Repeat step (3) two times to make sure all the uranine
washed out of the glass fiber filters.
(9) Pipet all sample solutions of 3.3 ml into small
cuvettes. Add 50 ;xl pH 10 buffer into each cuvette and
47
V. RESULTS, DISCUSSIOH, AND C0MCLD8I0K8
V«A. Sensitivity Test
V.A.l. Calibration Curve
V.A.I.a. Determination of Amount of Buffer in Uranine and
Distilled Water Solution
From Figure 5 the pH value increases sharply with the
increase of pH 10 buffer but becomes stable when the ratio
of buffer to distilled water reaches about 0.003. Hence,
there is large buffer region to maintain the pH value at 10.
If the ratio of buffer to distilled water is less than
0.003, the solution cannot maintain the pH value at 10.
However, excess buffer solution will increase the volume of
uranine and distilled water solution and lower the actual
solution concentration, so that a balance point must be
found. From Table 1, generally the uranine and distilled
water solution with 50 lil buffer have the highest reading at
every concentration, so that the 50 nl pH 10 buffer in 3.3
ml uranine and distilled water solution is specified. The
14.00
12.00
10.00 H
^ 8.00
O
>
CL
— - 4.00 H
-o o
2.00
-0.00 T—I—I—I—I—I—I—I—I—I—I—I—I—I—I—I—I—I—I—I—I—I—r
0.000 0.005 0.010 0.015 0.020 0.025
Buffer/H20 (ml/ml)
Figure 5. Ratio of Buffer to Distilled Water
49
Table 1. Fluorescence Intensity vs Amount of Buffer
Cone Pure 0.04 ml 0.05 ml 0.06 ml 0.075 ml 0.1 ml (ua/ml) Dis H20 Buffer Buffer Buffer Buffer Buffer
2.000 4.1400 5.6400 5.6200 5.4500 5.5100 5.4700 1.000 1.9900 2.7100 2.7300 2.6600 2.6900 2.6600
0.500 1.0000 1.3400 1.3400 1.3300 1.3300 1.3100
0.200 0.3910 0.5360 0.5400 0.5260 0.5290 0.5260 0.100 0.1950 0.2660 0.2690 0.2570 0.2610 0.2610
0.050 0.0940 0.1290 0.1330 0.1250 0.1290 0.1270 0.020 0.0370 0.0502 0.0524 0.0470 0.0500 0.0500 0.010 0.0179 0.0232 0.0270 0.0222 0.0260 0.0246
V.A.l.b. Calibration Curves
V.A.l.b.i. Uranine and Distilled Water Solution
From Figure 6, buffer dramatically increases the
sensitivity of uranine and distilled water solution. This
result is consistent with Drabent et al. (1964) and Pant's
result (1968) because only bivalent negative ions exist in
uranine and distilled water solution when the pH value is
above 10. Therefore, uranine and distilled water solution
with pH 10 buffer have both the maximum absorption and
emission of fluorescence. There is a significant linear
relation between fluorescence intensity and the
concentration of the solution with a range of 0.005 tig/ml
and 2 ^g/ml. However, there is a poor linear relationship
below 0.005 ^g/ml.
In order to evaluate the accuracy of the SLM Aminco
Fluoro-Colorimeter, we repeat the experiments above by
continuously measuring the same sample ten times. The
results are presented in Table 2. From Table 2, the
accuracy above 0.005 /ixg/ml is high, but drops dramatically
below 0.005 ftq/ml. A possible way to increase the
sensitivity and to reduce noise is to replace the primary
Table 2. Fluorometer Accuracy Test
52
1 0.1 0.01 0.005 0.002 0.001 fuq/ml) (uq/ml) fua/ml) (ua/ml) fua/ml) (ucf/ml) 2.72 0.257 0.0220 0.0099 0.0015 -0.0015
-. 2.71 0.256 0.0236 0.0101 0.0038 -0.0010
2.70 0.255 0.0214 0.0092 0.0020 -0.0011 2.70 0.255 0.0217 0.0089 0.0006 -0.0007
2.71 0.256 0.0238 0.0084 0.0007 -0.0012 2.70 0.255 0.0221 0.0082 0.0045 -0.0019 2.70 0.255 0.0217 0.0085 0.0051 -0.0026 2.70 0.256 0.0251 0.0094 0.0011 -0.0023 2.69 0.254 0.0216 0.0095 0.0002 -0.0018 2.69 0.255 0.0218 0.0096 0.0022 -0.0017 Mean 2.702 0.2554 0.02248 0.00917 0.00217
Std Dev 0.0092 0.00084 0.00124 0.00065 0.00172
nm. The secondary filter works well because it passes all
emission light above 405 nm. The zero point reading in the
fluorometer is between 0.002 ^ig/TD^l and 0.001 /xg/ml.
V.A.l.b.ii. Uranine and Sodium Hydroxide Solution
Figure 7 and 8 show notable linear relationships
between fluorescence intensity and the concentration of the
solution with a range of 0.005 /xg/ml and 2 /xg/ml in both
0.001 N and 0.01 N sodium hydroxide solutions.
V.A.l.b.iii. Uranine and Ethanol Solution
From Figure 9, there is very poor sensitivity and a
poor linear relationship of uranine and ethanol solution.
Adding pH 10 buffer in ethanol significantly increases the sensitivity. There is a substantial linear relationship
between fluorescence intensity and the concentration of the
solution with a range of 0.005 Mg/nil and 2 jug/ml. The
chemical reactionship of uranine and ethanol solution with buffer is unknown. A reasonable explanation for the
behavior of the buffered solution is that there is an
increase of bivalent uranine ions, with the highest
54
10-y
>^
^
J/ 11
1- 1 '^ 1
n 1
n-T
1 II J
1 II /
w
>>v
n 1
J' 11
^ 0.1 -.
/A 1
<t> :
>^ r ^ J lt
4—' ͣ /
c K
41 1 j]
0.01
-A
0.001
-0.001 0.01 0.1 1 10
Concentration (ug/nni)
Figure 7. Calibration Curve of 0.001 N
10
>s
I 0.,
(D
0.01
0.001
^H-T-i
HK 1 1
ril 1 111
411 1 1 II
11
m
''^"ht
Hi
r / III
III 1 1 11
ir
r 1T"UT
1 f
n 1
III 1 1 It
h III 1---1--- TTl
0.001 0.01 0.1 1 10
Concentration (ug/nni)
Figure 8. Calibration Curve of 0.01 N
se
10
'^ 0.1
0.01
0.001
ͣͣ
^ ' 11 it'
A
t I 1 11W/
—iTf'Ti"If 1
2#
'ͣm---wT
ATW
4^
^11
1 1
"^
nTn
ͣ
fftr—
nf—
/ /
r Ik
K
4
'i II1
.
-II
i^ 1 1
III
ͣ
11
0.001 0.01 9-'' / Z N ^°
Concentration (ug/nni)
ooooo with buffer 4L*_*A* without buffer
V.A.l.b.iv. Overall Comparison
The calibration curves of distilled water with buffer,
0.001 N sodium hydroxide, 0.01 N sodium hydroxide, and
ethanol with buffer are put on at the same time in Figure
10. From Figure 10 it seems that distilled water with
buffer, 0.001 N sodium hydroxide, and 0.01 N sodium
hydroxide have nearly the same sensitivity; however, ethanol
with buffer has a lower sensitivity than other solutions.
V.A.2. Sensitivity Comparison
V.A.2.a. Sensitivity Test
From Table 3 at concentration 0.99 |xg/ml, 0.01 N sodium
hydroxide has the highest sensitivity. At the same
concentration, distilled water with buffer, 0.001 N sodium
hydroxide, and 0.1 N sodium hydroxide have high sensitivity.
Ethanol with buffer has only fair sensitivity. Pure
distilled water and ethanol have poor sensitivity. From
Table 4, at concentration, 0.01 /ig/ml distilled water has
the highest sensitivity and 0.001 N, 0.01 N, and 0.1 N
sodium hydroxide have high sensitivity. Pure distilled
58
0.001 ~1---1—I I I II III---1—I I I I iii|---1—I I I I nil---1—I I I I III
0.001 0.01 0.1 1 10
Concentration (ug/nni)
ooooo distilled water with buffer
**A** 0.001 N NaOH ^oo^o 0.001 N NaOH
««*** ethonol with buffer
Table 3. Comparison of Sensitivity at High Concentration
Dis H20 Dis H20 Ethanol Ethanol
Sample with without 0.001 N 0.01 N 0.1 N with without
No Buffer Buffer NaOH NaOH NaOH Buffer Buffer
1 2.83 2.03 2.79 3.10 2.82 2.32 1.39
2 2.75 1.99 2.81 3.08 2.78 2.30 1.35
3 2.82 2.03 2.81 3.15 2.85 2.35 1.42
Table 4. Comparison of Sensitivity at Low Concentration
Sample
No
Dis H20 with
Buffer
Dis H20
without
Buffer
0.001 N
NaOH
0.01 N
NaOH
0.1 N
NaOH 1
2 3
0.0239 0.0225 0.0227
0.0154
0.0136
0.0144
0.0201
0.0199 0.0199
0.0199
0.0212 0.0205
0.0187
60
V.A.2.b. PH Value Test
From Figure 11 there is only 3% fluctuation of
fluorescence intensity between pH value 10 and 12. Hence,
pH value above 10 has no effect on fluorescence intensity.
V.A.3. Conclusions of Sensitivity Test
a. The addition of pH 10 buffer changes the pH value of
solutions and significantly increases the sensitivity of
both uranine and distilled water and uranine and ethanol
solutions.
b. There is a substantial linear relationship between
fluorescence intensity and the concentration of the
solution when the concentration of the solution is higher
than 0.005 /ig/ml in distilled water with buffer, 0.001 N
sodium hydroxide, 0.01 N sodium hydroxide, 0.1 N sodium
hydroxide, and ethanol with buffer. There is a very poor
linear relationship in these solutions when theconcentration is lower than 0.005 /ig/ml.
c. The order of sensitivity:
Distilled water with buffer
O.OQl N sodium hydroxide
0.01 N sodium hydroxide
0.1 N sodium hydroxide
Ethanol with
>> 5.00
4.50 H
4.00
3.50
3.00 -\
^ 2.50
-CD
^2.00
1.50
1.00 H
0.50 H