What Really Happens When Patients leave the ED? Self-Reported
Discharge Instruction Adherence Among Different Racial Groups
Seen in the Emergency Department.
By Tiencia DePass
A Master's Paper submitted to the faculty of The University of North Carolina at Chapel Hill
In partial fulfillment of the requirements for The degree of Master of Public Health in
The Public Health Leadership Program
F-1
'
©2003
Abstract
Tiencia D. DePass
What Really Happens When Patients Leave the ED?
Self-Reported Discharge Instruction Adherence Among Different Racial Groups
Seen in the Emergency Department.
(Under the direction of Jane Brice MD,MPH and Timothy Carey MD, MPH)
Objectives: To compare the adherence rates to discharge instructions and barriers faced
between White, Black and Hispanic patients. Methods: Of 268 White, 141 Black, and 64
Hispanic eligible patients who were discharged from the emergency department with a
recommended follow-up within two weeks, 133 (53.1%) White, 69 ( 48.9% )Black, and 49
(76.6%) Hispanic completed a telephone interview within two to four weeks following
their emergency department discharge to determine their adherence to follow-up and
prescription filling. Results: Adherence to follow-up was 62.41% in Whites, 56.52% in
Blacks, and 53.06% in Hispanics (ns with X2 test). Adherence to prescription filling was
83.75% in Whites, 86.79% in Blacks, and 94.59% in Hispanics (ns with X2 test). White
patients were more likely to report feeling better (30%) as a barrier to follow-up, while
Black (49%)and Hispanic (34%) patients were more likely to have difficulty in getting an
appointment within the 2 weeks. Conclusion: Blacks and Hispanics are more likely than
Whites to report difficulty in getting an appointment within a two-week period for
follow-up even though the overall adherence is similar between groups. Despite the
varied level of uninsured patients within each racial group, cost was not found to be a
major barrier. This suggests that improving adherence for a diverse population will
require addressing institutional barriers such as appointment wait time and physician to
Dedication
To my most cherished blessing, my family, who believed in my potential before I ever did
To my heart, Andy, who's undying love and encouragement kept me going And to all the patients who gave me their time and reminded me with each brief
conversation why all the hours put into this project were well worthwhile.
Acknowledgements
This work was supported by the EMF/SAEM Medical Student Research Grant. I would like to thank Jane Brice, Timothy Carey, Eugene Oddome, Knox Todd, and Vijaya Hogan for their support, valuable advice and guidance with the
CONTENTS
LIST OF TABLES ... 6
LIST OF FIGURES ... 7
!.INTRODUCTION ... 8
2.MODEL OF ADHERENCE ... lO
3.STUDY METHOD AND RESULTS ... 12
4. DISCUSSION ... l7
5. CONCLUSION ... 22
~--6. REFERENCES ... 23
List of Tables
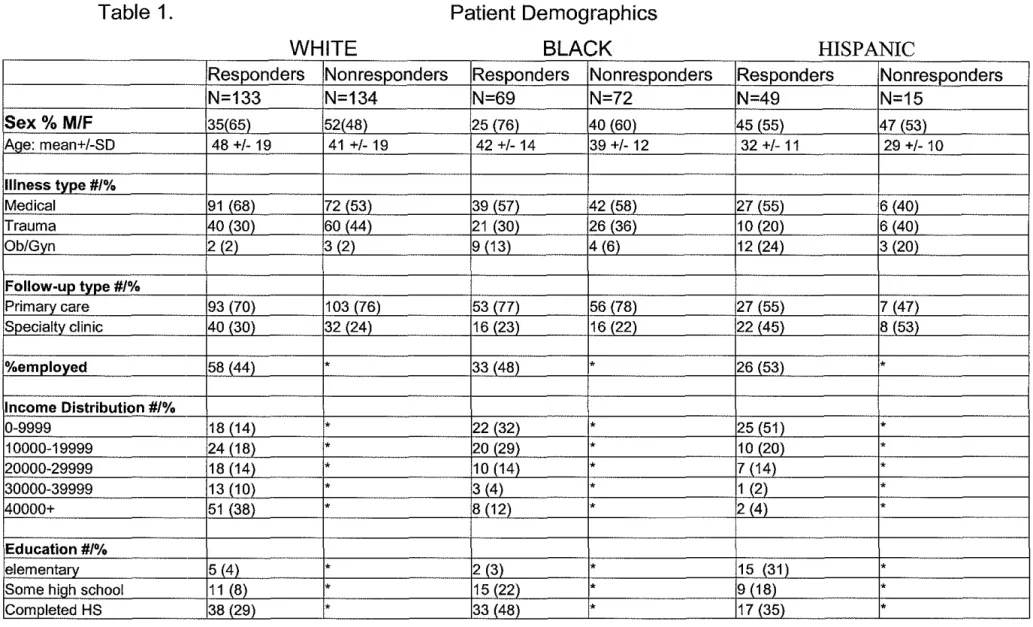
Table 1. Patient Demographics
Table 2. Barriers to adherence for Whites by potential predictors Table 3. Barriers to adherence for Blacks by potential predictors Table 4. Barriers to adherence for Hispanics by potential predictors
E
'
L
List of Figures
Figure 1. Theoretical Model of Adherence
Figure 2. Patient Flow Chart and Response Rates Figure 3. Adherence to Follow-up
Figure 4. Adherence to Prescription Filling
Figure S. Barriers to Follow-up for White Patients Figure 6. Barriers to Follow-up for Black Patients Figure 7. Barriers to Follow-up for Hispanic Patients
Introduction
The 2002 IOM report Unequal Treatment1 clearly demonstrates the
widespread disparities in access, utilization, and health outcomes that exist in
medicine for racial minorities. Although much of disparities research has focused
on the inequities in the use of medical interventions and therapies by physicians,
other factors associated with patient health behaviors can have a large impact on
health outcomes as well. One health behavior that is of particular concern in
Emergency Medicine is patient adherence to discharge instructions. Compliance
I
f
'
with discharge instructions after an emergency visit is necessary to safely manage
illnesses that have the potential to progress but do not warrant hospitalization. Jn
addition, it also serves to get patients who present with illnesses that are not
acutely life threatening networked into primary care so that future emergency care
use can be utilized more appropriately.
There have been several studies that have looked at patient adherence to
follow-up in the ambulatory setting which suggest decreased follow-up in
minority populations2, however very few looked specifically at adherence to
discharge instructions from the emergency department. The existing literature on
emergency department adherence includes studies that do not explore adherence
to follow-up as they relate to race across a broad spectrum of ailments. Bazarian
L
L__ and found that African Americans were almost three times less likely to attend a
follow-up visit then the general population.3 While Bazarian et a!. did explore possible barriers to follow-up for their convenience sample, they only focused on patients with head injuries and did not attempt to explore the reasons for the significant racial gap.3 Leickly et al.'s study focused on barriers to adherence for inner city asthma patients seen in the ED with population comprised of African American and Hispanic patients.4 They found several barriers to both medicine use and appointment keeping but did not compare these measures controlling for race. While there are identifiable barriers to adherence that apply across the general population that have been noted in multiple prior studies4, such as cost
L
I
and lack of transportation, certain barriers may be more prevalent in minority population.4'5 Identifying these key factors which contribute to barriers to ED follow-up for specific racial groups will be useful not only to define a problem of access but to create a solution. If there are significant differences in the barriers to adherence faced by patients of different ethnicities, this will direct EDs as to which contributing factors should be addressed depending on their own
demographic population. The primary objective of this study was to compare the adherence rates for emergency department (ED) follow-up and prescription filling between White, Black and Hispanic adult patients and to determine the key barriers to adherence faced by each racial group.
Null Hypothesis: The null hypothesize is that there will be no racial differences
time, forgot, fear of side effects, felt better], and institutional barriers [difficulty getting an appointment, not able to get appointment within 2 weeks, pharmacy did not cary prescription]) to adherence that patients faced.
Theoretical Model of Adherence
In order to understand the relationship between race and other factors that contribute to patient adherence, we developed our own theoretical model (Figure I). This model uses the general framework provided by Aday and Anderson's Behavioral Mode!6• 7 and the Leduc et al.'s 8Compliance Model, but has been adjusted to include our own hypothesis based on the literature and personal experience of specific factors which describe how race can potentially affect patterns of adherence.
particular pattern of adherence. In addition, race can affect the quality of care a patient receives by influencing a health care provider's interaction and decision making with the patients. Early work in Nagy and Wolfe's compliance study based in a veteran's hospital found that patient satisfaction with their health care greatly influenced their compliance to discharge instructions.14 This positive effect of patient satisfaction on compliance has also been demonstrated in other studies as well.15
After the initial intent to adhere is made based in large part by the above-mentioned predisposing factors, there are other factors that mediate whether the patient's initial intent to adhere (or not to adhere) is actually followed through. In addition to the enabling factors that were previously described, organizational and individual factors as well as a change in health status mediate a patient's
adherence. Organizational factors describe the design of the health care delivery system in which the patient seeks care. This includes factors such as the type of follow-up (ED/primary care vs. specialty clinics), the availability of medication at a particular pharmacy, the patient-physician ratio at a clinic, and appointment wait time. Individual factors are patient characteristics that are not specific to any particular group and include factors like not having time or forgetting an
appointment. Finally the change in health status of a patient after they are
L
discharged can change a patient's initial intent to adhere.investigated. The patient's health beliefs was not evaluated in this study because their general health beliefs are not as important as are their specific health beliefs concerning the illness that caused them to seek emergency care in affecting their intent to adhere. Since we are interested in adherence across a variety of ailments it was not possible to effectively measure the range of responses with a simple multiple choice question. Another study design, such as a qualitative study would be more appropriate to measure the impact ofthis factor on adherence.
Methods
Study Design. A prospective follow-up study of patients discharged from the
emergency department from February to July of2003 was performed. The Duke School of Medicine and the UNC School of Medicine institutional review boards approved all aspects ofthis study before implementation and a waiver of written consent was received.
Study Setting and population. The study was performed in the ED of the
University of North Carolina at Chapel Hill, a 665-bed suburban tertiary care center. The emergency department has a 3-year emergency medicine residency and is a level-I trauma center with an annual census of 60,000 patients. The study sample included White, Black and Hispanic adult (> 18 years) patients discharged with written instructions to received follow-up within two weeks.
Survey Content: The survey instrument created for this study focused on patient
demographics, measures of SES, health status, satisfaction with emergency
I
L
~--department care, adherence to prescription filling/follow-up appointments, and barriers to adherence.
The English survey was translated into Spanish and then back translated to English by a different translator to verify the accuracy of the translation. The Spanish version of the instrument included additional items focused on quality of hospital translators. The surveys were pre-tested on 10 people prior to patient enrollment in order to confirm clarify of survey items/instructions.
Survey items inquiring about specific barriers to adherence were
developed based on the existing literature. The listed barriers of "cost", "fear of side effects", "forgot", "no time", and "no availability of earlier appointments" were found to be common barriers in Leickly et a!.' s adherence study. "Lack of child care" was another barrier included on our survey that was found to be one of the most significant barriers in an earlier ED compliance study.14 Another listed barrier for prescription filling of "pharmacy did have the medication" was recently suggested by Morrison et a!.' s study that reported that pharmacies in nonwhite neighborhoods were less adequately stocked with pain prescriptions. 6 During the survey administration patients were inquired about each specific potential barrier and also asked about any other barriers not explicitly included in the survey options.
Survey Administration. Based on the current adherence literature we estimated
that the overall level of adherence would be 66% and that of African Americans to be 49% (consistent reports of adherence for Hispanics was not found). A pre-test power calculation suggest that approximately 134 patients in each racial
L
group would be needed to detect a minimum difference of 17%( alpha 0.05, beta 0.80). One hundred and fifty were sought to email in each arm.
All ED charts were reviewed from three pre-selected days a week .The selected days were varied each week so that there was equal sampling of
weekdays and weekends. ED charts were reviewed sequentially for patients who were discharged two weeks prior and met the following inclusion criteria:
l.age>l8, 2.discharged home from the ED after being seen by a MD, 3. written instructions on chart to follow up within two weeks (follow up included
recommendations to be seen by Univ. hospital clinic, ED urgent care, and/or
private physician), 4. recorded race of White, Black, or Hispanic, and 5. primary
i
language of English or Spanish. The exclusion criteria were:!. patients withI
significant mental impairment (as indicated in the patient history or physical examr
findings), 2.patients that received a psych consult while in the ED, 3.patients whowere from institutions (jail or care facilities), 4. return ED patients who had already completed a survey, and S.patients who received instruction to follow-up only if needed.
patient's preferred language. Bilingual interviewers performed all the Hispanic
interviews.
Data Analysis. The response rate was calculated by dividing the number of completed interviews by the number of patients who we attempted to contact to
participate in the study. Survey data was complied into an Excel database and
Stata software (version 6.0, Stata Corporation, College Station, TX) was then
used to estimate the Chi-square (p<O.OS) to compare the two dichotomous
primary outcome and possible associations between other variables of interest
gathered in the survey. Multiple logistic regressions were used to predict
compliance and access the impact of the following potential predictors: race, sex,
age, insurance, income, employment status, education, health status, illness type,
and satisfaction with care. Those factors with appeared to have predictive value in
individual comparisons (p<.l 0) were then combined into a single logistic
regression model in order to determine true significance(p<.OS) when controlling
for confounding interactions. The dependent variables were adherence to
follow-up and prescription filling. Descriptive statistics were used to provide frequencies
of various patient characteristics.
Results Sample characteristics:
There were 133 White, 69 Black, and 49 Hispanic telephones surveys completed
between February and June of2003. Only 9(18%) of the interviews of Hispanic
Spanish according to patient preference by bilingual interviewers. The response rates for each racial group was 49.6%, 48.9%, and 76.6% respectively. The majority of nomesponders were lost to follow-up due to invalid phone numbers or inability to contact within the defined 4-week period. (Figure 2)
Patient demographics were compared for each racial group for both responders and nomesponders. The average patient age of 29-32 for Hispanics was lower then both that of Blacks and Whites. The majority ofthe Black and Hispanic populations were distributed in the lower income ( < $20,000) and education (high school or less) brackets when compared to the White population. The Hispanics had the highest level of uninsured visits at 71.43-80%. In general when the responders were compared to the nomesponders for each racial group, the responders were more likely to be insured (Table 1 ).
Adherence to Follow-up/ Prescriptions
There was a trend of decreased adherence to follow-up when Black and Hispanic patients were compared to Whites (W= 83/133(62.41 %), B=
39/69(56.52%), H=26/49 (53.06%)) Figure 3. This trend was reversed with their adherence to prescription filling (W= 67/80 (83.75%), B= 46/53 (86.79%), H 35/37 (94.59%)) Figure 4. These trends were not statistically significant using the X2 test (adherence to follow-up, p=0.59/ adherence to prescriptions, p=0.102. ).
Barriers to Adherence
Cost and transportation was not found to be a major barrier within any of the racial groups. White patients were most likely to report "feeling better" as a reason for nonadherence to follow-up (14(30%)) Figure 5. Hispanic (4(34%)) and
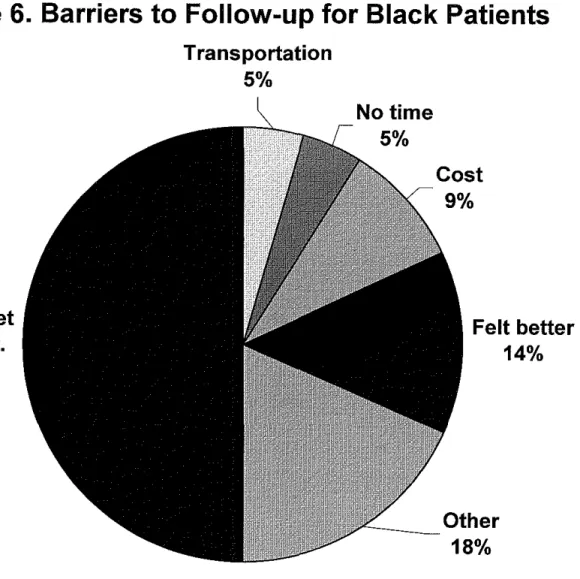
Black (11(42%)) patients were most likely to report" could not get an earlier appointment" as their main barrier to acute follow-up. Figure 6, Figure 7.
When we looked at the barriers faced to prescription filling, Whites were found to report "didn't need it" as their main barrier (11/52.4%). The main barriers for Black patients were "other"(5/35.7 %) followed closely by "cost" (4/28.6%). The small percentage ofnonadherent Hispanics (<7% of their total population or 3 patients) precluded a meaningful classification of their barriers.
Predictors for nonadherence
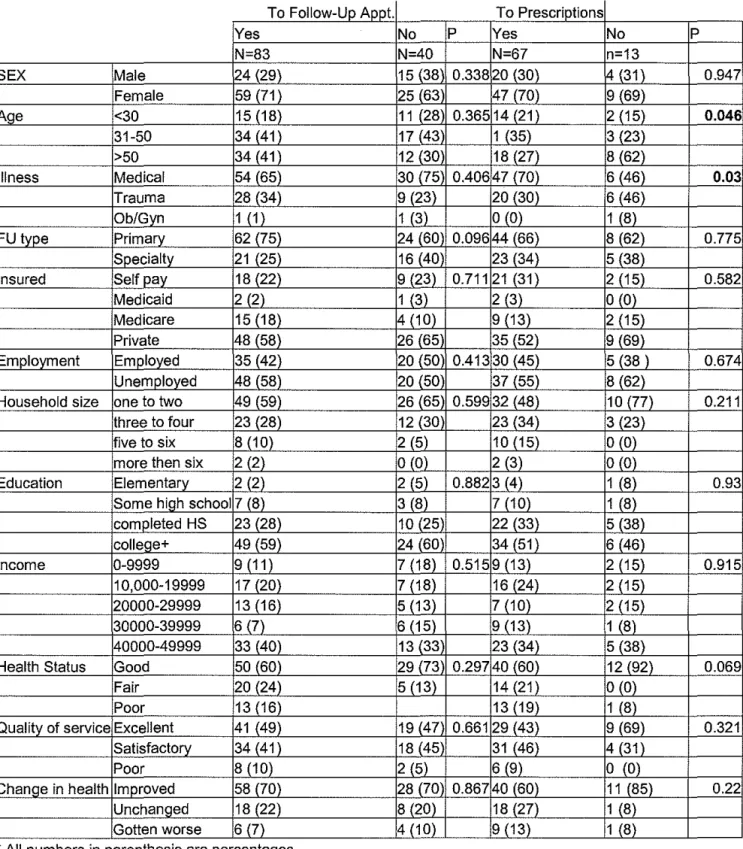
Regression analysis of potential factors predictive of adherence found that only age was significantly correlated with adherence. Older patients had increased adherence to follow-up (OR 1.02, p=.046) but decreased adherence to prescription filling( OR 0.95, p=.001 ). All of the other eleven main potential predictors of adherence (sex, age, illness type, insurance, employment, education, income, health statns, patient satisfaction, and change in health status) were not found to
be significant (p>.05).
L
¥-Discnssion
Our preliminary data did not show a difference in adherence to follow-up appointments or prescription filling among different racial groups seen in the
Emergency department. Although there was a pattern of decreased adherence
L
to follow-up for minority populations and increased adherence to prescriptionunknown if this small difference will grow to statistical significance once total patient enrolhnent is completed, however the apparent diminished disparity suggests that the large racial variances in adherence reported elsewhere are not consistent throughout emergency medicine but may be a characteristic specific to a particular population and/or institution.
Out of all the potential predictors of compliance, only the trend of age fit the regression model of adherence to follow-up. This suggests that the variability seen in adherence levels reported in the literature for different racial groups is merely a byproduct of the fact that the age distribution differs among groups seen in the ED and is not intrinsically associated to
characteristics of any particular racial group.
While this study does not support the claim that racial disparities in medicine are found in patient adherence in the Emergency Department, this study does suggest that the barriers to adherence faced by patients vary among racial groups in this setting. Blacks and Hispanics were found to be more likely than Whites to report difficulty in getting an appointment within a 2-week period. The cause of this relationship between race and barriers faced should be explored further in order to determine if these findings are
reproducible and result largely from generalized institutional barriers specific to the health system in which patients seek their follow-up care ( such as patient-physician ratio, administration policy or characteristics, etc.) or if this effect is created by the differential impact of institutional policies/procedures among racial groups. If the White, Black, and Hispanic patients all sought
j_
I
..
Fhealthcare within the same institutions but Black and Hispanic patients are consistently found to have more difficulty in obtaining acute follow-up, this would suggest that the institution preferentially accommodates one racial group over the other either intentionally or unintentionally as a result of its structure and policies. Conversely if White, Black and Hispanic patients tend to seek their health care within different health systems, the differences in the main barriers that each population faces could be a result of general
differences in the institutions. For example if minority populations are more likely to receive care in facilities with high patient/health provider ratios (i.e. health departments), this would increase their chance of being unable to
receive timely care even when acute follow-up is recommended. In this case if White patients were then to seek their care in these same institutions they would be expected to experience the similar levels of difficulty in getting short-term follow-up as demonstrated in the minority populations.
Determining the underlying problem to explain our results will be important in developing successful intervention strategies to improve
institutional will not solve the problem because the available resources will continue to be distributed unevenly unless the underlying policies which tend to favor certain patient groups can be changed.
Limitations:
Although we have completed nearly 50% of the interviews (233/450) at this time, the study is not yet complete so the available data can only demonstrate general trends. Although the Chi-square tests for significance were performed it is unknown if the adherence rates or trends among racial groups will significantly change when the study is complete.
Our methodology prevented the participation of patients who did not have telephones, had numbers that were recently disconnected, or who were not available during the hours of 10AM-9PM. The baseline characteristics varied among the responders and nonresponders, particularly in the fact that
nonresponders were more likely to be uninsured, suggests that the adherence estimates found in the study will be overestimates for all racial groups due to the effects of this nonresponse bias.
Due to the fact that we are using self reported surveys, we cannot validate the answers provided. There could potentially be a social desirability factor which may cause patients to be less likely to admit things that they perceive to be
survey did not directly evaluate the patient's health beliefs. In addition, several factors in our theoretical model such as health status, quality of care, change in health, and health outcomes can all be quantified both objectively (using
physician evaluation or specific criteria) and subjectively. The survey design of this study limits our evaluation to the patient's own perception of these measures. It is unknown how well their perceptions would correlate to objective measures or how using objective measures could change our conclusions.
Conclusions
We did not find significant differences in adherence between racial groups but did find that the barriers to adherence differed among populations with
minorities experiencing more difficulty in obtaining follow-up appointments within a two-week time period. Although much of current health policy focuses on decreasing financial barriers in order to improve access, cost was not found to be a major barrier in any of our patients groups. This suggests that health policy
should begin to focus more on institutional factors in order to improve access to '
L
care and that different intervention strategies may be needed to improve patient f.-adherence within a diverse population.
Future research should investigate adherence levels between racial groups within different institutions to identify the specific settings in which interventions are needed to address racial disparities and to learn what policies in other
institutions prevent large disparities from existing. In addition, data gathered should include where patients are seeking their care so it can be determined if differences in the barriers faced by racial groups result from generalized institutional barriers or specific institutional biases are created by
policies/administrative organization that tend to favor particular groups. This will be important in order develop successful interventions to improve overall
References
!.Smedley B, Stith A, Nelson A. Unequal Treatment: Confronting Racial and
Ethnic Disparities in Health Care. Washington, DC: National Academics Press;
2001. Available at: http://search.nap.edu/books/030908265X/html/. Accessed
February 2003.
2.Cardin V, Grimes R, eta!. Low-income minority women at risk for cervical
cancer: A process to improve adherence to follow-up recommendations. Public
Health Reports. 2001; 116: 608-616.
3.Bazarian J, Hartman M, eta!. Minor head injury: Predicting follow-up after
discharge from the Emergency Department. Brain Injury. 2000; 14(3): 285-294.
4.Sarver J, Baker D. Effect of language barriers on follow-up appointments after
an Emergency Department visit. J Gen Intern Med. 2000; 15:256-264.
5.Leickly F, eta!. Self-reported adherence, management behavior, and barriers to
care after an Emergency Department visit by inner city children with asthma.
Pediatrics. 1998; 101 (5): http://www.pediactric.org/cgi/content/full/1 0 1!5/e8
6. Morrison R, Wallenstein S, eta!. We don't carry that- failure of pharmacies in
predominately nonwhite neighborhoods to stock opiod analgesics. NEJM. 2000;
342:1023-6.
7. Magnussen A, Hedges J, eta!. Follow-up compliance after Emergency
Department evaluation. Annals of Emergency Medicine. 1993; 22:560-567.
' ~
L
[ l
t
8.Vukmir R, Kremen R, eta!. Compliance with Emergency Department referral:
The effects of computerized discharge instructions. Annals of Emergency
Medicine. 1993; 22: 819-823.
9. Barlas D, Homan C, eta!. How well do patients obtain short-term follow-up
alter discharge from the Emergency Department? Annals Emergency Medicine.
1999; 34:610-614.
1 O.Aday L, Anderson R. A framework for the study of access to medical care.
Health Services Research. 1974: 208-219.
11. Anderson R. Revisiting the behavioral model aud access to medical care: does
it matter? Journal of Health and Social Behavior. 1995; 36:1-10.
12. Leduc N, Tanuenbam T, Begmau H, eta!. Compliance of frail elderly with
health services prescribed at discharge from au acute-care geriatric ward. Med
Care. 1998; 36: 904-914.
13. Nagy V, Wolfe G. Cognitive Predictors of Compliance in Chronic Disease
Patients. Medical Care.1984; 22(10): 912-920.
14. Jones S, Jones P, Katz, Janet. Health Belief Model Intervention to Increase
Compliance With Emergency Department Patients. Medical Care. 1988; 26 (12):
1172-1183.
15. Smith N, Seale JP, Shaw J. Health Beliefs, Satisfaction, and Compliance.
Figure I.
Model for Adherence to ED Follow-up Appointments and Prescriptions
Organizational Factors
A
Health
Figure 2. Patient Enrollment and Response Rates
Response Rates
Overall 2511473= 53.1%
White (W) 133/268= 49.6%
Black (B) 69/141 = 48.9%
Hispanic (H) 49/64= 76.6%
Sampled Patients Called I I Agreed N=251 W=l33(47.8%) B=69(46.3%) H=49(75.4%) !included
L
N=473No Contacts N=97 W=65(23.4%) B=23(15.4%) H=9(!3.9%) Refill sed N=20 W=l2(4.3%) B=7(4.7%) H=l(1.5%)
Invalid Phone #
Table 1.
WHITE
Responders Nonresponders
N=133 N=134
Sex% M/F 35(65) 52(48)
Ar1e: mean+/-SD 48 +/- 19 41 +/- 19
Illness type #/%
Medical 91 (68) 72 (53)
Trauma 40 (30) 60 (44)
Ob/Gyn 2 (2) 3 (2)
Follow-up type #/%
Primary care 93 (70) 103 (76) Specialty clinic 40 (30) 32 (24)
%employed 58 (44) *
Income Distribution#/%
0-9999 18 (14) *
10000-19999 24(18) *
20000-29999 18 (14) *
30000-39999 13 (1 0) *
40000+ 51 (38) *
Education#/%
elementary 5 (4) *
Some high school 11 (8) * Completed HS 38 (29) *
Patient Demographics
BLACK
Responders Nonresponders
N=69 N=72
25 (76) 40 (60) 42 +/- 14 39 +/- 12
39 (57) 42 (58) 21 (30) 26 (36) 9 (13) 4 (6)
53 (77) 56 (78) 16 (23) 16 (22)
33 (48) *
22 (32) * 20 (29) * 10 (14) *
3 (4) *
8 (12) *
2 (3) *
15 (22) * 33 (48) *
HISPANIC
Responders Non responders
N=49 N=15
45 (55) 47 (53) 32 +/- 11 29 +/- 10
27 (55) 6 (40) 10 (20) 6 (40) 12 (24) 3 (20)
27 (55) 7 (47) 22 (45) 8 (53)
26 (53) *
25 (51) *
10 (20) *
7 (14) *
1 (2) *
2 (4) *
15 (31) *
9 (18) *
College/ Tech. 76 (57) * 19 (28) * 7 (14) *
Insurance status#/%
uninsured 31 (23) 57 (42) 21 (30) 29 (40) 35 (71) 12 (80)
Medicaid 4 (3) 10 (7) 7 (10) 8 (11) 1 (2) 0
Medicare 21 (16) 12 (9) 7 (10) 5 ( 7) 0 0
Table 2. Adherence for White patients by potential predictors
To Follow-Up Appt. To Prescriptions
I
Yes No p Yes No pN=83 N=40 N=67 n=13
SEX Male 24 {29) 15 {38 0.338 20 {30) 4 {31) 0.947 Female 59 (71) 25 {63 47 (70) 9 (69)
Age <30 15 (18) 11 (28 0.365 14 (21) 2 {15) 0.046
31-50 34 {41) 17 {43 1 {35) 3 {23)
>50 34 (41) 12 (30 18 (27) 8 (62)
Illness Medical 54 {65) 30 (75 0.406 47 {70) 6 {46) 0.03
Trauma 28 (34) 9 (23) 20 (30) 6 (46)
Ob/Gyn 1 { 1) 1 {3) 0 (0) 1 {8)
FU type Primary 62 (75) 24 (60 0.096 44 (66) 8 (62) 0.775 Specialty 21 {25) 16 (40 23 (34) 5 {38)
Insured Self pay 18 {22) 9 {23) 0.711 21 {31) 2 {15) 0.582
Medicaid 2 (2) 1 (3) 2 (3) 0 (0)
Medicare 15 (18) 4 {10) 9 {13) 2 {15) Private 48 (58) 26 (65 35 (52) 9 (69)
Employment Employed 35 (42) 20 (50 0.413 30 {45) 5 (38) 0.674 Unemployed 48 {58) 20 (50 37 {55) 8 (62)
Household size one to two 49 (59) 26 (65 0.599 32 (48) 10 (77) 0.211 three to four 23 {28) 12 (30 23 {34) 3 {23)
five to six 8 (10) 2 (5) 10 (15) 0 (0) more then six 2 (2) 0 (0) 2 (3) 0 {0)
Education Elementary 2 (2) 2 (5) 0.882 3 {4) 1 (8) 0.93 Some high school 7 (8) 3 (8) 7 (10) 1 (8)
completed HS 23 {28) 10 {25 22 {33) 5 (38) college+ 49 (59) 24 (60 34 (51) 6 (46)
Income 0-9999 9 {11) 7 (18) 0.515 9 {13) 2 {15) 0.915 10,000-19999 17 (20) 7 (18) 16 (24) 2 (15)
20000-29999 13 (16) 5 {13) 7 {10) 2 {15) 30000-39999 6 (7) 6 (15) 9 {13) 1 (8) 40000-49999 33 (40) 13 (33 23 (34) 5 (38)
Health Status Good 50 {60) 29 (73 0.297 40 {60) 12 {92) 0.069
Fair 20 (24) 5 (13) 14 (21) 0 (0)
Poor 13 (16) 13 (19) 1 {8)
Quality of service Excellent 41 (49) 19 {47 0.661 29 {43) 9 (69) 0.321 Satisfactory 34 {41) 18 (45 31 (46) 4 (31)
Poor 8 {10) 2 {5) 6 (9) 0 {0)
Change in health Improved 58 (70) 28 (70 0.867 40 (60) 11 (85) 0.22 Unchanged 18 (22) 8 (20) 18 {27) 1 {8)
Gotten worse 6 {7) 4 {10) 9 {13) 1 {8)
Table 3. Adherence for Black patients by potential predictors
To Follow-Up Appt.
Yes No
N=39 N=26
SEX Male 9 (23) 6 (23)
Female 30 (77) 20 (77
Age <30 9 (23) 8 (31}
31-50 20 (51) 13 (50
>50 10 (26) 5 (19)
Illness Medical 25 (64) 13 (50 Trauma 11 (28) 7 (27)
Ob/Gyn 3 (8) 6 (23)
FU type Primary 30 (77) 20 (77 Specialty 9 123) 6 (23) Insured Self pay 12 (31) 7 (27) Medicaid 4 (10) 3 (12)
Medicare 5 (13) 2 (8)
Private 18 (46) 14 (54
Employment Employed 16 (41) 14 (54 Unemployed 23 (59) 12 (46 Household size one to two 18 (46) 9 (35)
three to four 16 (41) 11 (42 five to six 5 (13) 5 (19) more then six 0 (0) 1 (4) Education Elementary 2 (5) 0 (0) Some hi!:lh school 7 (18) 7 (27) completed HS 19 (49) 13 (50 college+ 11 (28) 6 (23)
Income 0-9999 14 (36) 6 (23)
10,000-19999 11 (28) 9 (34) 20000-29999 4 (10) 5 (19) 30000-39999 0 (0) 3 (12) 40000-49999 6 (15) 2 (8) Health Status Good 23 (59) 17 (65
Fair 11 (28) 8 (31)
Poor 5 (13) 1 (4)
Quality of service Excellent 18 (46) 11 (42 Satisfactory 18 (46) 15 (58
Poor 3 (8) 0 (0)
Chanqe in health Improved 28 (72) 15 (58 Unchanged 7 (18) 9 (35) Gotten worse 4 (10) 2 (8)
To Prescriptions
p Yes
N=46 111 (24)
35 (76) 0.728 12 (26) 26 (57) 8 (17) 0.201 26 (57)
14 (30) 6 (13) 1 36 (78)
10 (22) 0.88 13 (26)
4 (9)
2 (4) 27 (59) 0.31 24 (52) 22 (48) 0.489 18 (39) 21 (46) 6 (13) 1 (2) 0.556 2 (4)
10 (22) 21 (46) 13 (28) 0.134 13 (7)
14 (30) 6 (13) 3 (7) 7 (15) 0.472 29 (63)
13 (28) 4 (9) 0.292 22 (48)
22 (48) 2 (4) 0.31 33 (72)
10 (22) 3 (7) No N=7 1 (14) 6 (86) 1 (14) 4 (57) 2 (29) 2 (29) 4 (57) 1 (14) 4 (57) 3 (43) 4 (57) 0 (0) 0 (0) 3 (43) 4 (57) 3 (43) 2 (29) 4 (57) 1 (14) 0 (0) 0 (0) 2 (29) 3 (43) 2 (29) 3 (43) 2 (29) 0 (0) 0 (0) 0 (0) 6 (86) 0 (0)
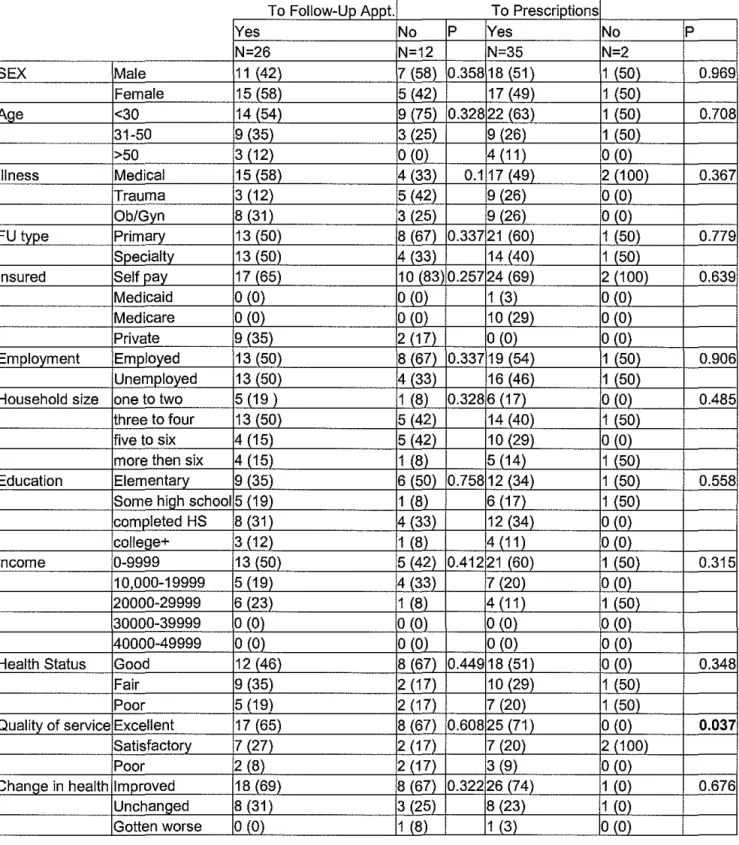
Table 3. Adherence for Hispanic patients by potential predictors
I
YesTo Follow-Up Appt. No
N=26 N=12
SEX Male 11 {42\ 7 (58)
Female 15 (58) 5 {42)
AQe <30 14 (54) 9 (75)
31-50 9 (35) 3 (25)
>50 3 (12) 0 (0)
Illness Medical 15 (58\ 4 (33\
Trauma 3 (12) 5 (42)
Ob/Gyn 8 (31) 3 (25\
FU type Primary 13 (50) 8 (67) Specialty 13 (50) 4 (33) Insured Self pay 17 (65) 10 (83
Medicaid 0 (0) 0 (0)
Medicare 0 (0) 0 (0\
Private 9 (35) 2 (17)
Employment Employed 13 (50) 8 (67) Unemployed 13 (50) 4 (33) Household size one to two 5 (19) 1 (8)
three to four 13 (50) 5 (42) five to six 4 (15) 5 (42) more then six 4 (15) 1 (8) Education Elementary 9 (35) 6 (50)
Some high school 5 (19) 1 (8)
completed HS 8 (31) 4 (33) college+ 3 (12) 1 (8)
Income 0-9999 13 (50) 5 (42)
1 0,000-19999 5 (19) 4 (33) 20000-29999 6 (23) 1 (8) 30000-39999 0 (0) 0 (0) 40000-49999 0 (0) 0 (0) Health Status Good 12 (46) 8 (67\
Fair 9 (35) 2 (17)
Poor 5 (19) 2 (17)
Quality of service Excellent 17 (65) 8 (67) Satisfactory 7 (27) 2 (17)
Poor 2 (8) 2 (17)
Change in health Improved 18 (69) 8 (67) Unchanged 8 (31) 3 (25) Gotten worse 0 (0) 1 (8)
To Prescriptions
p Yes
N=35 0.358 18 {51)
17 (49) 0.328 22 (63) 9 (26) 4 (11) 0.1 17 (49\
9 (26) 9 (26\ 0.337 21 (60)
14 (40) 0.257 24 (69)
1 (3) 10 (29\ 0 (0) 0.337 19 (54)
16 (46) 0.328 6 (17)
14 (40) 10 (29) 5 (14) 0.758 12 (34)
6 (17) 12 (34) 4 (11) 0.412 21 (60)
7 (20) 4 (11) 0 (0) 0 (0) 0.449 18 (51)
10 (29) 7 (20) 0.608 25 (71)
7 (20) 3 (9) 0.322 26 (74)
8 (23) 1 (3) No N=2 1 {50) 1 (50) 1 (50) 1 (50) 0 (0) 2 (1 00) 0 (0) 0 (0)
1 (50) 1 (50) 2 (100) 0 (0) 0 (0) 0 (0) 1 (50) 1 (50) 0 (0) 1 (50) 0 {0) 1 (50\ 1 (50) 1 (50) 0 (0) 0 (0) 1 (50) 0 (0) 1 (50) 0 (0) 0 (0) 0 (0) 1 (50) 1 (50) 0 (0) 2 (100) 0 (0) 1 (0) 1 (0) 0 (0) p 0.969 0.708 0.367 0.779 0.639 0.906 0.485 0.558 0.315 0.348 0.037 0.676 L
I
r
f
Figure 3.
Adherence to Follow-up Appointment
Total N=252 (W=134, B=69, H=49)
Adherence to Prescriptions
100
90
83.75%
80
70
-
c: 60(I)
._
(I)
.c: 50
"0
<(
'#. 40
30
20
10
o+----White
Figure 4.
Total N=252 ( W=l34, B=69, H=49)
p= 0.102
86.79%
Black Hispanic
L
:---Figure 5. Barriers to Follow-up for White Patients
Felt Better 30%
Could 111ot get an
earlier appt.
-27%
Transportation
4%
Difficulty getting an appt.
6%
Other
15%
Figure 6. Barriers to Follow-up for Black Patients
Transportation
Could not get
earlier appt.
49%
5%
No time
5%
Cost
9%
Felt better
14%
---
Other
Figure 7. Barriers to Follow-up for Hispanic Patients
Could not get an earlier appt.
34%
Other 17%
Cost 8%
Felt better 17%
Did not know who to call
No time 8%
8%