Violence, Alcohol, and Traumatic Brain Injuries:
Retrospective analysis of assault data from the University of North Carolina Hospitals and Kamuzu Central Hospital of Lilongwe, Malawi
By
Karen Meyerhoff
A Master’s Paper submitted to the faculty of the University of North Carolina at Chapel Hill
in partial fulfillment of the requirements for the degree of Master of Public Health in
the Public Health Leadership Program
Chapel Hill
2013
Advisor: Date
ABSTRACT
Alcohol use is associated with interpersonal violence, and head injuries are often the
result. Past studies have suggested that acute alcohol use prior to traumatic brain injury (TBI)
could decrease patient mortality, without focus on specific causes of TBIs. We compared
victims of interpersonal violence from two different global settings (a developed vs a developing
nation) to identify commonalities in risk factors and patterns of injury and test the association
between acute alcohol use and mortality in this specific population.
Results: In both populations (from the University of North Carolina (UNC) and those from Kamuzu Central Hospital in Lilongwe, Malawi), victims were more likely to be younger,
male, and have a head and/or face injury. Only two thirds of the UNC patients were tested for
blood alcohol levels on admission, but approximately half of those tested positive. From history
of self-report, only a third of the Malawian assault victims had used alcohol acutely. When UNC
and Malawi patient groups were combined, alcohol use was found to be associated with a
decreased mortality for all assault victims. For patients with possible traumatic brain injuries,
alcohol was found to be associated with a lower mortality rate in the UNC cohort but not in the
Malawian cohort (unadjusted).
Conclusions: Despite many differences in background and setting, assault victims from both UNC and Malawi were very similar in respect to age, gender, and type of injury. Alcohol
use was seen to be associated with a decreased mortality for patients in both cohorts regardless of
injury type, but further conclusions about its protective effects on mortality cannot be drawn due
to limitations of this retrospective analysis. Alcohol is highly correlated with head injuries in
both UNC and Malawian cohorts, so investigation into its availability in both settings could help
INTRODUCTION
Violence, or intentional, non-accidental injury between two or more people, occurs in
every country of the world despite differences in economic status, cultural background, and
degree of industrial and technological advancement. Analyzing trends in violence within patient
populations in a developed and a developing country can begin to shed light on risk factors in its
development. By identifying and attempting to characterize the major risk factors associated with
violence-related-injury in populations of disparate backgrounds, we are gathering evidence that
can be used to guide global and national policy on violence prevention and inform advances in
clinical care for assault victims to improve outcomes.
Global Perspective on Violence
In 2002, the WHO released the World Report on Violence and Health. 1The report compiles data from the 191 WHO member states examining the epidemiology of violence by
country. All subtypes of violence are examined, such as child and elder abuse and neglect,
violence in adolescents and young adults, intimate partner violence, sexual violence, self
inflicted violence, and what it terms “collective violence” or violence between groups to advance
political, social, or economic objectives. 2 For the purposes of our analysis, we will focus on interpersonal violence in the form of assault. This includes the categories of violence in
The United States
The United States of America (US) is a wealthy and developed country. However, it has
a poor distribution of wealth (with 15% of the population below the poverty line) 3, and stark socioeconomic disparities amongst its population. The US houses some of the most sophisticated
medical institutions in the world, and has high standards for basic medical care delivery.
However, many of its citizens lack access to basic preventive services and care due to prohibitive
costs and lack of insurance. According to the CIA World Factbook, the physician density in the
US is almost 3 physicians per 1,000 people in the population. The overall average life
expectancy for people in the US is 78.5 years (76 years for men and 81 years for women), with
only 20% of the population under the age of 15. 4
Compared to other high-income countries, the US has an extremely high rate of violence.
The 2002 WHO World report on Violence and Health reported that between 1990 and 2000, the
rate of homicide and firearm related death was about twice as high as the rates of its economic
counterparts. The homicide rate was highest in the 15-29 year age range for both men and
women, with men over 5 times as likely to become homicide victims as women (with a rate of
26.9 male homicides, and 4.6 female homicides per 100,000 people in the population). In 2002,
the mortality rate caused by intentional injury in the US was highest in males aged 15-29 years
(44.2/ 100,000 people) and in females aged 30-44 years (8.3/100,000 people). 1 As of 2008, the estimated mortality rate of intentional injuries in the US was 1680 deaths for every 100,000
people ages 15-59 (females: 320/100,000; males 1360/100,000). 5
The US has a well defined system of categorizing health facilities by the level of trauma
care they are able to provide. The American Trauma Society and the American College of
centers: a demonstrated ability to provide Advanced Trauma Life Support (ATLS) care prior to
patient transfer to a higher level facility, and the highest level of care available at Level 1
centers: a comprehensive regional health center capable of providing total definitive care for
every aspect of trauma through rehabilitation. 6 There are also specific guidelines for prehospital care of trauma patients, or “field triage”. Field triage involved emergency medical workers
assessing severity of injury immediately on the scene, immediately initiating medical
management, and identifying which level of trauma care is necessary for the patient care. This
process has been protocolized by the ACS and Emergency Medical Services (EMS) into the
“Decision Scheme”. There is ample data that the implementation of this comprehensive field
triage and prehospital care in the US has allowed dramatic reductions in mortality for accidental
and nonaccidental injury victims of all ages. 7
Malawi
Malawi is a low income country located in Sub-Saharan Africa with a population of over
16 million. Though roughly only the size of the state of Pennsylvania, Malawiis home to the
world’s third largest lake. Malawi is a densely populated but largely a developingcountry.
Around 80 percent of the population resides in rural areas, reflecting an economy that depends
on agriculture. Gender disparities are pronounced, especially with respect to education, with a
male literacy rate of 76.1% and a female literacy rate of only 49.8%. 8 Income inequality is less prevalent in Malawi than in the US, but the proportion of the population living under the poverty
line is much greater (53% of population in Malawi compared to 15% in the US). 8 Health expenditures are much less in Malawi than in the US, financed by only 4.3% of the GDP
tiered system with few central hospitals providing tertiary care in densely populated centers, and
a greater number of small district hospitals responsible for the basic medical care of the more
rural areas. According to the CIA World Fact Book, the physician density in Malawi is only
0.019 physicians for every 1,000 people in the population. The overall average life expectancy is
52 years (51.5 years for men and 53 years for women), with almost half of the country’s
population under the age of 15 (45%). With such a young population, the major health issues
facing the country are communicable diseases (especially HIV, with an adult prevalence rate of
11%), access to adequate obstetric services, and traumatic injury. 8
Compared to other low-income African countries, Malawi has an average rate of
violence. However, detailed country-specific statistics are scarce. As of 2008, the World Health
Organization estimated mortality rate of non-self inflicted intentional injuries in Malawi was 470
deaths for every 100,000 people ages 15-59 (females: 50/100,000; males 420/100,000). 5
Mortality due to Violence in Malawi and the US
The World Health Organization’s Global Health Observatory has metrics for the deaths
due to violence in both the United States and Malawi (as of 2004). In the US, the overall
age-standardized mortality rate for age age-standardized death rates due to violence is 6.2 deaths per
100,000 people, with the male rate much higher than the female rate (9.6/100,000 and
3.9/100,000, respectively). Malawi’s overall age standardized death rates due to violence is
higher at 25.1 deaths per 100,000 people overall. The male and female discrepancy in mortality
rate is exaggerated in the Malawi data, with the male mortality rate at 42.9/100,000 and the
Violence, Traumatic Brain Injuries, and Alcohol Use
Intentional injuries due to violence are often associated with head injuries. 10 11 12 A multi-state retrospective study from 2004 that examined injury patterns in female assault victims and
non-intentional trauma (such as falls or motor vehicle collisions (MVCs)) patients found that
head and facial injury was much more common in assault victims than non-intentional trauma
patients (odds ratios of 1.4 and 4.9, respectively). 11,13Oftentimes, while the absolute incidence of TBIs is higher from non-intentional injuries (such as MVCs and falls) than from assault, the
TBIs resulting from assault are more severe. 10 14 15
Not surprisingly, the acute use of alcohol (within 6 hours of injury) has been implicated
as a strong risk factor for intentional injuries, specifically to assaults resulting in traumatic brain
injuries. 15 16 17 A study analyzing data from 1994-1998 on the epidemiology of intentional traumatic brain injuries found that victims of intentionally inflicted TBIs had almost twice the
odds of having acutely used alcohol than patients with non-intentional TBIs. 15
Is alcohol protective for traumatic brain injury outcomes?
Interestingly, many recent studies have suggested that acute alcohol use prior to traumatic
brain injury (non-specific for TBI etiology) could be protective for patient outcomes. 18 19,20Some have suggested a trend showing higher levels of blood alcohol on admission to the hospital
following TBI is associated with lower Glasgow Coma Scale (GCS) scores. 21Another has shown that adjusted mortality is significantly lower for TBI patients presenting with high blood alcohol
once all potential confounders are taken into account. 23 24 This question will discussed in depth in the adjoining systematic review.
Research Goals Aims
I. To compare intentional injury data and patient characteristics (Age, gender, Alcohol use)
between trauma databases in the United States and Malawi.
II. To specifically investigate the relationship between acute alcohol use prior to intentional
traumatic brain injury (TBI) on patient mortality within both (Lilongwe and Chapel
Hill) patient population
Research Setting
Chapel Hill, North Carolina is small city in the Southeastern United States, and is the
location of the US trauma database of interest. It is a middle-to-high income communityin a
southern setting, and is home to a Level 1 Trauma Center (UNC Hospitals), Lilongwe is the
capital city of Malawi, and is the location of the Hospital based Malawian trauma registry.
Kamuzu Central Hospital (KCH) is located in Lilongwe. It is one of the 3 central hospitals in
Malawi. A “central hospital” is the highest level of care available in the Malawian tiered health
care system. 18
METHODS Study Design
This is a retrospective, descriptive analysis of all admitted trauma patients presenting to
both the University of North Carolina Memorial Hospital (UNC) and Kamuzu Central Hospital
previously established trauma surveillance databases into which all presenting patients are
prospectively entered on admission.
Study approval
The study was approved by the Institutional Review Board of the University of North
Carolina.
Patient population
De-identified data were extracted from both registries to focus on adults (defined in this
study as age ≥ 14 years) presenting with assault-related injuries within the study period.
The two surveillance registries were independently analyzed. For the UNC trauma
registry, subjects were identified using ICD-9 E Codes (classification within the ICD-9
diagnostic coding schema that denote any “external” cause of injury). E Codes of interest fell
between 960-968, and included all forms of intentional injury due to interpersonal violence.
Variables extracted on the study cohort included age, gender, race, date of injury, date of
admission, presenting vital signs, mechanism of injury, injury severity score (ISS), diagnostic
and therapeutic procedures on admission, length of stay, and discharge diagnosis.
The KCH trauma registry was structured around a two page intake form filled out by a
clinician (see Appendix C) on all patients presenting to the emergency department with a trauma
etiology. We identified the assault population subset by stratifying Mechanisms of Injury (MOI),
Q11 in Appendix C. Assault is one of the fifteen possible MOIs on this intake form. We then
used patient disposition (Q17) to identify the assaulted patients who were admitted, while
excluding all patients discharged from the emergency department and those who expired prior to
admission. This resulted in a pooled cohort of admitted patients with assault injuries, to reflect
KCH trauma registry as compared to the UNC registry. We therefore based our analysis on
concordant variables present in both datasets. These included the following: age, gender, date of
injury, date of admission, presenting vitals (if available), mechanism of injury, location of injury,
severity of injury, as well as any information from the patient’s hospital stay.
Outcome Measures and Covariates
This is primarily a descriptive study to compare characteristics of assault between
developed and developing countries. Primary outcome measures are assault type (mechanism of
injury), injury diagnosis (location, description), and Patient outcome-(discharge destination or
mortality). We will focus on the characteristics of assault analyzing the effects of gender, alcohol
use, and age as our covariates.
Statistical analysis
Descriptive statistics, including demographics
Descriptive statistics were performed to characterize both UNC and KCH patient cohorts
based on available variables in each trauma registry. UNC data characteristics of interest were:
age, gender, race, time to presentation, if an airway intervention was performed, if the patient
underwent CPR, received blood, diagnostic tests prior to admission, if underwent surgery, injury
severity score, admitted to ICU, hospital length of stay (LOS), and patient disposition from
hospital. Abbreviated mean clinical data from intake is also presented. For UNC patients,
primary E Codes and diagnostic ICD-9 codes were compiled and the top 10 of each code
category reported.
KCH patients are described by age, gender, occupation, injury setting, alcohol use at
department(equivalent to emergency department), hospital LOS and outcome (if known).
Abbreviated mean clinical data from intake is also presented.
Univariate, Bivariate, and Regression Model statistics
Univariate statistics were used to identify variables associated with gender, alcohol use,
and timing of injuries. Bivariate statistics included Pearson’s Chi-square test for categorical
variables (including population proportions, with two tailed p values reported) and Student’s
t-test for continuous variables. Data are expressed as mean and standard deviation, or percent of
population, or odds ratios, and comparisons are deemed statistically significant if p ≤ 0.05.
Multivariate logistic regression was used to model the independent effects of gender, alcohol,
age, and country (Malawi or US) on primary outcome measures.
Limitations of Database comparisons
Mechanism of Injury (MOI) in the form of ICD-9 ECodes were readily available for
patients in the UNC cohort. The KCH trauma registry intake form did not have nearly the same
level of detail for each patient’s mechanism of injury. All patients in our cohort only had
“assault” listed as mechanism of injury. Some MOIs were able to be extrapolated based on
contextual information about the patient (weapon usage and injury type), and were assigned
accordingly when they could be determined with a high degree of certainty. However, we were
unable to assign an MOI (in the same detail as those of UNC patients) to the majority of the
patients in the Malawi cohort. Therefore, we focused on specific Injury Type (ie: contusion,
laceration, fracture, etc) in the Malawi cohort as a proxy measure of mechanism of Injury.
As the Malawi registry did not have a sufficiently detailed MOI variable for its patients,
the UNC registry did not have a specific variable for injury type to the degree of categorization
codes was performed of each patient, and Injury Type was assigned in the same manner as it was
found in the Malawi registry. ICD-9 codes, and Acute Injury Scores (AIS) were used to
determine a patient’s most severe Injury Type and Injury Location.
RESULTS
Patient Characteristics: Age
Though the age distributions of assault victims in the UNC database and in Malawi
follow the same general trend of younger victims with the greatest number in the age range of 21
to 35 years old, Malawi has a significantly greater proportion of victims in this age group than
UNC (63.1% vs 47.4%; p<0.001). UNC has a greater proportion of victims in the next older age
group (ages 35 to 50) with almost a third of the total victims falling in this age range, while
Malawians this age only account for around one-fifth of the victims (29.9% vs. 17.2%;
p<0.001). This age difference is unadjusted for the difference in life expectancies between the
US and Malawi (78.5 years vs 52 years, respectively)See Table 1 in Appendix B
Mortality
A higher proportion of patients died from assault injuries in Malawi than did those at
UNC, reaching significance to p<0.01 (t-test, unadjusted). Of the Malawi cohort, 8.7% died from
injuries sustained during assault compared to only 3.8% of UNC assault patients, with an odds
ratio of 2.4, translating into a mortality rate of 87.2 deaths/ 1,000 assaulted people in Malawi and
only 38.2 deaths/ 1,000 assaulted people at UNC. Though striking, the significance in the
difference of assault mortality rates disappeared once adjusted for patient age, gender and
Alcohol Use
Over half of the assault victims who presented to UNC who were suspected to have used
alcohol prior to assault tested positive (56.5%), but only 66% of all patients were screened for
alcohol (blood alcohol level; 191 of 291 total patients). In contrast, only 31.2% of patients
assaulted in Malawi self-reported alcohol use at the time of their assault.
Injury Location
By dataset: In comparing the two datasets, differences were seen in the incidence of specific locations of assault related injuries. In unadjusted bivariate analysis, within each location
injured, only the locations of Head or Skull, and Face returned statistically significant rates
between the Malawi and UNC patients. UNC patients have an unadjusted odds ratio of 1.83
times that of Malawi patients for sustaining head injuries in assaults (p<0.001), as compared to a
ratio of 0.22 for facial injuries (p<0.001). UNC patients continue to have a higher odds ratio for
injuries to the head than Malawi patients (1.62, p=0.008), and lower odds for facial injuries
(0.22, p<0.001) after adjustment for age, gender, and alcohol use in logistic regression modeling.
By Alcohol Use: In both datasets, alcohol use was also found to be associated with slightly higher odds of facial injury on assault (1.55, p=0.046, unadjusted), as compared to
patients who did not use alcohol. When adjusted for dataset, age, and gender, these odds actually
increased to 1.74 with p=0.022 in logistic regression model.
By Gender: There were no differences seen in any parameters of interest for the injury locations of neck, chest, or extremities in either dataset. However, not surprisingly, injuries of
the pelvic region are 4.4 times more likely to occur in females than in males in a combined
Logistic Regression Analysis for Injury Type
Logistic regression analysis was performed to determine association of each separate
Injury Type category with the covariates of interest: age (categorized as 14-20 years, 21-35
years, 35-50 years, and over 50 years), alcohol use (yes/no), and country of assault (UNC
database, or Malawi database). Contusions: Females were found to have more contusion injuries
than males across both datasets (OR=2.0,p=0.011), when adjusted in logistic regression model
for age, alcohol use, and country of assault. Malawians were also found to have many more
contusions than UNC patients adjusted for the same set of variables (OR=6.33, p<0.001).
Lacerations: Malawian assault victims had a dramatically higher rate of laceration injuries than assault victims presenting to UNC (OR=20.96, p<0.001, adjusted for age, gender, and alcohol
use), likely a function of difference in weapon use (Malawians were more likely to use knives or
machetes). Fractures: Conversely, UNC assault victims were found to have a higher rate of
fractures than Malawi assault victims (OR=9.82, p<0.001). UNC patients were also found to
have much higher rates of internal injuries than Malawi assault patients (OR=8.75, p<0.001).
Head injuries: This was the only Injury Type to have an association with any age category. Victims over age 50 (of both Malawi and UNC cohorts) had a higher rate of head injury than
their younger counterparts (OR=2.25, p=0.04). The other categories of injury type (penetrating
wound, internal organ injury, dislocations, abrasions, spine injury, etc.) were found to have no
association with the covariates examined.
Setting of Assault
Unfortunately, we do not have information readily available in the UNC trauma registry
Malawi registry. Among the Malawian assault victims, gender is strongly associated with
location of assault. For example, 74% of all assaults on women occurred at home, compared to
only 34% of assaults on males (p<0.001). This translates to women having odds of being
assaulted in the home at 5.6 times those of males (p<0.001). In contrast, men have much greater
odds of being assaulted on the street than do women (odds ratio of 4.4, p<0.001).
Alcohol and Mortality
Interestingly, in these assault patients (combined UNC and Malawi cohorts, of all injury
type), an association was seen between the use of alcohol and a decreased mortality rate. The
unadjusted odds of mortality according to alcohol use of these assault victims is only 0.36
(mortality 9.8% in sober patients, 3.8% in those positive for alcohol; p=0.003), cutting their odds
of dying to one-third that of those patients who were not under the influence of alcohol at the
time of their attack. When missing data in both cohorts is replaced with presumed non-use of
alcohol, this association still remains.
As with the mortality rates, however, this association slips just past significance (but
remains quite close: p= 0.06) once we adjust for potential influence of patient age and gender
using a logistic regression model.
Mortality of Head Injured Patients
The unadjusted overall mortality for all head injured patients (presence of AIS head score
in chart) in the UNC cohort is 7.6% (8/105), while the overall mortality of non head injured
In the Malawi cohort of patients, the unadjusted overall mortality of patients in with a
possible TBI was found to be greater (13.4% or 13/97) than those without possible TBI (8.5% or
34/442).
Alcohol and Mortality of Head-Injured Patients UNC
Mortality of patients with severe head injuries (AIS head >=3) in the UNC cohort was
2.9% for those using testing positive for alcohol and 21.4% for those testing negative (significant
to p=0.022)
People who presented with these severe head injuries and tested positive for alcohol had
an odds ratio of 0.11 (95% CI of .002 to 1.04; p= 0.022)of dying during their hospital stay as
compared to those who presented with the same severity of head injury but tested negative for
alcohol.
When all severity of head injuries are included in the analysis (any AIS head score), the
mortality is still decreased amongst people were positive for alcohol use. The mortality of people
with head injuries in the UNC cohort was 4.3% for those using testing positive for alcohol and
18.2% for those testing negative (significant to p=0.045).
Head injured people who tested positive for alcohol had an odds ratio of 0.20 (95% CI of
.019 to 1.27; p= 0.044) of mortality as compared to head injured people who tested negative for
alcohol.
Over one third of the UNC cohort were not tested in the ED for blood alcohol levels
(missing n=100; entire UNC cohort n=291). Of the all the head injured people (n= 105), 26 were
not tested for alcohol. In order to account for the large proportion of missing data, we assume in
those who were not tested for alcohol are presumed negative. With this assumption, the
association between alcohol use and decreased mortality amongst head injured people disappears
in this cohort of people. The mortality rate of all head injured people who used alcohol remains
4.3%, but the mortality rate of head injured people who did not use alcohol drops to 10.1%
(p=0.27).
When this assumption of no alcohol use in non-tested people was applied to the analysis
of people with only severe head injuries (AIS>=3), the association between decreased mortality
and alcohol use still did not reach significance. The mortality rate of severely injured people
testing positive for alcohol remained 2.9%, while the mortality of those severely injured people
was 13.3% (p=0.11)
Malawi
Because the Malawi database did not contain specific AIS head data for the assault
victims, we grouped people into likely head injury and not likely head injury categories using
available data.
Mortality of likely head injured people in the Malawi cohort who presented with acute
alcohol use was found to be 10.5% (2/19 people died). The mortality of the likely head injured
people without acute alcohol use was slightly higher, at 14.1% (11/78 died), but this association
DISCUSSION
Comparisons between UNC and Malawi
The UNC mortality rate of assault victims, though lower than that seen in the Malawi
people, is over four times than the baseline US mortality rate of 8.39 deaths/ 1,000. The assault
victim mortality of the Malawi cohort, however, is close to seven times its baseline country
mortality rate (12.39 deaths/1000 population). 8Though striking, the significance in the difference of assault mortality rates disappeared once adjusted for patient age, gender and alcohol use at
time of assault.
A significant difference between the two databases was also found in the amount of
alcohol use amongst the assault victims. The UNC cohort showed significantly higher alcohol
use than did the Malawian cohort. However, this result should be interpreted with caution. Due
to the inherent differences in data on acute alcohol use (verbal yes/no response with Malawi data,
blood alcohol levels with UNC data), there may be an element of selection bias inherent in this
comparison. By trauma center statute followed by UNC, all trauma patients should be tested for
drugs and alcohol.25 Though testing is protocol, at times these tests are not run on trauma patients transferred to UNC from other hospitals because the acuity of the presentation is lost. However,
because roughly a third to one half of the trauma patients who arrive are transferred from other
institutions after stabilization, the acute period in which BAC testing is most accurate has passed,
and testing is no longer feasible. In attempt to correct for this missing data, the unscreened
people at UNC (93 people) were analyzed again after being assigned negative blood alcohol
levels (BALs). The people with missing alcohol use status from the Malawi database were
difference in alcohol use across databases remains significant to p=0.0486 (Malawi: 31.2%,
UNC: 37.1% alcohol use).
This second analysis, with the UNC only barely attaining significance with higher
alcohol use is should still be questioned as likely not all of the untested people would have tested
negative for alcohol use, and self-report bias is inherent in the method of alcohol use status
collection in the Malawi database.
Is alcohol protective in assault victims?
Our data support the assertion that acute alcohol use decreases the risk of mortality
among assault victims. The effect in people with possible traumatic brain injuries, our specific
injury of interest, is not as clear. Many studies have shown that alcohol is protective in the
setting of TBI 19,21,22, while others argue this association disappears once confounding factors are taken into account. 23 Our analysis of UNC assault victim data with head injuries does show a significant association between alcohol and decreased mortality, but this effect disappears when
we attempted to correct for potential selection bias in those tested for alcohol use. The analysis
of the Malawi assault victim data showed no association between acute alcohol use prior to
assault and decreased mortality.
Limitations
Our main limitations are direct results of the study design, and asking a question that is
fairly unanswerable by our datasets. This is a retrospective study comparing two separate
datasets with different parameters, variables and outcomes of interest. With this design, it was
the disparity in methods by which alcohol use was determined (blood alcohol levels versus
verbal report). Many comparisons were not possible from a quantitative approach because
analogous variables in the two datasets were not collected with the same parameters, or the
selection criteria was unknown. Every effort was made to standardize variables to make
quantitative analysis possible, but in this standardization, we introduced a certain amount of bias.
Confounders were also extremely hard to control for, not only due to the retrospective
design, but also by the nature of our overly narrow question: is acute alcohol intoxication at time
of TBI associated with decreased mortality among assault victims? This is an extremely narrow
and very layered question, one that requires an incredible number of confounding factors to be
identified and controlled for prior to data collection. These retrospective datasets on their own
are far from sufficient to answer this question, and even less so if a comparison of outcomes
between the two sites is required.
CONCLUSIONS
Patient demographics and characteristics within and between both cohorts are the only
results we can report with confidence after this investigation. Interestingly, the most common
characteristics of assault victims seem to be the same between the two very different populations
(from the US and from Malawi). Both populations were very similar in respect to age, gender,
and type of injury.
Acute alcohol intoxication in assault victims was seen to be associated with slightly
reduced mortality rates amongst all patients in both cohorts, regardless of injury type. However,
also cannot conclusively determine the association between TBI outcomes in assault victims and
pre-injury alcohol use
Future Directions
In order to sufficiently investigate if alcohol has protective effects on traumatic brain
injuries in assault victims, a larger patient population is needed. This investigation could be
completed by obtaining a larger sample of assault patient data from only the UNC trauma
database through expansion of the time frame of interest (data from this study only focused on
assault people who presented within a two-year period). By increasing the population in the data
pool, while removing limitations due to the need to standardize variables of interest across two
separate data pools, the power of the study would be greatly increased to the point where this
question may actually be answerable with the dataset.
Taking a further step back, if this seemingly protective effect of alcohol were to be
supported by evidence of a large, well designed study, the public health importance of this
discovery would likely not change management of TBI patients in the future. The fact that acute
alcohol intoxication may be protective for outcomes in traumatic brain injury patients is a very
interesting concept, however, more research is necessary on the physiological mechanisms
behind this supposed protective effect to allow for any definitively altered patient treatment in
Appendix A: Comparative Statistics Table 1: UNC Assault Patient Characteristics
Characteristic N1 Mean (SD) or Percent
Age in years 34.7 (13.3)
% Male (251) 86.5
% Tested for ETOH (191) 65.9
of Tested (n=191), % Pos (108) 56.5
ofPos (n=108), Mean blood ETOH (mg/dL) 178.9 (95.4)
% Mortality (11) 3.8
% Location of Injury 2792
Face (89) 30.7
Head (75) 25.9
Polytrauma (40) 13.8
Extremities/ External Injuries (32) 11.0
Chest (19) 6.6
Abdomen (16) 5.5
% Mechanism of Injury (MOI)
Weapons (including knives, firearms, explosives) (105) 36.2 Fight, Brawl, or Abuse without weapon (103) 35.5 Struck (by blunt object or vehicle) (53) 18.3
Burned/ Electrocuted (11) 3.8
Suffocated (10) 3.5
Other violence (incl. human bite) (8) 2.8 1Freq for specific variable category, or total # patients with data
2Total patients with this data (different from n=290)
Table 2: Malawi Assault Patient Characteristics
1 Total freq for specific variable category 2 Number of patients with variable data
3 Including: dead on arrival, death in ED, and death during admission
4 Extrapolated from injury type, weapon use/type (only determined on patients reporting specific weapon use in injuries)
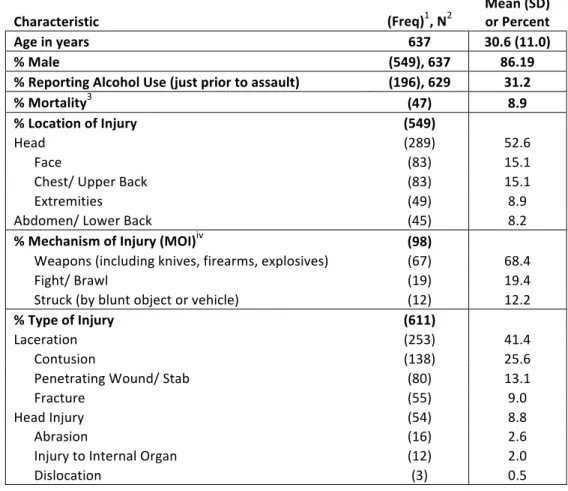
Characteristic (Freq)1, N2 Mean (SD) or Percent
Age in years 637 30.6 (11.0)
% Male (549), 637 86.19
% Reporting Alcohol Use (just prior to assault) (196), 629 31.2
% Mortality3 (47) 8.9
% Location of Injury (549)
Head (289) 52.6
Face (83) 15.1
Chest/ Upper Back (83) 15.1
Extremities (49) 8.9
Abdomen/ Lower Back (45) 8.2
% Mechanism of Injury (MOI)iv (98) Weapons (including knives, firearms, explosives) (67) 68.4
Fight/ Brawl (19) 19.4
Struck (by blunt object or vehicle) (12) 12.2
% Type of Injury (611)
Laceration (253) 41.4
Contusion (138) 25.6
Penetrating Wound/ Stab (80) 13.1
Fracture (55) 9.0
Head Injury (54) 8.8
Abrasion (16) 2.6
Injury to Internal Organ (12) 2.0
Appendix B: Descriptive Statistics
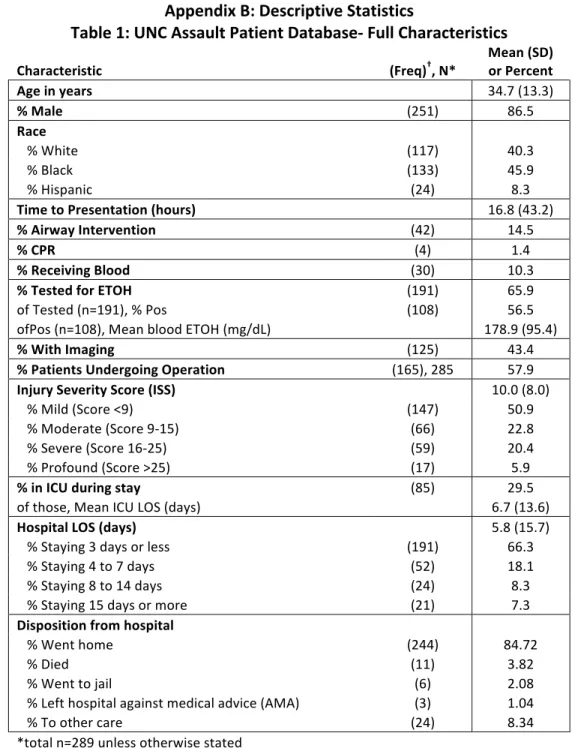
Table 1: UNC Assault Patient Database-‐ Full Characteristics
Characteristic (Freq)†, N* Mean (SD) or Percent
Age in years 34.7 (13.3)
% Male (251) 86.5
Race
% White (117) 40.3 % Black (133) 45.9
% Hispanic (24) 8.3
Time to Presentation (hours) 16.8 (43.2) % Airway Intervention (42) 14.5
% CPR (4) 1.4
% Receiving Blood (30) 10.3 % Tested for ETOH (191) 65.9
of Tested (n=191), % Pos (108) 56.5
ofPos (n=108), Mean blood ETOH (mg/dL) 178.9 (95.4) % With Imaging (125) 43.4 % Patients Undergoing Operation (165), 285 57.9 Injury Severity Score (ISS) 10.0 (8.0) % Mild (Score <9) (147) 50.9 % Moderate (Score 9-‐15) (66) 22.8 % Severe (Score 16-‐25) (59) 20.4 % Profound (Score >25) (17) 5.9 % in ICU during stay (85) 29.5
of those, Mean ICU LOS (days) 6.7 (13.6)
Hospital LOS (days) 5.8 (15.7)
% Staying 3 days or less (191) 66.3 % Staying 4 to 7 days (52) 18.1 % Staying 8 to 14 days (24) 8.3 % Staying 15 days or more (21) 7.3
Disposition from hospital
% Went home (244) 84.72 % Died (11) 3.82 % Went to jail (6) 2.08 % Left hospital against medical advice (AMA) (3) 1.04 % To other care (24) 8.34
*total n=289 unless otherwise stated
Table 2: Most Frequent Diagnoses by ICD-‐9 Three Digit Code in UNC Data (total unique diagnoses= 237)*
ICD-‐9 Three Digit
Code ICD-‐9 Diagnostic Category Meaning Freq (n=290)+ % of patients with diagnosis
802 Fracture of face bones 236 81.38
305 Nondependent abuse of drugs-‐ unspecified drug
(including tobacco) 195 67.24
873 Other open wound of head 131 45.17
920 Contusion of face, scalp, and neck except eye(s)-‐ cheek,
ear, gum, lip, mandibular joint area, nose, throat 58 20.00
801 Fracture of base of skull 51 17.59
852 Subarachnoid, subdural, and extradural hemorrhage,
following injury 33 11.38
800 Fracture of vault of skull (frontal and or parietal bone) 31 10.69 860 Traumatic pneumothorax and hemothorax 27 9.31
921 Contusion of eye and adnexa 26 8.97
910 Superficial injury of face, neck, and scalp except eye(s) 26 8.97 *each patient can have multiple diagnoses
+patients can only have one instance of a unique diagnosis code; total of 290 patients
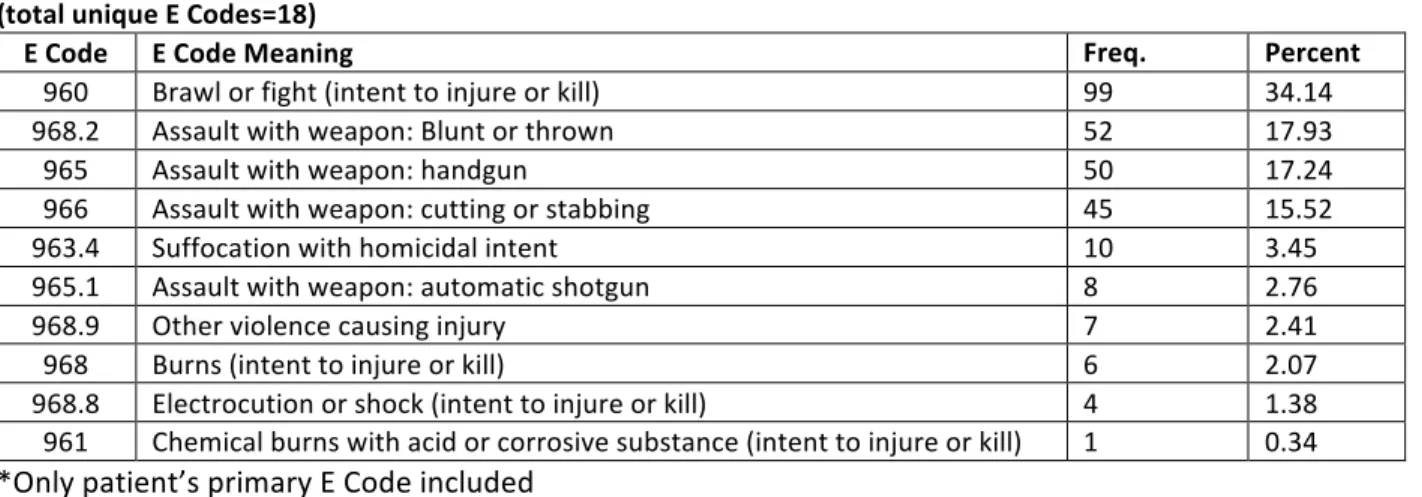
Table 3: Most Frequent Assault Mechanisms by ICD-‐9 E Code in UNC Data (total unique E Codes=18)
E Code E Code Meaning Freq.
(n=290)* Percent (%) 960 Brawl or fight (intent to injure or kill) 99 34.14
968.2 Assault with weapon: Blunt or thrown 52 17.93
965 Assault with weapon: handgun 50 17.24
966 Assault with weapon: cutting or stabbing 45 15.52
963.4 Suffocation with homicidal intent 10 3.45
965.1 Assault with weapon: automatic shotgun 8 2.76
968.9 Other violence causing injury 7 2.41
968 Burns (intent to injure or kill) 6 2.07
968.8 Electrocution or shock (intent to injure or kill) 4 1.38 961 Chemical burns with acid or corrosive substance (intent to injure or kill) 1 0.34 *Only patient’s primary E Code included
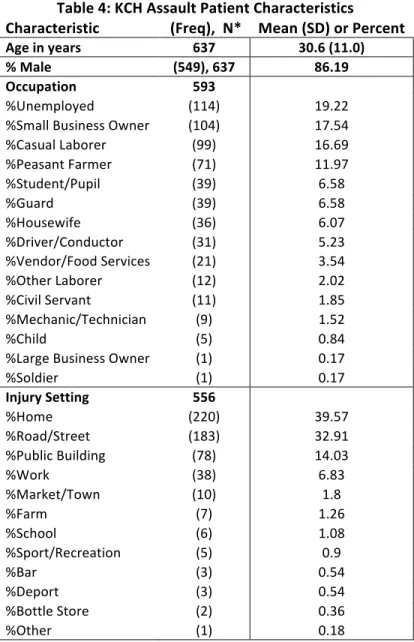
Table 4: KCH Assault Patient Characteristics
Characteristic (Freq), N* Mean (SD) or Percent
Age in years 637 30.6 (11.0) % Male (549), 637 86.19 Occupation 593
%Unemployed (114) 19.22
%Small Business Owner (104) 17.54
%Casual Laborer (99) 16.69
%Peasant Farmer (71) 11.97
%Student/Pupil (39) 6.58
%Guard (39) 6.58
%Housewife (36) 6.07
%Driver/Conductor (31) 5.23
%Vendor/Food Services (21) 3.54
%Other Laborer (12) 2.02
%Civil Servant (11) 1.85
%Mechanic/Technician (9) 1.52
%Child (5) 0.84
%Large Business Owner (1) 0.17
%Soldier (1) 0.17
Injury Setting 556
%Home (220) 39.57
%Road/Street (183) 32.91
%Public Building (78) 14.03
%Work (38) 6.83
%Market/Town (10) 1.8
%Farm (7) 1.26
%School (6) 1.08
%Sport/Recreation (5) 0.9
%Bar (3) 0.54
%Deport (3) 0.54
%Bottle Store (2) 0.36
%Other (1) 0.18
Table 5: KCH: Transportation, Outcomes, and Hospital LOS
Characteristic (Freq), N* Mean (SD) or Percent
Method of Transport 621
Private Vehicle (246) 39.61
Ambulance (174) 28.02
Police (150) 24.15
Mini Bus (23) 3.7
Company Car (12) 1.93
Walked (6) 0.97
Bicycle (4) 0.64
Other (4) 0.64
Motorcycle (2) 0.32
Outcome (of those admitted, n= 487, if known) 85
% Discharged (73) 85.88
% Died in Hospital (6) 7.06
% Abscond (6) 7.06
Length of Stay in days (if known) 80 2.9 (2.4)
% Staying 3 days or less (59) 73.75
% Staying 4 to 7 days (15) 18.75
% Staying 7 to 14 days (6) 7.5
% Staying 15 days or more (0) 0
*642 total patients from Malawi registry fit criteria, but due to incomplete records, individual variable n included.
Table 6: KCH: Most frequently used objects of assault Assault Object (n=98) (Freq.) Percent %
Knife (36) 36.73
Panga( Machete) (29) 29.59
Bottle (14) 14.29
Metal object/bar (4) 4.08
Stone(s) (4) 4.08
Axe (2) 2.04
Hoe (2) 2.04
Stick (2) 2.04
Bucket (1) 1.02
Glass (1) 1.02
Vehicle (1) 1.02
Wire (1) 1.02
Screw driver (1) 1.02
Table 7: KCH: Most Frequent Location of Injuries
Most Severe Injury Location Freq. Percent %
Head or Skull 270 43.97
Face, Ears, Eyes, Nose 83 13.52
Chest, Thoracic Spine, or Ribs 55 8.96
Abdomen or Lumbar Spine 45 7.33
Neck or Cervical Spine 19 3.09
Hand 19 3.09
Leg or Tib/Fib 17 2.77
Shoulder or Clavicle 16 2.61
Forearm or Radius/Ulna 13 2.12
Back 12 1.95
Arm or Humerus 11 1.79
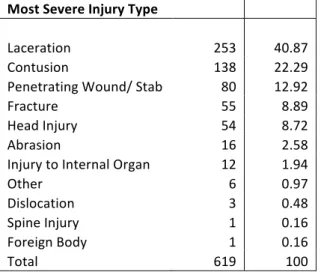
Table 8: KCH: Most Frequent Types of Assaults Injuries
Most Severe Injury Type
Freq. Percent %
Laceration 253 40.87
Contusion 138 22.29
Penetrating Wound/ Stab 80 12.92
Fracture 55 8.89
Head Injury 54 8.72
Abrasion 16 2.58
Injury to Internal Organ 12 1.94
Other 6 0.97
Dislocation 3 0.48
Spine Injury 1 0.16
Foreign Body 1 0.16
Total 619 100
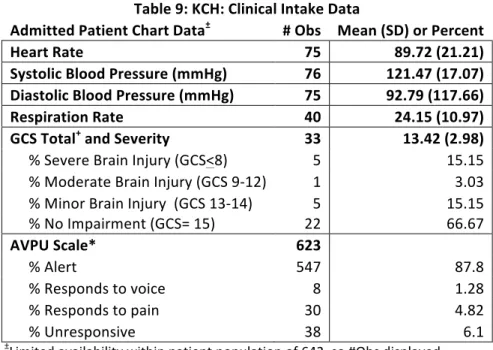
Table 9: KCH: Clinical Intake Data
Admitted Patient Chart Data± # Obs Mean (SD) or Percent
Heart Rate 75 89.72 (21.21)
Systolic Blood Pressure (mmHg) 76 121.47 (17.07)
Diastolic Blood Pressure (mmHg) 75 92.79 (117.66)
Respiration Rate 40 24.15 (10.97)
GCS Total+ and Severity 33 13.42 (2.98)
% Severe Brain Injury (GCS<8) 5 15.15 % Moderate Brain Injury (GCS 9-‐12) 1 3.03 % Minor Brain Injury (GCS 13-‐14) 5 15.15
% No Impairment (GCS= 15) 22 66.67
AVPU Scale* 623
% Alert 547 87.8
% Responds to voice 8 1.28
% Responds to pain 30 4.82
% Unresponsive 38 6.1
±Limited availability within patient population of 642, so #Obs displayed + Glasgow Coma Scale (GCS): scale to accurately assess neurological state; total derived from 3 scored categories: Eye, Verbal and Motor response to stimuli *AVPU:simplification of Glasgow Coma Scale (GCS) to rapidly assess mental status; assigned A for alert on arrival, V for responsive to voice, P for only responsive to pain, and U for unresponsive to all stimuli
Appendix C: KCH Trauma Intake Form
Appendix D: References
1. Krug EEG. The world report on violence and health. The Lancet (British edition).
2002;360(9339):1083-1088. Accessed 7/11/2012 1:04:17 PM.
2. Mercy JA, Krug EG, Dahlberg LL, Zwi AB. Violence and health: The united states in
a global perspective. Journal Information. 2003;93(2).
3. CIA world factbook 2011.
https://www.cia.gov/library/publications/the-world-factbook/rankorder/2091rank.html. Updated 2011. Accessed 08/01, 2011.
4. Danaei G, Ding EL, Mozaffarian D, et al. The preventable causes of death in the united
states: Comparative risk assessment of dietary, lifestyle, and metabolic risk factors. PLoS
Med. 2009;6(4):e1000058. doi: 10.1371/journal.pmed.1000058.
5. Disease and injury country estimates, 2008: By sex by country.
http://apps.who.int/gho/data/node.main.1005. Accessed 3/17/2013, 2013.
6. American trauma society: Trauma resources » trauma categorization explained.
http://www.amtrauma.org/resources/trauma-categorization/index.aspx. Accessed
3/17/2013, 2013.
7. Guidelines for field triage of injured Patients Recommendations of the national
expert panel on field triage .
http://www.cdc.gov/mmwr/preview/mmwrhtml/rr5801a1.htm. Accessed 3/17/2013,
8. CIA. The CIA world factbook.
https://www.cia.gov/library/publications/the-world-factbook/. Updated 2012.
9. Age-standardized death rates: Violence by country.
http://apps.who.int/gho/data/node.main.A1089?showonly=GISAH. Accessed 3/17/2013,
2013.
10. Bruns JJ. The epidemiology of traumatic brain injury: A review EPIDEMIOLOGY
OF TRAUMATIC BRAIN INJURY. Epilepsia (Copenhagen). 2003;44(s10):2-10.
Accessed 11/9/2012 2:00:50 AM.
11. Luna G. Intentional injury treated in community hospitals. The American journal of
surgery. 2001;181(5):463. Accessed 11/9/2012 1:25:35 AM.
12. Scott KD, Schafer J, Greenfield TK. The role of alcohol in physical assault
perpetration and victimization. J Stud Alcohol. 1999;60(4):528-536. Accessed 7/14/2012
3:21:00 PM.
13. Crandall ML, Nathens AB, Rivara FP. Injury patterns among female trauma patients:
Recognizing intentional injury. The Journal of Trauma and Acute Care Surgery.
2004;57(1):42-45. Accessed 11/9/2012 1:27:58 AM.
14. Sosin DDM. Trends in death associated with traumatic brain injury, 1979 through
1992: Success and failure. JAMA : the journal of the American Medical Association.
15. Wagner AAK. Intentional traumatic brain injury: Epidemiology, risk factors, and
associations with injury severity and mortality. The Journal of Trauma: Injury, Infection,
and Critical Care. 2000;49(3):404-410. Accessed 11/9/2012 2:29:44 AM.
16. Vinson DC, Borges G, Cherpitel CJ. The risk of intentional injury with acute and
chronic alcohol exposures: A case-control and case-crossover study. Journal of Studies
on Alcohol and Drugs. 2003;64(3):350. Accessed 11/9/2012 2:23:46 AM.
17. Honkanen R, Smith G. Impact of acute alcohol intoxication on patterns of non-fatal
trauma: Cause-specific analysis of head injury effect. Injury. 1991;22(3):225-229.
Accessed 11/9/2012 2:20:27 AM. doi: 10.1016/0020-1383(91)90047-I.
18. Opreanu RC, Kuhn D, Basson MD. Influence of alcohol on mortality in traumatic
brain injury. J Am Coll Surg. 2010;210(6):997-1007. Accessed 10/10/2012 4:34:12 PM.
doi: 10.1016/j.jamcollsurg.2010.01.036.
19. Berry C, Salim A, Alban R, Mirocha J, Margulies DR, Ley EJ. Serum ethanol levels
in patients with moderate to severe traumatic brain injury influence outcomes: A
surprising finding. Am Surg. 2010;76(10):1067-1070. Accessed 10/28/2012 7:17:03 PM.
20. Salim A, Teixeira P, Ley EJ, DuBose J, Inaba K, Margulies DR. Serum ethanol
levels: Predictor of survival after severe traumatic brain injury. J Trauma.
2009;67(4):697-703. Accessed 10/10/2012 2:53:44 PM. doi:
21. Berry C, Ley EJ, Margulies DR, et al. Correlating the blood alcohol concentration
with outcome after traumatic brain injury: Too much is not a bad thing. Am Surg.
2011;77(10):1416-1419. Accessed 10/28/2012 7:24:56 PM.
22. Talving P, Plurad D, Barmparas G, et al. Isolated severe traumatic brain injuries:
Association of blood alcohol levels with the severity of injuries and outcomes. The
Journal of Trauma and Acute Care Surgery. 2010;68(2):357. Accessed 10/28/2012 7:19:47 PM.
23. Chen CM, Yi HY, Yoon YH, Dong C. Alcohol use at time of injury and survival
following traumatic brain injury: Results from the national trauma data bank. Journal of
Studies on Alcohol and Drugs. 2012;73(4):531. Accessed 10/28/2012 7:12:25 PM.
24. Hadjizacharia P, O’Keeffe T, Plurad D, et al. Alcohol exposure and outcomes in
trauma patients. European Journal of Trauma and Emergency Surgery.
2011;37(2):169-175. Accessed 10/28/2012 7:18:41 PM.
25. Alcohol screening and brief intervention (SBI) for trauma patients - sbirtguide.pdf.
http://www.facs.org/trauma/publications/sbirtguide.pdf. Accessed 3/17/2013, 2013.
1 Total freq for specific variable category 2 Number of patients with variable data
3 Including: dead on arrival, death in ED, and death during admission
Appendix D: Systematic Review – Effect of Alcohol on Mortality in Patients with Traumatic Brain Injury
Background
Traumatic brain injuries (TBIs) account for approximately one third of all injury related
deaths in the United States. 1 The leading cause of TBIs is falls, with the elderly and the young as
the most susceptible populations. Motor vehicle accidents follow closely as the second most common cause for TBIs in the US, followed by “struck by” accidents, and then assault injury. From 1997-2007, firearm-related events (34.8%), MVAs (31.4%), and falls (16.7%) were the
leading causes of TBI-related death in the US. 1
Traumatic brain injuries can have extremely poor prognoses for the patient while
consuming many resources from hospitals and health care providers acutely following injury and in the long term. Disability from TBIs can lead to reduced quality of life from loss of physical
and or mental functions, and can prevent patients from leading independent lives. 1 Costs of TBIs
in the US, both direct medical and indirect costs (such as loss of productivity and independent
function), have been estimated to be as high as 76.5 billion dollars as of the year 2000. 2
Alcohol has always played a role in trauma. It has been shown to worsen the morbidity
and mortality of trauma patients despite the mechanism and nature of injury. 3 Thirty-five to 81%
of TBI patients in recent studies have been reported to be intoxicated with alcohol when injured.
4
Research Question
Alcohol intoxication is often involved in situations where traumatic brain injuries occur. There has evidence that suggests there may be a protective effect of acute alcohol intoxication in
traumatic brain injury patients. 4 I want to explore the existing data on this question, specifically
Systematic literature review: Alcohol use at time of traumatic brain injury (TBI): is it protective?
Search Strategy:
For this review, I queried the PUBMED database with the following two searches:
1. ("ethanol"[MeSH Terms] OR "alcohols"[MeSH Terms] AND ("brain injuries"[MeSH
Terms] OR "traumatic brain injury"[All Fields]) AND outcomes[All Fields]) AND ("2002/10/14"[PDAT] : "2012/10/10"[PDAT] AND "humans"[MeSH Terms] AND English[lang])
Returned 28 results
2. (("ethanol"[MeSH Terms] OR "alcohol" and intoxication AND ("brain injuries"[MeSH
Terms] AND ("2002/10/14"[PDat] : "2012/10/10"[PDat] AND "humans"[MeSH Terms] AND English[lang])
Returned 35 results
I restricted my search to peer reviewed articles in English language journals from the past 10 years. Articles were included if the patient population included adults ages 14 and older of both genders. I attempted to limit my search to articles specifically addressing the effects of alcohol on the mortality of patients with traumatic brain injuries, but I did include some papers that focused on a variety of injuries, as long as traumatic brain injuries were included.
Of note, my search returned a review article, which had collected and evaluated articles
published asking this very question in January of 2010 4. Due to the comprehensive nature of this
article, I further restricted my inquiries to only articles published after January 2010, so as to not include articles referenced by or analyzed in the Opreanu paper. I would like this to serve as a brief review of the clinical studies discussed in the Opreanu review article and an update of the most recent findings on the question of alcohol’s influence on mortality in TBI patients.
4 articles specifically looking at alcohol and the mortality outcomes in TBI patients (in chronological order of publishing date)
1. Berry, C., Salim, A., Alban, R., Mirocha, J., Margulies, D. R., & Ley, E. J. (2010). Serum
ethanol levels in patients with moderate to severe traumatic brain injury influence
outcomes: A surprising finding. The American Surgeon, 76(10), 1067-1070.
2. Talving, P., Plurad, D., Barmparas, G., DuBose, J., Inaba, K., Lam, L., . . . Demetriades,
D. (2010). Isolated severe traumatic brain injuries: Association of blood alcohol levels
with the severity of injuries and outcomes. The Journal of Trauma and Acute Care
Surgery, 68(2), 357.
3. Berry, C., Ley, E. J., Margulies, D. R., Mirocha, J., Bukur, M., Malinoski, D., & Salim,
A. (2011). Correlating the blood alcohol concentration with outcome after traumatic brain
injury: Too much is not a bad thing. The American Surgeon, 77(10), 1416-1419.
4. Chen, C. M., Yi, H. Y., Yoon, Y. H., & Dong, C. (2012). Alcohol use at time of injury
and survival following traumatic brain injury: Results from the national trauma data
bank. Journal of Studies on Alcohol and Drugs, 73(4), 531.
Opreanu Review article summary (Oct 2010): 4
Opreanu and colleagues reviewed a wide variety of clinical studies, including those that look at the mortality of intoxicated patients with all varieties of traumatic injuries. Citing
multiple articles for and against the theory of the protective effects of intoxication on mortality in
trauma patients 5-10 they suggest that no conclusion can be drawn on this broader question with
the present state of the literature. 4 Opreanu et al, emphasize that though reports exist of both
increased and decreased mortality of intoxicated trauma patients, there are also many that find no statistically significant mortality differences between intoxicated and non-intoxicated trauma
patients. 4
However, upon narrowing the scope of their review to reports of patient mortality in intoxicated patients with TBIs (with or without additional traumatic injuries), Opreanu et al concluded that overall, the clinical studies they reviewed “tend to suggest a protective effect of pretraumatic alcohol intoxication on TBI outcomes,” though the studies admittedly have
Interestingly, articles cited that support this suggested a protective effect of intoxication
that varied with alcohol dose. 7,9,10 For example, Tien et al divided TBI patients into three groups
based on blood alcohol content at admission: none, low to moderate levels (<230mg/dL) , and high levels (>=230 mg/dL). They found that the TBI patients with low to moderate levels of alcohol had significantly lower mortality rates than the no alcohol group, while the group with
high levels had significantly worse mortality rates than the no alcohol reference group. 9
The other TBI specific articles reviewed either reported lower mortality rates for the
alcohol positive groups compared to no alcohol patients, 5,6,8 or a trend in the decreased mortality
direction without reaching significance. 7,10
Limitations of the clinical studies (Opreanu, et al): 4
The major limitations of these reviewed studies reported by Opreanu and colleagues can be divided into a few major categories: the unavoidable limitations inherent in retrospective clinical study designs, the definition and categorization of study groups, and specific statistical critiques. I will briefly recount examples of the last two, as they are more specific to this research question.
Opreanu and colleagues mention the discrepancies between the reviewed studies when defining the study groups. Some of the reports categorized patients according to presence or
absence of blood alcohol, 5,6,8 as others further separated groups by level of blood alcohol. 7,9,10
A major problem with these two study designs was that often not all patients had blood alcohol levels measured upon admission, creating a selection bias.
A second limitation mentioned was the lack of definition between acute alcohol
intoxication and acute intoxication in a chronic alcoholic patient. Opreanu and colleagues raise the important point that chronic alcoholism is associated with immunosuppression, increased risk of infection. As post-trauma in-hospital infections are major risk factors for in hospital mortality,
this distinction between acute and chronic alcohol use could skew the mortality results. 4
One specific statistical critique of these studies is the multiple imputation technique that some authors applied to their data to correct for missing data on patients who were not tested for blood alcohol levels on admission. Most authors, Opreanu and colleagues noted, simply
selection bias by including the untested patients, however, these authors had an indefinite result. Opreanu reports that the lack of effect in some of these investigations could have been due to
their statistical methods. 4
Review of New Studies:
Since the publication of the Opreanu article in October of 2010, new studies have been published examining the effects of acute alcohol intoxication during traumatic brain injury on in-hospital mortality. Details of study design and results of the four highlighted studies are
presented in Table 1.
Talving et al, 2010 11
Interestingly, Talving and colleagues included data from a trial period where every patient evaluated in the emergency department (ED) was screened with a blood alcohol test, thereby allowing them to avoid the selection bias inherent in the studies mentioned in Opreanu’s review article and the more current ones I will discuss. Talving and colleagues also only included patients that presented with isolated severe traumatic brain injuries, allowing for a priori control of many of the confounding co-morbidities present in TBI subjects of other studies. These stringent criteria, of course, severely limited their pool of potential subjects (92.4 % of otherwise eligible patients were excluded), but the data from the remaining 815 patients proved fruitful. They split patients into two cohorts: No/Low ETOH on admission (BAL <0.08 mg/dL) and High ETOH (BAL >=0.08 mg/dL). In their analysis (adjusted for remaining confounding factors in logistic regression analysis), patients in the high alcohol cohort were found to have significantly lower adjusted mortality rates than those in the No/Low alcohol group (8.9% vs. 17.1%; adjusted odds ratio: 0.60, 95% confidence interval: 0.37– 0.96, p = 0.037). Their subgroup analysis of those with Injury Severity Score> 15 showed the relative risk for mortality in the high alcohol group was significantly lower than in the No/Low alcohol group (Relative Risk for High ETOH to No/ Low ETOH= 0.56, 95% confidence interval: 0.38–0.82, p= 0.002). The same trend was seen in the subgroup analysis of patients whose ISS was >25, however this association did not
reach significance. 11
methods of all studies I will discuss. They did not, however, explain their rational for combining the “low alcohol” patients with the “no alcohol” patients into the same reference category.
Berry et al, 2010 12
Berry and colleagues, the same research team that wrote multiple papers 5,6 included in
the Opreanu systematic review,5,6 published two additional studies on this question since the Oct
2010 review. 12,13 The first, in 2010, aimed to investigate this possible neuroprotective effect of
alcohol intoxication on patients with moderate to severe TBIs using the Los Angeles County Trauma database. The results of the logistic regression analysis adjusted for confounding factors also showed a protective effect of alcohol intoxication on patients with moderate to severe TBIs as compared to those TBI patients who tested negative for alcohol (adjusted OR 0.82, 95% CI:
0.69–0.99, P 5 0.035). 12
Limitations:
However, there are drawbacks to this study, especially when juxtaposed with the careful
design of Talving, et al, 11 as described above. They did not include any TBI patients who were
not tested for blood alcohol content on admission, effectively eliminating over half of their potential study population, introducing selection bias. Also, they did not use any method to attempt to normalize other characteristics between groups. The alcohol positive and alcohol negative groups were significantly different for every demographic, age, and outcome variable. This could introduce significant confounding bias. Also, their attempts to manage the effects of these confounding factors were rarely discussed and unclear. All these factors taken in sum cast doubt on the validity of their results showing protective effects of alcohol in TBI patients.
Berry et al, 2011 13