BARRIERS TO CARE AND PROVIDER INVOLVEMENT IN WEIGHT MANAGEMENT FOR YOUTH WITH TYPE 1 DIABETES
by Madison Watts
Honors Essay Department of Nutrition
University of North Carolina 2017
Approved:
________________________ Advisor
TABLE OF CONTENTS
Abstract...1
Introduction...2
Specific Aims...8
Methods...9
Results...14
Discussion...24
Conclusion...31
ABSTRACT
T1D-specific weight-related recommendations to overcome the inherent antagonism between T1D and weight management.
INTRODUCTION
Type 1 Diabetes Mellitus (T1D) is an autoimmune disorder that results in the destruction of insulin-producing pancreatic beta cells.1 In the United States more than 1 in 650 youth have T1D,2 and its incidence continues to increase by 1.8% annually.3 T1D can cause severe acute complications including hyperglycemia, hypoglycemia, and diabetic ketoacidosis.4 Patients with chronically uncontrolled diabetes incur
macrovascular, microvascular and neurological complications that increase their risk for serious conditions such as neuropathy, retinopathy, nephropathy, and cardiovascular disease.5 To avoid these complications, which cause the majority of morbidity and mortality, patients are tasked with a self-care regimen that involves frequent blood glucose monitoring, insulin administration, meal planning and medical check-ups to screen for complications.4
pumps. These technologies increased the ease with which one could monitor and treat their diabetes using IIT.
Effect of T1D and Weight Status on Cardiovascular Disease Risk
Despite the many benefits of IIT, the DCCT found inappropriate weight gain as a primary side effect.Patients using IIT faced a 33% increase in risk of being overweight as compared to those using conventional therapy.5 Furthermore, the follow up-study to the DCCT, called the Epidemiology of Diabetes Interventions and Complications (EDIC) study, found that increased body mass index (BMI) in youth with T1D was associated with an increased risk for cardiovascular disease and atherosclerosis.8,9 This increase in CVD risk builds upon the baseline risk for youth with T1D, which is already elevated as much as 10-fold compared to youth without diabetes.10-12 However, weight reduction by as little as 7-10% of body weight has been shown to improve CVD risk factors such as triglyceride levels, HDL-cholesterol levels, blood pressure, hypertensive profiles, and insulin resistance.13,14
Prevalence of Overweight and Obesity in Youth with T1D
or more as within US youth in general, according to two large cohort studies.17,18 The SEARCH for Diabetes in Youth Study containing nearly 4,000 US youth with diabetes and 8,000 US youth without diabetes found that the prevalence of overweight is
significantly higher in T1D youth than in the general population (22.1% vs. 16.1%) (P < .05) and the prevalence of obesity has begun to mirror that of the general population (12.6% vs. 16.9%).17 Females and minorities with T1D tended to have a higher
prevalence of overweight and obesity. In the age group 12-19, Non-Hispanic White males had the lowest combined prevalence of overweight and obesity (28.8%), while African-American females had the highest prevalence (55.0%), followed by Hispanic males and females (47.8% and 48.7% respectively).17 The Type 1 Diabetes Exchange (T1DX) registry containing 11,435 U.S. youth echoed these findings. In this population, the prevalence of overweight was 22-24% and the prevalence of obesity was 14-15%, with the range demarking the difference between CDC and WHO standards for defining overweight and obesity.18 Additionally, median BMI values for this population of T1D youth were found to be higher than national (CDC) and international (WHO) reference values for youth aged 2-18. The T1DX study also looked at markers of cardiovascular disease risk and found that T1D youth who were overweight or obese had 3.5 times the odds of having either hypertension or dyslipidemia.19
Challenges for Weight Management in the Context of T1D
factors that make weight loss uniquely difficult in this population. T1D self-care is
extremely complex; in order to achieve optimal glycemic control, youth with T1D engage in a number of daily self-regulation practices including blood glucose monitoring,
into account the special circumstances that define T1D, there is a potential for dual outcome optimization of weight and glycemic control.
Role of Provider in Weight Management Care for T1D Youth
While T1D does involve a large amount of self-regulation, collaboration with health care providers is critical to disease management.20 However, a study of 760 youth from the SEARCH cohort found that barriers to care are common in youth with T1D, as they were reported by 81.7% of families.22 Getting need information from providers (48.7%) was the most frequently reported barrier, followed by cost (47.5%) and provider communication (43%).22 For the purposes of the study, communication entailed providers always listening carefully and respectfully to their patients, explaining things in a way they could understand, and spending enough time with them. Getting needed information referred to providers making it easy for patients to ask questions and giving specific, helpful answers. Efficient provider-patient communication has been shown in numerous studies to correlate directly with positive health outcomes in a variety of disease
contexts,23,24 with improved adherence to therapy in pediatric cases,25 and specifically with improved glycemic control in patients with T1D.26 One such study found that the quality of provider-patient communication was responsible for 21% of the variance in self-care measures such as adherence to taking medications, following diet
While barriers to care have been shown for T1D care as a whole, little is known about the patient-perceived barriers specific to weight management care in T1D youth. For the goal of developing evidence-based recommendations for weight management in this population, a starting point is ascertaining barriers to care based on potential
interactions between T1D self-care and weight management self-care as well as barriers related to provider involvement in weight management. A greater understanding of the challenges these youth face and the needs that result will help to aid providers in
SPECIFIC AIMS
AIM 1:To examine provider communication and information flow with regards to
weight loss and weight management in youth with T1D using questionnaire
responses
1a: Communication and information flow as barriers to weight management in
youth with T1D: I hypothesize less effective provider communication and disrupted information flow as barriers to weight management in youth with T1D that are overweight or obese.
1b: Barriers, HbA1c and weight status: I hypothesize that those with provider communication as a barrier will have higher HbA1c and weight status (as measured by BMI) than those without this barrier.
AIM 2:To receive qualitative patient feedback on provider’s involvement in weight
management, both actual and desired, in youth with T1D using themes of focus
group discussion
METHODS
TASTE (Teens’ Attitudes Surrounding Type 1 Diabetes and Eating) is a pilot study aimed at gathering youth’s perceptions of weight loss and maintenance within the context of Type 1 Diabetes (T1D) care. The study involved three components: a questionnaire, a focus group, and a taste test. Questionnaires were used to collect demographic, lifestyle and clinical variables, and also included items to assess disordered eating in diabetes, ingestive behavior, food security, physical activity and barriers to care as it pertains to weight loss. The focus group included several topics related to eating behavior, weight loss attempts, weight management and diabetes care. The taste test was used to provide data on hedonic eating behavior. Data from both the questionnaire and focus groups were used to assess youth’s perceptions of both actual and desired provider involvement in weight management for youth with T1D.
Participant Inclusion Criteria and Recruitment
study details and logistics. Upon confirmation of intent to participate, participants were given an assigned focus group date.
Data Collection
Questionnaire
Upon recruitment into the study, participants were emailed a link to a secure interface with a multi-item questionnaire. Participants were encouraged to complete the
questionnaire online before coming to their assigned focus group, but those who had not completed the questionnaire at that time were given a paper version to fill out at the beginning or end of their focus group visit. All data were input into Redcap software. Demographic and clinical variables were collected at the beginning of the questionnaire, followed by several specialized items. The categories used for race/ethnicity were
Hispanic (regardless of race), non-Hispanic white, non-Hispanic black, American Indian, Asian/Pacific Islander, and multiracial (regardless of individual races within).28
Management Care” survey was derived using contextual care, getting information and communication items from the Consumer Assessment of Healthcare Providers and Systems Survey (CAHPS 3.0)35 as in the SEARCH population of youth with T1D.22 Participants were asked to consider the items with regards to weight management specifically. The adult format of the survey was used because it was designed for individuals filling out the survey about themselves and their experiences, which was the case with our adolescent-aged cohort. However, question content was identical to the child version aside from pronouns.
Focus Group
Focus groups were designed to ideally contain 4-8 youth and to take between an hour and an hour and a half. Groups were divided by weight status and gender to alleviate
sensitivities regarding the discussion of weight. Focus groups were conducted at both sites, UNC and BDC. The study team had the goal of six focus groups per site, with four groups (two all-female, two all-male) consisting of overweight/obese participants with BMI ≥ 25 and two groups (one all-female, one all-male) consisting of normal weight participants with BMI < 25.
weight management, how weight management care could be improved, and interest in participation in future studies. The following two questions were specifically included to assess actual and desired provider involvement in weight management care in youth with T1D. However, discussion about provider involvement stemming from other questions or facilitator follow-up was also considered important for data analysis.
Figure 1 Focus group questions directly related to provider involvement in weight management.
Upon completion of the questionnaire, focus group and taste test, participants were compensated with a $50 visa gift card.
Data Analysis
Questionnaire
Questions from the “Barriers to Weight Management Care” survey were divided by barrier category, and each question was scored as barrier or no barrier based on the response indicated (Figure 2). For the contextual care questions, a barrier was indicated by a “no” response and no barrier was indicated by a “yes” response. For communication and getting information a barrier was indicated by anything other than “always” which included the options “often,” “sometimes,” “seldom,” and “never.” This relatively high-cut off scoring method was adopted in the SEARCH study due to research supporting ceiling effects in provider satisfaction surveys conducted with patients.36
What could doctors and dieticians do to make weight loss easier?
Barriers to Care Items “No Barrier” Response With regards to weight management…
Contextual Care Does this provider talk with you about how you are feeling, growing or behaving?
Yes
Does this provider understand how your medical,
behavioral or other health conditions affect your day-to-day life?
Yes
Does this provider understand how your medical,
behavioral or other health conditions affect your family's day-to-day life?
Yes
Communication How often does this provider listen carefully to you? Always How often does this provider explain things in a way you
can understand?
Always
How often does this provider show respect for what you had to say?
Always
How often does this provider spend enough time with you?
Always
Getting Information
How often does this provider make it easy for you to discuss your questions or concerns?
Always
How often did you have your questions answered by this provider?
Always
How often did you get the specific information you needed from this provider?
Always
Figure 2 Barriers to care items selected from the Consumer Assessment of Healthcare Providers and Systems (CAHPS 3.0) and barrier response as modeled in SEARCH population of youth with T1D.8 Participants were asked to consider their primary provider and the weight management care they’ve received over the last 12 months.
done to show mean difference in HbA1c and BMI across low barrier (0-1 barriers) and high barrier (2+ barriers) groups. All data analysis was completed in SAS and EpiInfo.
Focus Group
Focus group discussions were digitally recorded with participants’ consent and parental assent and transcribed by a member of the study team. Because the study is early formative work, themes were not pre-coded but rather inductively gathered from the focus group transcripts using standard inductive analysis approach.
RESULTS
Recruitment and Demographics
A total of 34 youth with T1D were included in the study. Although the study was designed to have six focus groups per site, only four were held at each because of less than targeted recruitment and indications from the first few focus groups that themes did not vary by weight status. Recruitment outcomes are shown in Table 1. The most
common reasons for declining at both sites were that participants were unavailable at the time of their assigned focus group, had transportation issues or were generally
disinterested in the study.
UNC Site BDC Site
N Eligible 164 231
N Contacted (% of Eligible) 93 (56.7%) 79 (34.2%)
N Expressed Intent to Participate (% of Contacted)
22 (23.7%) 21 (26.6%)
All 34 youth participated in a focus group and completed the questionnaire. Participants had an average age of 14.4 (±1.7) , an average BMI of 26.1 (±4.7), an average HbA1c of 8.9 (±1.8) and were majority white, non-Hispanic, pump users (Table 2).
Table 2 Demographic and clinical characteristics of TASTE participants. *Includes African-American, American Indian and Multiracial
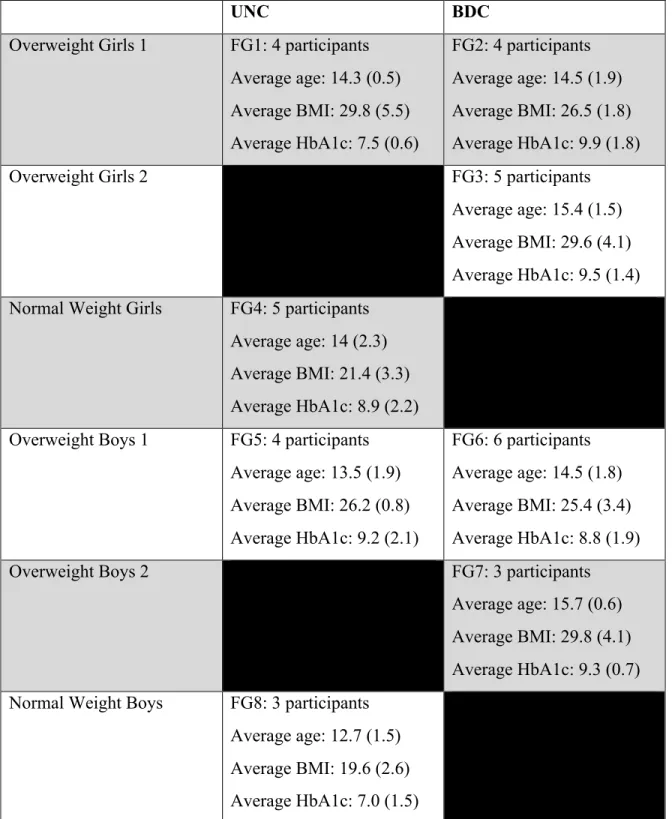
The UNC site hosted two all-female groups (one overweight, one normal weight) and two male groups (one overweight, one normal weight). The BDC site hosted two all-female overweight groups and two all-male overweight groups. Each of the eight focus groups contained 3-6 individuals (average = 4.25), and lasted between 50 mins and 75 mins (average = 62.5 mins). Individual group composition by site is shown in Table 3.
All UNC BDC
N N=34 n=16 n=18
Demographic Characteristics
Gender 16M, 18F 7M, 9F 9M, 9F
Age (SD) 14.4 (1.7) 13.7 (1.7) 14.9 (1.6)
BMI (SD) 26.1 (4.7) 24.7 (4.3) 27.5 (3.7)
N White, Non-Hispanic (%) 20 (58.8%) 11 (68.8%) 9 (50.0%) N Non-White, Non-Hispanic (%)* 8 (23.5%) 5 (31.2%) 3 (16.7%)
N Hispanic (%) 6 (17.6%) 0 (0.0%) 6 (33.3%)
Clinical Characteristics
HbA1c (%) (SD) 8.9 (1.8) 8.5 (2.0) 9.3 (1.5)
UNC BDC Overweight Girls 1 FG1: 4 participants
Average age: 14.3 (0.5) Average BMI: 29.8 (5.5) Average HbA1c: 7.5 (0.6)
FG2: 4 participants Average age: 14.5 (1.9) Average BMI: 26.5 (1.8) Average HbA1c: 9.9 (1.8)
Overweight Girls 2 FG3: 5 participants
Average age: 15.4 (1.5) Average BMI: 29.6 (4.1) Average HbA1c: 9.5 (1.4) Normal Weight Girls FG4: 5 participants
Average age: 14 (2.3) Average BMI: 21.4 (3.3) Average HbA1c: 8.9 (2.2) Overweight Boys 1 FG5: 4 participants
Average age: 13.5 (1.9) Average BMI: 26.2 (0.8) Average HbA1c: 9.2 (2.1)
FG6: 6 participants Average age: 14.5 (1.8) Average BMI: 25.4 (3.4) Average HbA1c: 8.8 (1.9)
Overweight Boys 2 FG7: 3 participants
Average age: 15.7 (0.6) Average BMI: 29.8 (4.1) Average HbA1c: 9.3 (0.7) Normal Weight Boys FG8: 3 participants
Average age: 12.7 (1.5) Average BMI: 19.6 (2.6) Average HbA1c: 7.0 (1.5)
Questionnaire Data
Prevalence of Weight Loss Attempts
Out of 34 participants, 55.9% reported that they had attempted weight loss at some point, while 38.2% reported that they were currently trying to lose weight (Table 4).
Statistically significant findings include that more females were currently trying to lose weight than males, and that overweight youth chose to eat low fat foods for weight loss purposes more often than their normal weight peers.
All (N=34) Overweight (n=26) Normal Weight (n=8) Female (n=18) Male (n=16)
Weight loss attempts: Have you ever tried to lose weight?
19 (55.9%) 16 (65.1%) 3 (37.5%) 10 (55.6%) 9 (56.3%)
Are you currently trying to lose weight?
13 (38.2%) 11 (42.3%) 2 (25.0%) 10 (55.6%) + 3 (18.8%)
Actions included in attempts to lose weight:
Dieted 10 (29.4%) 8 (30.7%) 2 (25.0%) 5 (27.8%) 5 (31.3%) Exercised 22 (64.7%) 19 (73.1%) 3 (37.5%) 13 (72.2%) 9 (56.3%) Eaten less food or
calories
13 (38.2%) 11 (42.3%) 2 (25.0%) 8 (44.4%) 5 (31.3%)
Eaten low fat foods 10 (29.4%) 10 (29.4%) * 0 (0.0%) 4 (22.2%) 6 (37.5%) Eaten low carb foods 9 (26.5%) 7 (26.9%) 2 (25.0%) 4 (22.2%) 5 (31.3%) Drank less SSBs 18 (52.9%) 13 (50.0%) 5 (62.5%) 11 (61.1%) 7 (43.8%) Table 4Weight loss attempts, past and current, stratified by gender and weight status. BMI
cutoff = 25. Significance level a= 0.05 used for statistical determinations.
*statistically significant for overweight as compared to normal weight
Barriers to Weight Management Care
Over 70% of participants reported at least one barrier to care. Communication was the most common barrier type, followed closely by getting information. Barriers to contextual care were not as common in this population. Barrier frequency (number of individuals and percentage of the sample) was stratified by select demographic and clinical variables (Table 5).
N Any
Barrier
Contextual Care
Communication Getting Information Overall N=34 25 (73.5%) 6 (17.6%) 22 (64.7%) 21 (61.7%) Location
BDC n=18 14 (77.8%) 5 (27.8%) 11 (61.1%) 11 (61.1%) UNC n=16 11 (68.8%) 1 (6.3%) 11 (68.8%) 10 (62.5%) Sex
Male n=16 9 (56.3%) 1 (6.3%) 7 (43.8%) 7 (43.8%)
Female n=18 16 (88.9%) 5 (27.8%) 15 (83.3%) 14 (77.8%) Race/ethnicity
Non-Hispanic White
n=20 13 (65.0%) 4 (20.0%) 10 (50.0%) 11 (55.0%)
All Other n=14 12 (85.7%) 2 (14.3%) 12 (85.7%) 10 (71.4%) HbA1c
<9.0% n=19 11 (57.9%) 3 (15.8%) 9 (47.4%) 8 (42.1%) >9.0% n=15 14 (93.3%) 3 (20.0%) 13 (86.7%) 13 (86.7%) BMI
Barrier frequency was similar across sites, but was higher in females than males and in Hispanics and Non-Hispanic Non-Whites than in their Non-Hispanic White peers. Barrier frequency was also higher in those with most recent clinic HbA1c values higher than 9.0%. Barrier frequency did not appear to differ significantly by weight status.
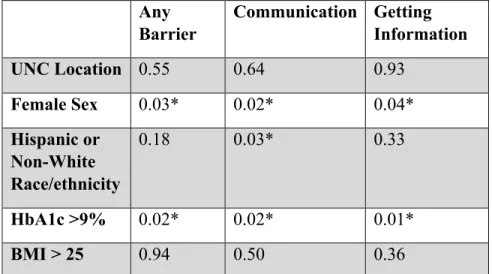
To examine the contributions of each of the demographic and clinical variables to barrier prevalence, a chi square analysis was done yielding the following p-values (Table 6). Female sex and HbA1c >9% showed significant associations at the overall level, and within the barrier categories of communication and getting information. Contextual care was not analyzed due to low barrier frequency. Being a racial or ethnicity minority contributed significantly to barrier frequency only in the case of communication barriers.
Any Barrier
Communication Getting Information
UNC Location 0.55 0.64 0.93
Female Sex 0.03* 0.02* 0.04*
Hispanic or Non-White Race/ethnicity
0.18 0.03* 0.33
HbA1c >9% 0.02* 0.02* 0.01*
BMI > 25 0.94 0.50 0.36
Table 6 P-values for chi square analysis of demographic and clinical variables.
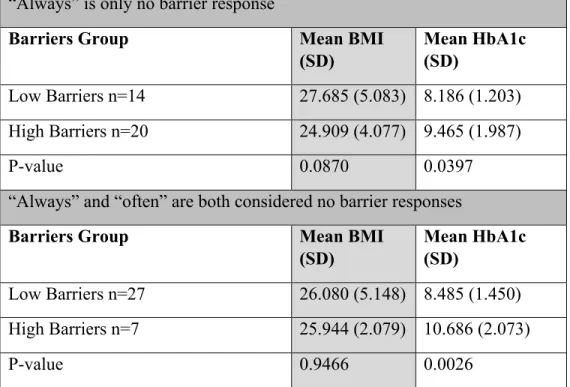
examine whether or not the strict scoring approach had an effect on this association, the analysis was done once again with a less strict cut-off for a “no barrier” response. The mean difference in HbA1c became larger and the p-value more significant even when “often” was included as a no barrier response. There was no significant mean difference in BMI across the low and high barrier group regardless of the scoring method used (Table 7).
“Always” is only no barrier response
Barriers Group Mean BMI
(SD)
Mean HbA1c (SD)
Low Barriers n=14 27.685 (5.083) 8.186 (1.203) High Barriers n=20 24.909 (4.077) 9.465 (1.987)
P-value 0.0870 0.0397
“Always” and “often” are both considered no barrier responses
Barriers Group Mean BMI
(SD)
Mean HbA1c (SD)
Low Barriers n=27 26.080 (5.148) 8.485 (1.450) High Barriers n=7 25.944 (2.079) 10.686 (2.073)
P-value 0.9466 0.0026
Table 7Mean BMI and HbA1c for low and high barriers groups, using both the high-cut off SEARCH scoring classification and the lower-cut off TASTE scoring classification
*anything besides "always" was considered a barrier response
** count "often" and "always" as no barrier and "never" "seldom" and "sometimes" as barriers
Focus Group Data
providers who were able to give advice that took into account both processes would help to alleviate some of the antagonism. There were other minor themes for which saturation was not reached, meaning that only one or a few groups reached consensus about them. Some of these are mentioned briefly in order to illustrate the full range of opinions expressed across the groups, but further studies would be needed to confirm the pervasiveness of these perceptions across the total population of youth with T1D or across subgroups within the population.
Provider Involvement in Weight Management
Six of the eight focus groups explicitly mentioned a desire for involvement of at least one member of the health care provider team in their weight management care. Members of the provider care team that were mentioned included doctors, dietitians and
psychologist/psychiatrists. Youth desired their involvement in order to receive help adjusting diabetes care concordantly with changes in diet and exercise (major request) and tips on dieting and exercising to lose weight (minor request). The reason for
involving member(s) of the provider care team was most often related to their perceived knowledge on the topic.
the three groups that discussed previous interactions with providers, there were a few participants with positive commentary. However, from each group there was at least one negative aspect about an interaction that was brought up that was agreed upon by another participant. Youth felt their interactions with providers were hindered by a range factors that largely deal with a lack of understanding of the patient’s circumstances that was inherent in the advice provided or in the way the advice was delivered. The primary factor across several groups was a lack of diabetes-specific weight management care, but other factors that were mentioned by at least one group included a lack of openness to question asking by providers, a lack of understanding of other priorities in youth’s lives, a lack of cultural sensitivity and looking at patients “like a number,” that number being HbA1c.
Major Themes: Perceived Antagonism between T1D and Weight Management and the
Desire for Personalized and Diabetes-Specific Weight Management Care
the way that changes to diet and exercise affected diabetes care and the way that diabetes care affected attempts to lose weight.
The two most commonly mentioned desires were specific suggestions on how to modify insulin or pump settings in response to changes in diet and exercise and real-time
monitoring of blood sugars and food intake via an app with manual entry or via a chip under the skin. These entries would be transmitted to a doctor who could provide periodic suggestions or store the knowledge for future appointments to discuss with youth. There were also requests for advice on foods that wouldn’t raise blood glucose as much or exercises that wouldn’t lower blood glucose as much for when youth are trying to lose weight. Participants also found favor with planning that took into account the patient’s body type and weight loss goals. The idea of a formula was brought that would allow for input of current weight status, weight loss goals, dietary intake, exercise and clinical outcomes (namely blood sugar).
In one of the female overweight groups, there was resentment towards weight management plans designed for the general population, which also illustrates how diabetes-specific planning would be seen as favorable. Things like Weight Watchers and low-carb diets were deemed unreasonable for youth with T1D because they don’t leave room for the calories or carbs that are required to manage lows throughout the day. Minor Themes: Perception of Distinct Realms of Expertise for Members of the Health
Care Provider Team in Weight Management and Desire for Integration
factors involved in diabetes care like insulin and blood glucose, youth across groups demonstrated the perception that dietitians and doctors have distinct realms of expertise. The idea that, in general, doctors should deal with ‘the diabetes-related stuff’ and
dietitians deal with ‘the food-related stuff’ persisted despite a desire for both individuals to have care that took into consideration the factors that may be simultaneously occurring in the other’s department. This finding perhaps evidences the current lack of integration between the topics, and the belief that dietitians aren’t allowed to alter insulin and doctors don’t understand nutrition. The surprising persistence of the distinct realms of expertise idea is remedied by another minor theme of the desire for integration. Youth in a few groups agreed upon the notion that seeing doctors and dietitians together or having them communicate with one another regularly was favorable for their care.
DISCUSSION
The data indicated that barriers to communication and getting information regarding weight management were common in youth with T1D. These youth reported a desire to access multiple members of the provider care team for diabetes-specific and personalized weight management care to overcome the antagonism that they felt was inherent between weight management and T1D.
Barriers to Weight Management Care in Youth with Type 1 Diabetes
youth with T1D. The TASTE study population was recruited from endocrinology clinics, so access to care was assumed for these patients. This presented the opportunity to isolate process barriers and determine their influence on youth’s perceptions of provider
interactions about weight management in the context of T1D.
The TASTE study showed that a substantial proportion of T1D youth experience barriers to high quality care with regards to T1D and weight management. 73.5% of participants experienced at least one barrier to care. Barriers to provider-patient communication and getting needed information were experienced by more than 60% of participants.
Contextual care was less of a problem in this population, as only 17.6% experienced this problem. It is interesting that barriers to contextual care were not common despite verbal discussion in the focus groups regarding a desire for care that took into account one’s context, including one’s diabetes, culture, adolescent social life and other factors. The frequency of barriers overall was found to be higher in females, Hispanic and Non-Hispanic Non-White youth, and individuals with higher HbA1c levels. Additionally, mean HbA1c was found to be higher in those with more reported barriers, while mean BMI was found to be lower, though the later association never reached significance. These final two findings regarding barriers, demographic factors and clinical variables will be discussed in relation to the SEARCH study22 and other literature.
Comparison with the SEARCH Population of T1D Youth
The SEARCH population of U.S. youth with T1D provides the primary source of
the two data sources allows one to determine if the barriers experienced with regards to weight management are similar to those experienced with regards to T1D, or if different barriers emerge in the new context.
The frequency of barriers to care in the TASTE population of 34 T1D youth was similar to that of the SEARCH population of 780 T1D youth. In the TASTE study 73.5% of participants experienced at least one barrier, as compared to 81.7% of SEARCH participants.22 It should be noted that the SEARCH study included three other barriers labeled ‘access barriers’ (regular provider, access to care, and cost of care) in addition to the ‘process barriers’ that were examined in the TASTE study (contextual care,
communication and getting information). Getting information and communication, along with cost, were the most prevalent barriers in SEARCH experienced by 48.4% and 43.0% of participants, respectively.22 In the TASTE cohort, communication was the top barrier experienced by 64.7% of participants followed by getting information at 61.7%.
Racial/Ethnic Differences
In SEARCH there was a significantly higher odds of having any of the three barriers in Hispanic youth than Non-Hispanic Whites.22 However, there was no significant
communication in racial/ethnic youth extend to the realm of weight management and must be considered by clinicians and researchers when developing interventions and protocol to improve health outcomes.
Gender Differences
There was not a difference in barrier frequency by gender observed in SEARCH,22
though there was a significantly higher prevalence of barriers in females was observed in TASTE. It could be speculated that females may experience more barriers to care with regards to weight management than they do with regards to general T1D care due to sensitivities surrounding weight. It has been shown in the literature that adolescent
females are more dissatisfied with their bodies than adolescent males, and are more likely to attempt to lose weight.40 This was also evidenced by TASTE data showing that more female participants were actively trying to lose weight. Because of this, females may be more likely to interact with providers about weight management or have more invested in the interactions, thus potentially leading to a higher prevalence of perceived barriers. However, studies surrounding female patients discussing weight with providers found that providers are more likely to engage in beneficial motivational-interviewing
techniques with females,41 and that provider-patient agreement with regards to discussion of weight was more likely to happen in females than males.42 Therefore, more research is needed to examine whether or not there is a higher prevalence of barriers to weight management care in the female population.
In the SEARCH study, t-test analysis showed that mean HbA1c levels were higher in patients who indicated barriers to contextual care, but not barriers to communication or getting information.21 The SEARCH study did not look at associations between barriers and BMI. With TASTE, mean HbA1c levels were found to be significantly higher in patients with high barriers, but mean BMI was found to be lower in the same group (not statistically significant). Analysis by specific barriers group was not done.
It was surprising to find that the mean HbA1c was significantly higher in the high barriers group despite the fact that the mean BMI was lower considering that weight status has been shown to be significantly associated with poorer glycemic control.18 The lower BMI in the high barriers group was also counter to the hypothesis that those who were overweight or obese would experience more barriers to weight management care than their normal weight peers. More research involving a larger sample size is needed to examine these conclusions and to conduct multivariate analyses on the interactions between barriers and HbA1c and barriers and BMI, as well as the relationship between HbA1c and barriers.
Perceptions of T1D Youth Regarding Provider Interactions about Weight Management
puzzlingly were proponents of bringing weight management and diabetes care together. The dialogue supports the conclusion that perhaps youth feel that currently the roles of the health care provider team are very separate and silohed, but could benefit from further integration which would aid in the deliver of diabetes-specific weight management care, the first and foremost desire of the focus group participants.
Strengths and Limitations
Limitations exist in this study. By nature of being a pilot study, the TASTE study was designed for a smaller number of participants. In addition, small pools of eligible
participants and less-than-targeted recruitment outcomes lead to eight focus groups across the two sites rather than twelve. Therefore small sample size is a major limitation of this study, which impacts the ability to conduct advanced statistical analyses and to achieve saturation on minor focus group themes.
Limitations with Barriers to Care Data
The presence of barriers was indicated by youth self-report using the CAHPS survey. Although the CAHPS survey is a validated instrument, there may be measurement biases present. Also, patients were asked to consider their responses specifically with regard to weight management care, but there is no guarantee that patients who had limited
response. In regression analysis, associations between barriers and HbA1c not only withheld, but strengthened when barriers were classified with a lower cut-off that
included “often” as a no barrier response. However, the study team acknowledges that in reality, barriers may not be dichotomized, but occur more along a spectrum.
Limitations to Focus Group Discussion
In addition, there are limitations inherent in focus group research. A meta analysis of focus group studies conducted with adolescent populations found that common
limitations include peer and moderator influence, small group size, wording of questions and interpretive bias of the researcher.43 In the case of this particular study, using
different moderators at the two study sites may have played a role in time spent
discussing particular topics. Additionally, sensitivities regarding the discussion of weight may still be present despite stratification of groups by gender and weight status and these could have lead to certain comments or experiences being withheld from group
discussion. Strengths
study provides a platform of basic information patient perceptions about weight
management care for other researchers and clinicians to use in hypothesis-generation for future research and practice.
CONCLUSION
Both focus group dialogue and barriers to care data indicate that T1D youth are not receiving the highest quality care with regards to weight management. Research in populations other than T1D youth have shown that in the absence of barriers to accessing care,44 barriers to receiving high quality care can be corrected.45 There are existing recommendations from the Institute of Medicine46 that provide evidence-based strategies and interventions for both patients and providers aimed at reducing barriers to provider-patient communication in specific racial/ethnic populations. These recommendations may hold promise for mitigating the observed higher frequencies of barriers in Hispanic and Non-White youth.
References:
1. Clark KA, Krueger EL, Vanden Bout DA. Direct Measurement of Energy Migration in Supramolecular Carbocyanine Dye Nanotubes. J Phys Chem Lett. 2014;5(13):2274-2282.
2. SEARCH for Diabetes in Youth Study Group, Liese AD, D’Agostino RB Jr., Hamman RF, Kilgo PD, Lawrence JM, Liu LL, Loots B, Linder B, Marcovina S, Rodriguez B, Standiford D, Williams DE. The burden of diabetes mellitus among US youth: prevalence estimates from the SEARCH for Diabetes in Youth Study. Pediatrics. 2006;118(4):1510-8.
3. Mayer-Davis et al. Incidence trends of Type 1 and Type 2 Diabetes among youths, 2002-2012. New Eng J Med. 2017;376(15):1419-29.
4. Daneman D. Type 1 diabetes. Lancet. 2006;367(9513):847-858.
5. The effect of intensive treatment of diabetes on the development and progression of long-term complications in insulin-dependent diabetes mellitus. The Diabetes Control and Complications Trial Research Group. New Eng J Med. 1993;329(14):977-986.
6. Baskaran C, Volkening LK, Diaz M, Laffel LM. A decade of temporal trends in
overweight/obesity in youth with type 1 diabetes after the Diabetes Control and Complications Trial. Pediatr Diabetes. 2015;16(4):263-70.
7. Pihoker C, Badaru A, Anderson A, et al. Insulin regimens and clinical outcomes in a type 1 diabetes cohort: the SEARCH for Diabetes in Youth study. Diabetes Care. 2013;36(1):27-33.
8. Purnell JQ, Zinman B, Brunzell JD. The effect of excess weight gain with intensive diabetes mellitus treatment on cardiovascular disease risk factors and atherosclerosis in type 1 diabetes mellitus: results from the DCCT/EDIC study. Circulation. 2013;127(2):180-7.
9. Purnell JQ, Hokanson JE, Marcovina SM, Steffes MW, Cleary PA, Brunzell JD. Effect of excessive weight gain with intensive therapy of type 1 diabetes on lipid levels and blood pressure: results from the DCCT. Diabetes Control and Complications Trial. JAMA. 1998;280(2):140-146.
10. Laing SP, Swerdlow AJ, Slater SD, et al. Mortality from heart disease in a cohort of 23,000 patients with insulin-treated diabetes. Diabetologia. 2003;46(6):760-765.
11. Maahs DM, Daniels SR, de Ferranti SD, et al. Cardiovascular disease risk factors in youth with diabetes mellitus: a scientific statement from the American Heart Association. Circulation. 2014;130(17):1532-1558.
12. de Ferranti SD, de Boer IH, Fonseca V, et al. Type 1 diabetes mellitus and cardiovascular disease: a scientific statement from the American Heart Association and American Diabetes Association. Circulation. 2014;130(13):1110-1130.
13. Look ARG, Pi-Sunyer X, Blackburn G, et al. Reduction in weight and cardiovascular disease risk factors in individuals with type 2 diabetes: one-year results of the look AHEAD trial. Diabetes Care. 2007;30(6):1374-1383.
15. Mokdad AH, Serdula MK, Dietz WH, Bowman BA, Marks JS, Koplan JP. The spread of the obesity epidemic in the United States, 1991–1998. JAMA 1999: 282: 1519–1522.
16. Hedley AA, Ogden CL, Johnson CL, Carroll MD, Curtin LR, Flegal KM. Prevalence of overweight and obesity among US children, adolescents, and adults, 1999–
2002. JAMA. 2004: 291: 2847–2850.
17. Liu LL et al. Prevalence of overweight and obesity in youth with diabetes in USA: the SEARCH for Diabetes in Youth study. Pediatr Diabetes. 2010;11(1):4-11.
18. DuBose SN, Hermann JM, Tamborlane WV. Obesity in Youth with Type 1 Diabetes in Germany, Austria and the United States. J Pediatr. 2015;167(3):627-32.
19. Redondo MJ et al. Prevalence of cardiovascular risk factors in youth with Type 1 diabetes and elevated body mass index. Acta Diabetologica. 2016;53(2):271-277.
20. Schilling LS, Grey M, Knafl KA. The concept of self-management of type 1 diabetes in children and adolescents: an evolutionary concept analysis. J Adv Nurs. 2002; 37(1): 87-99.
21. Stratton R, Wilson DP, Endres RK: Acute glycemic effects of exercise in adolescents with insulin-dependent diabetes mellitus. Phys Sportsmed 1988; 16:150-157.
22. Valenzuela JM, Seid M, Waitzfelder B, et al. Silverstein and WFB Prevalence of and
Disparities in Barriers to Care Experienced by Youth with Type 1 Diabetes. J Peds.
2014;164(6):1369-1375.
23. Kaplan SH, Greenfield S, Ware JE Jr. Assessing the effects of physician-patient interactions on the outcomes of chronic disease. Med Care. 1989 Jul;27(7):679.
24. Stewart MA. Effective physician-patient communication and health outcomes: A review. CMAJ. 1995 May 1;152(9):1423-33.
25. Zolnierek KB, Dimatteo MR. Physician Communication and Patient Adherence to Treatment: a Meta-Analysis. Med Care. 2009 Aug;47(8):826-34.
26. Greenfield S, Kaplan SH, Ware JE Jr., Yano EM, Frank HJ. Patients' participation in medical care: effects on blood sugar control and quality of life in diabetes. J Gen Intern Med. 1988 Sep-Oct;3(5):448-57.
27. Heisler M, Bouknight RR, Hayward RA, Smith DM, Kerr EA. The Relative Importance of Physician Communication, Participatory Decision Making, and Patient Understanding in Diabetes Self-management. J Gen Intern Med. 2002 Apr;17(4): 243–252.
28. S.S. Shrestha, P. Zhang, A. Albright, G. Imperatore. Medical expenditures associated with diabetes among privately insured U.S. Youth in 2007. Diabetes Care. 2011; 34:1097–1101.
29. Markowitz JT, Butler DA, Volkening LK, Antisdel JE, Anderson BJ, Laffel LM. Brief screening tool for disordered eating in diabetes: internal consistency and external validity in a contemporary sample of pediatric patients with type 1 diabetes. Diabetes Care. 2010;33(3):495-500.
31. van Strien T, Frijters, J. E. R., Bergers, G. P. A. and Defares, P. B. . The Dutch Eating Behavior Questionnaire (DEBQ) for assessment of restrained, emotional, and external eating behavior. Int. J. Eat. Disord. 1986;5:295-315.
32. White MA, Whisenhunt BL, Williamson DA, Greenway FL, Netemeyer RG. Development and validation of the food-craving inventory. Obes Res. 2002;10(2):107-14.
33. Blumberg SJ, Bialostosky K, Hamilton WL, Briefel RR. The effectiveness of a short form of the Household Food Security Scale. Am J Public Health. 1999;89(8):1231-34.
34. Mayer-Davis EJ, Seid M, Crandell J, Dolan L, Lagarde WH, Letourneau L, Maahs DM, Marcovina S, Nachreiner J, Standiford D, Thomas J, Wysocki T. Flexible Lifestyles for Youth (FL3X) behavioural intervention for at-risk adolescents with Type 1 diabetes: a randomized pilot and feasibility trial. Diabet Med. 2015;32(6):829-33.
35. Quigley DD, Martino SC, Hays RD. Evaluating the content of the communication items in the CAHPS clinician and group survey and supplemental items with what high-performing
physicians say they do. Patient. 2013;6(3):169-77.
36. C. Bradley, R. Plowright, J. Stewart, J. Valentine, E. Witthaus. The Diabetes Treatment Satisfaction Questionnaire change version (DTSQc) evaluated in insulin glargine trials shows greater responsiveness to improvements than the original DTSQ. Heal Qual Life Outcomes. 2007; 5:57.
37. P.C. Van Dyck, M.D. Kogan, M.G. McPherson, G.R. Weissman, P.W. Newacheck. Prevalence and characteristics of children with special health care needs. Arch Pediatr Adolesc Med. 2004; 158:884–890
38. Laws BM, Lee Y, Rogers WH, Beach MC, Saha S, Korthius PT, Sharp V, Cohn J, Moore R, Wilson IB. Provider-patient communication about adherence to anti-retroviral regimens differs by patient race and ethnicity. AIDS and Behavior. 2014;18(7):1279-87.
39. Valenzuela JM, Smith L. Topical review: provider-patient interactions: an important
consideration for racial/ethnic health disparities in youth. J Pediatr Psychol. 2016;41(4):473-480.
40. McCabe MP, Ricciardelli LA. Parent, peer and media influences on body image and strategies to both increase and decrease body size among adolescent boys and girls. Adolescence.
2001;36(142):225-40.
41. Pollak et al. Weight’s up? Predictors of weight-related communication during primary care visits with overweight adolescents. Patient Educ Couns. 2014;96(3):327-32.
42. Greiner KA, Born W, Hall S, Hou Q, Kimminau KS, Ahluwalia JS. Discussing weight with obese primary care patients: physician and patient perceptions. J Gen Int Med. 2008;23(5):581-87.
43. Daley A. Adolescent-friendly remedies for the challenges of focus group research. Western J Nurs Res. 2013; 35(8): 1043-1059.
45. Seid M, Stevens GD. Access to care and children's primary care experiences: results from a prospective cohort study. Health Serv Res. 2005; 40:1758–1780.