IMPLEMENTATION OF A SIMPLE WIRELESS SENSOR NODE
FOR THE DETECTION OF GASEOUS SUBSTANCES
LEAKAGE
S. Edward Jero1, A. Balaji Ganesh2* and T.K. Radhakrishnan3 1&2
Opto-electronic sensor research laboratory, TIFAC-CORE, Velammal Engineering College, Chennai-600 066, INDIA, 3Process Control Laboratory, National Institute of Technology,
Trichirappalli-620 015,INDIA.
Email: [email protected], [email protected] and [email protected]
Submitted: June 23, 2011 Accepted: August 21, 2011 Published: September 1, 2011
Abstract- The paper presents the steps involved in implementing a customizable wireless sensor node for the detection of gaseous substances leakage in both internal and external environments. The node consists of various modules namely, sensors, signal conditioning, computational unit, wireless communication and power supply. The measurand to be measured are carbon dioxide, oxygen, relative humidity and temperature. A computational analysis is performed using a nano-watt PIC18LF4620 microcontroller and the wireless communication is realized through a MRF24J40MA Zigbee module. The results obtained prove that the sensor node possess good features such as, low cost, simple to use, minimal power consumption, long network range and compatibility with analog/digital sensors. The simple construction procedures create the possibility of implementing such customizable sensor node for the different environmental monitoring applications.
I. INTRODUCTION
From the last two decades, the wireless sensor network provides the best services to monitor and control of a variety of parameters in various areas which include manufacturing, military, agriculture, habituate systems, underwater systems, home networking, healthcare and pharmaceuticals control data from the environment through the deployed sensor nodes. The functional components of a sensor node are, microcontroller, memory, power source in the form of a battery, transceiver and sensors. The components make a sensor node to be referred as a small field-deployable computer. In any sensor network, usually two kinds of nodes are there. One is referred as sensor node which is deployed in the environments to collect the phenomena and the other is gateway node which collects the information from sensor node eventually it interfaces sensor network to the external world [2]. Currently a number of generic type sensor node systems are available commercially [3]. The majority of sensor nodes are equipped with sensing modalities such as light, acoustic, acceleration and temperature. Implementation of sensor node is influenced by many factors, which include production cost, availability of resources, scalability, transmission media and power consumption [4].
There are number of researchers practising the wireless sensor network for gaseous substances monitoring [5-6]. More works are reported pertinent to the development of firmware and protocol enhancements rather than on implementation of indigenous wireless sensor node to ensemble for air pollution monitoring. However, few research findings are available in literature pertinent to practical implementation strategies and methods which uses variety of controllers and communication protocols. APOLLO is an example of sensor board which is interfaced with host system for air pollution monitoring and issues related to hardware and software described [7]. Recently a similar attempt has been made to interface indigenously developed sensor board with PICDEMZ host system which is described elsewhere [8].
In this study, a customizable sensor node is indigenously constructed and various sensing modalities such as carbon dioxide, oxygen, temperature and humidity are integrated. The assumption is that any leakage in hazardous gaseous substances in the environment creates an impact in the concentration of oxygen, carbon dioxide, temperature and relative humidity. The deployed sensor node provides the continuous monitoring of these parameters in a larger area and
eventually communicates to the remote location. The system uses a low power PIC18LF4620 microcontroller and MRF24J40MA Zigbee module. The performance characteristics such as power consumption, range, compatibility with sensors are validated and the results are tabulated.
II. ARCHITECTURE OF WIRELESS SENSOR NODE
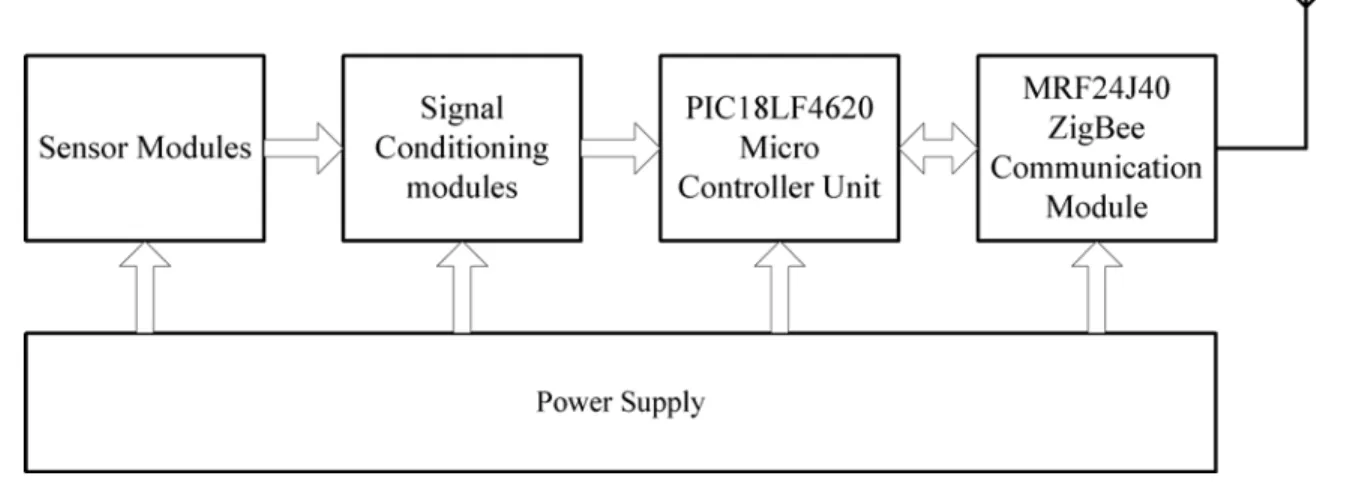
The sensor node has Zigbee based communication modules and it consists of other functional units such as sensing unit, signal conditioning unit, computational unit and battery powered power unit [10, 18-20]. The block diagram representation of sensor node is shown in Figure 1. A 9V Ni-MH battery power is outsourced as regulated power supply in the ranges of ±5.0 V and ± 3.3 V. The Zigbee wireless module is practised using MRF24J40MA, operated at 2.4 GHz which uses IEEE standard 802.15.4 complaint RF transceiver [15].
Figure 1. Block diagram of proposed wireless sensor node
a. Sensor-Selection Process
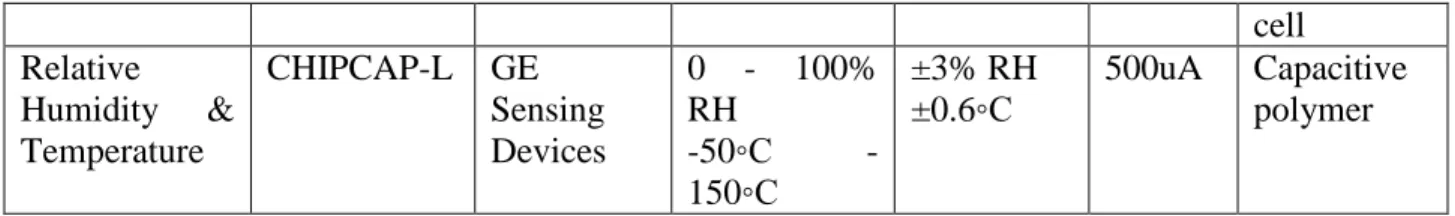
In the selection of sensors, the characteristics such as power consumption, accuracy, simple calibration procedure, size, simple interfacing methods are considered. The chosen sensors along with its specifications are listed in Table 1 [11-13]. A detailed analysis on selection of sensors and calibration procedures is described elsewhere [9].
Table 1: Selected sensor with its specification
Sensor Product Company Range Accuracy Power Type CO2 TGS4161 Figaro 350~10000 ppm ±20% at 1000 ppm 50mA Solid electrolyte O2 KE-50 Figaro 0% - 100% ±2% - Galvanic
cell Relative Humidity & Temperature CHIPCAP-L GE Sensing Devices 0 - 100% RH -50◦C - 150◦C ±3% RH ±0.6◦C 500uA Capacitive polymer
b. Strategies in Components Integration
The microcontroller is responsible to perform operations such as, computation, conversion of sensed information into respective engineering unit and perform the execution of Zigbee protocol stack for wireless communication. The integration of components with microcontroller is shown in Figure 2.
Figure 2. Integration of components into microprocessor
The chosen PIC18LF4620 microcontroller consists of 13 channels of analog to digital converter (ADC) with 10-bit resolution, digital input/output and Serial Peripheral Interface (SPI) module through which Zigbee module has been interfaced [14, 17]. In this, 4 ADC channels are utilized and remaining channels can be customized depending on the requirements. The watchdog timer pre-scalar value supports the maximum of two minutes interval. The microcontroller supports the three operating modes, such as run, idle and sleep. The wireless transceiver supports the data rate of 250 Kbps and also protocols such as Zigbee, MiWi and P2P.
c. Processes in building the hardware and software protocol architecture
The configuration of sensor node is performed through Zigbee protocol stack which makes the sensor node to be recognized either as a full function device or a reduced function device (RFD) by the coordinator node in the network. The full function device in the network does perform both monitoring and control functions. However, it requires more power to perform the functions including checking the activities of nodes and responding to the requests. The reduced function
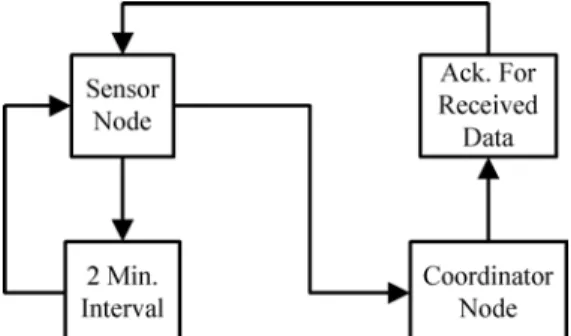
device also performs the operations of monitoring and control. But it operates under both run and sleep mode and eventually it consumes considerably low power. The protocol stack of sensor node is configured as reduce function device. The functional architecture of communication process is shown in Figure 3. The node is configured to switch between run and sleep mode at an interval of every two minutes [21]. After immediate initiation, the node reads the sensor port, performs computation and eventually transmits the signal before it goes to sleep mode. The procedure is repeated and watch dog timer is configured to wake-up the microcontroller from sleep mode.
Figure 3. Functional architecture of wireless sensor node
The physical layer is responsible for the wireless connectivity and it has been established through microcontroller, SPI interface, Zigbee module and an antenna device. The software design of Zigbee protocol specifications are implemented in medium access control layer (MAC). The Zigbee 2006 is a stack for Zigbee protocol developed by Microchip in which primitives are used to interface one Zigbee function with another Zigbee and/or with user defined function [16]. It directs the execution of Zigbee stack from one state to another state. Some of the primitives are,
NO_PRIMITIVE, APSDE_DATA_request, APSDE_DATA_confirm and APSDE_DATA_indication, used in the application layer of the Zigbee stack. The non-Zigbee
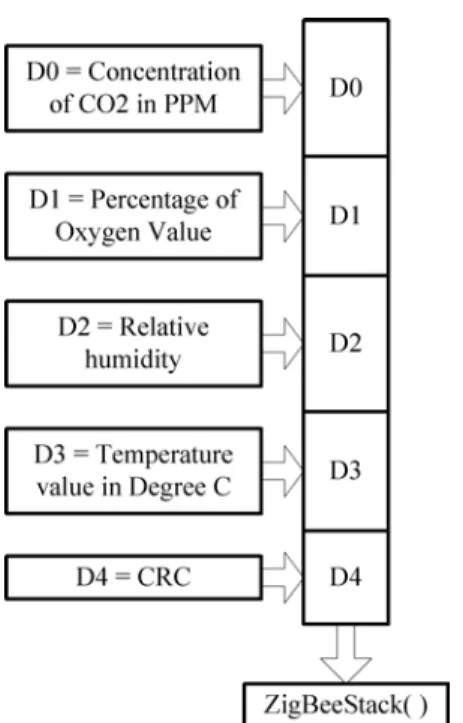
task in Zigbee 2006 performs the operations such as monitoring of external events such as, reading ADC modules and computations of user defined software functions. The measured data such as concentration of CO2 (D0), oxygen (D1), relative humidity (D2) and Temperature (D3) are obtained through non-Zigbee task which loaded into the data buffer (i.e) SensorData[i] of non-Zigbee task as shown in the Figure 4.
Figure 4. Block diagram of sensor data frame
After initiation of hardware configurations the Zigbee processes are invoked to establish the wireless network. After establishing the network, the data is collected from respective sensor and the computational analysis is performed. The resultant data is stored in a buffer (i.e) SensorData[i]. The availability of Zigbee module is verified by the function ZigBeeReady( ). If this function returns TRUE, then the application layer is ready for new outgoing message. ZigBeeBlockTX( ) function is invoked to lock the system so that subsequent calls to ZigBeeReady( ) will return FALSE. Now, data buffer, SensorData[i] is loaded into transmission buffer TxData[i]. Primitive is a data structure used to set the parameters such as source endpoint, destination endpoint, short address, group address, profile ID and cluster ID etc., of the sensor node. APSDE_DATA_confirm also represents the successful transmission of data from the sensor node. After successful transmission of message the sensor node is entered into sleep mode for 2 min and the above procedures are repeated. A flow chart basis communication procedure is shown in Figure 5.
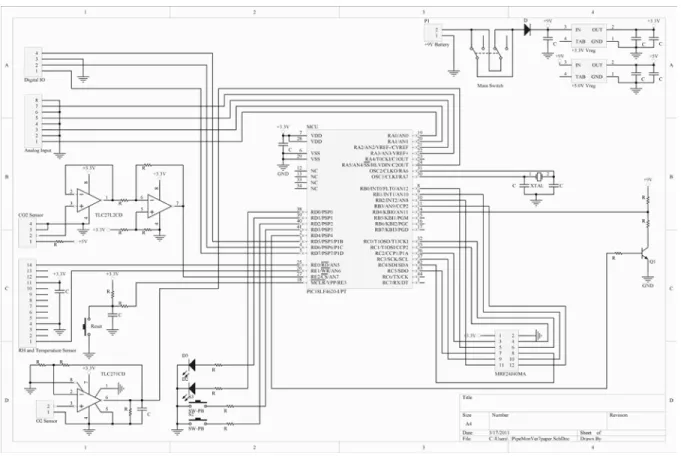
A schematic representation of circuit components is shown in Figure 6 where as the Figure 7 shows the designed sensor node.
Figure 6. Schematic diagram of sensor node
III. RESULTS AND DISCUSSIONS
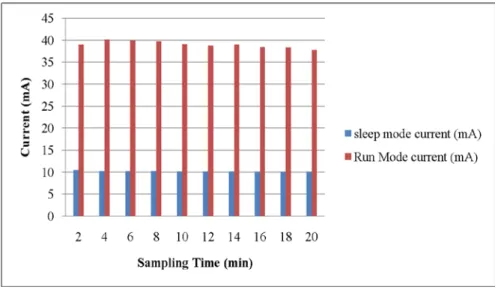
The power consumption of both sensor node and individual sensors is calculated. The testing cases are generated to estimate the power consumption of integrated sensor node during run and sleep modes. The average current consumption values of sensor node without sensors while in run and sleep mode is estimated as 37mA and 10mA respectively which is shown in Figure 8.
Figure 8. Node current consumption without sensors
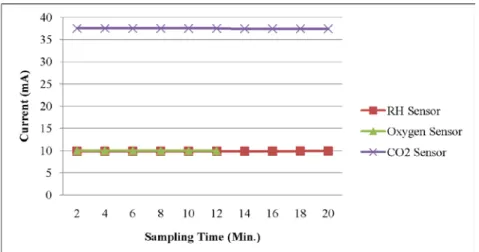
The current consumption of individual sensor in both modes is also calculated and the results are shown in Figs. 9 and 10. In all the cases, the Carbon dioxide sensor consumes more power than any other sensor. Because of built-in heater coil and circuit, the sensor consumes 69mA and 38mA current in run and sleep mode respectively. The resultant data are monitored for more than an hour. The oxygen sensor consumes 38mA and 10mA current in run and sleep mode respectively. The approximate current consumption value of humidity and temperature sensor is 41mA and 9.8mA in run and sleep mode respectively.
Figure 9. Current consumption of sensors in sleep mode
Figure 10: Current consumption of sensors in run mode
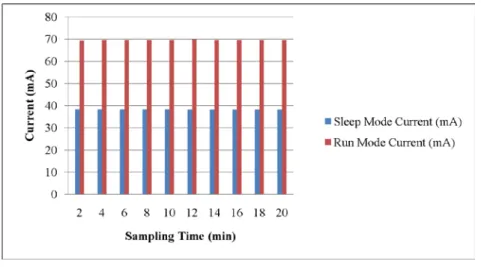
The current consumption of integrated sensor node with all the sensors is also calculated and the results are shown in Figure 11. The sensor node consumes the current of 69.6mA and 38.2mA in run mode and sleep mode respectively. It is estimated that the sleep mode provides a lower consumption of power by about 45%.
Figure 11. Current consumption of integrated sensor node
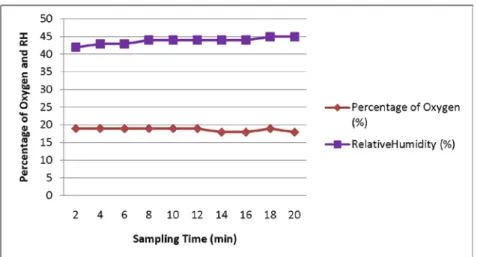
The range between sensor node and coordinator node is successfully tested for the distance of 100 feet without any data loss. The sensor node has been validated in both internal and external environments. The coordinator has the interconnection with computer through RS- 232 communication. The real time outputs from sensors are received and values are displayed in computer in terms of their respective values. The obtained values from the sensor node are plotted which is shown in Figs. 12, 13 and 14. The sensed values have the higher degree of relevance with the calibrated values [9].
Figure 13. Oxygen and Relative Humidity sensors output values
Figure 14. Temperature sensor output values
IV. CONCLUSIONS
A sensor node with sensing modalities such as carbon dioxide, oxygen, humidity and temperature is constructed and validated. The node has the compatibility with the sensors and it can also be customized with other environmental sensors. The characteristics such as power consumption and transmission range are estimated. The sensor board is constructed using simple procedures and PIC18LF4620 as its computational unit. The obtained results create the possibility of adapting such strategies to develop the sensor node for other environmental applications. The sensor node has the features such as low power usage, minimum size, low cost and long network range. The design and development of compatible coordinator node with relevant firmware is in progress.
Acknowledgement
The authors gratefully acknowledge the financial support of Technology Information, Forecasting and Assessment Council – Department of Science and Technology (TIFAC-DST) through research centre in Pervasive Computing Technologies at Velammal Engineering College, Chennai.
REFERENCES
[1] Akyildiz Ian F, Su W, Sankarasubramaniam Y, Cayirci E, “Wireless Sensor Networks: A Survey”, Computer Networks, 2002, pp. 393-422.
[2] Dargie W, Poellabauer C, “Fundamentals of wireless sensor networks: theory and practice”, 2010, John Wiley and Sons.
[3] Yick J, Mukherjee B, Ghosal D, “Wireless sensor network survey”, Computer Networks 2008, pp. 2292–2330.
[4] Kay Romer, Mattern Friedemann, “The Design Space of Wireless Sensor Networks”. IEEE Wireless Communications, 2004, pp. 54–61.
[5] Barrenetxea G, Ingelrest F, Schaefer G et al, “SensorScope: Out-of-the-Box Environmental Monitoring”, 2008, Proc. of Int. Conf. on Information Processing in Sensor Networks, pp. 332—343.
[6] Murty R.N, Mainland G, Rose I et al, “CitySense: An UrbanScale Wireless Sensor Network and Testbed”, 2008, Proc. of IEEE Conference on Technologies for Homeland Security , pp. 583 – 588.
[7] Sukwon Choi, Nakyoung Kim, Hojung Cha, Rhan Ha, “Micro Sensor Node for Air Pollutant Monitoring: Hardware and Software Issues” Sensors, 2009, pp. 7970-7987.
[8] Edward Jero S, Balaji Ganesh A, “PIC18LF4620 Based Customizable Wireless Sensor Node to Detect Hazardous Gas Pipeline Leakage” 2011, Proc. of International Conference on Emerging Trends in Electrical and Computer Technology, pp. 563-566
[9] Edward Jero S, Balaji Ganesh A, “An experimental report on customizable sensor node system for pipe line leakage monitoring” 2010, Proc. of International Conference on Modeling, Control, Automation and Communication, pp. 283-288
[10] Node Architecture. http://www.lancs.ac.uk/postgrad/rutlidge/pdf/ [11] Carbon dioxide. http://www.figarosensor.com/products/4161pdf.pdf [12] Oxygen Sensor. http://www.figarosensor.com/products/KE50.pdf
[13] Humidity and Temperature. http://www.gesensinginspection.com/en/moisture-and-humidity/relative-humidity-sensors/chipcap.html
[14] PIC18LF4620 Data sheet. www.microchip.com [15] MRF24J40MA Data Sheet. www.microchip.com
[16] Microchip Stack for the ZigBee™ Protocol. www.microchip.com
[17] Operational amplifier. http://focus.ti.com/docs/prod/folders/print/tlc271.html
[18] Stoianov I, Nachman L, Madden S, Tokmouline T, Csail M, “PIPENET: A Wireless Sensor Network for Pipeline Monitoring” 2007, Proc. of International Symposium on Information Processing in Sensor Networks, pp. 264 – 273.
[19] Volgyesi P, Nadas A, Koutsoukos X, Ledeczi A, “Air Quality Monitoring with SensorMap”, 2008, Proc. of International Conference on Information Processing in Sensor Networks, pp. 529 – 530.
[20] Peng Jiang, Hongbo Xia, Zhiye He, Zheming Wang, “Design of a Water Environment Monitoring System Based on Wireless Sensor Networks” Sensors, 2009, pp. 6411-6434.
[21] Arshak K, Jafer E, “A Wireless Sensor Network System for Pressure and Temperature Signals Monitoring”, 2007, Proc. of IEEE International Symposium on Industrial Electronics, 1496 – 1501.