This till is no"W" inde><ed in Scopus
---BCOPl. ...PLANNING MALAYSIA
Geospatial Analysis in Urban Planning Volume II (2013), Page 75 - 100
ASSESSMENT OF NEIGHBOURHOOD AFFORDABILITY BASED ON HOUSING AND TRANSPORTATION COSTS IN KUALA LUMPUR,
MALAYSIA
Abstract
Soheil Sabri1, Ahmad Nazri M. Ludin2 & Foziah Johar3
1
•2&3Centrefor Innovative Planning and Development (CiPD) UNN ERSITI TEKNOLOGI MALAYSIA
One of the primary aims of transit-oriented development (TOD) is to reduce auto dependency, especially for low-income as well as senior residents. This
study aims at providing some guiding principles for development of affordable
housing with respect to TOD concept. As such, the study employed an index
called Affordability Index (AI) and adapted for the study area to assess the neighbourhoods' affordability. It is composed of housing cost, household transportation cost, and household income. The analyses were conducted on three neighbourhoods in Kuala Lumpur, Malaysia. The results reveal that the AI is lower for both owners and renters in the neighbourhood farther away from the LRT station, where there is less public transit facility, despite the existence of
more affordable housing. On the contrary, the index is high in the neighbourhood where the distance to LRT station is shorter, connectivity index
is higher, and there are more public transport facilities, despite the presence of high- and medium-cost housings. These findings can be used to plan for suitable public transport facilities in view of neighbourhood affordability.
Keywords: TOD, Affordability Index, Transportation Cost, Housing Cost,
Kuala Lumpur
1
Senior Lecturer, Centre for Innovative Planning and Development, Universiti Teknologi Malaysia. Email: [email protected] (Corresponding Author)
Soheil Sabri, Ahmad Nazri M. Ludin & Foziah Johar
Assess111e111 of Neighbourhood Affordability based 011 Housing and Tra11spor1a1io11 Costs in Kuala Lumpur, Malaysia
INTRODUCTION
Smart growth has been defined as a set of goals, and policy mechanisms to achieve them, which serves as an alternative to sprawl (Aurand 2010). Smart growth is considered as one of the new urban development concepts in which a great opportunity for pleasant, hospitable, and economically beneficial conditions for living, working and recreation is desired (Weitz and Waldner 2002). According to The American Planning Associations' 2002 policy guide, the smart growth focuses on a compact, transit accessible, pedestrian-oriented, and mixed-use development patterns. Refocus of smart growth on inner parts of the cities in order to reduce the share of growth that occurs on newly urbanizing land, existing farmlands, and in environmentally sensitive areas is recently appreciated by governments.
Transit-oriented development (TOD) is instrumental in achieving the smart growth initiatives. TOD is often defined as higher-density mixed-use development within walking distance of transit stations. It aims at creating high density, pedestTian-oriented communities living in a mixed-used urban context (Litman 2007). TOD which promotes public transport will be most beneficial if combined with affordable housing (Mu and Jong 2012). Contemporary planning has not incorporate the cost of transportation in the provisions of affordable housing, although it has become one of the larger share of the household budget (Department Of statistics Malaysia 201 I). However, the current land use development pattern generates more urban journeys. According to Centre for Transit Oriented Development & Centre for Neighbourhood (2006), U.S. families living in neighbourhoods with greater residential density, a greater diversity of land uses and transit services spend less than l 0% of their income on transport as compared with 19% by the average U.S. household.
As such, the efficacy of TOD in reducing individual's auto use is directly related to accommodating the residents who are not able to use private cars. Two main groups are mainly considered in this regards, namely, low -income households and senior citizens. The combination of mixed-income housing and TOD is regarded as a possible solution to this issue (Belzer et al. 2007). However, there are barriers in joining mixed-income and transit-oriented neighbourhoods. The current literature on US cities suggests that the social equity goals of TOD have not been achieved in most cases.
A large and growing body of literature has been published on the impact of TOD on property value and demand. Some of the main issues are related to the complicated and expensive nature of TOD (Debrezion et al. 2007,
PLANNING MALAYSIA Geospatial Analysis in Urban Planning
Hess and Almeida 2007). Others, argued that the demand for housing near
transit stations should be socially desirable and increase the number of residential units in a TOD project (Cervero and Duncan 2001, 2002a,b; Winston and Maheshri 2007). Hence, the synergy between economic, land use, transportation, environment, housing, equity goals and TOD is not automatically achievable. Due to demographic, institutional and geographical differences, it is however difficult to generalize these studies (Duncan 2011). This study reviews the TOD and affordable housing in the context of Kuala Lumpur (KL), Malaysia, as an example of rapidly growing city.
This paper is divided into four parts. The first part deals with theoretical debates on TOD, affordable housing, and affordability index. The second part describes the design of affordability index model in Kuala Lumpur context. The third part presents the results of developed model in three KL neighbourhoods and evaluates the model by discussing the findings. The concluding remarks are presented in the fourth part of the paper.
TRANSIT-ORIENTED DEVELOPMENT
Transformation of cities through innovative public transport systems aims at providing more services to residents (Rimmer and Dick 2009). The literature suggests several reasons for developing urban public transit systems. Those reasons are declining traffic congestion, stimulating development, serving the central parts of the city, and improving the environment (Kim et al. 2007). Furthermore, these systems provide service to a wide range of residents by different income, age, gender as well as other urban activities such as commercial, institutional, and recreational.
Public transit potentially delivers congestion relief, reduces energy consumption, air quality improvement, and economic development (Litman 2012). In the US, several groups such as community-based developers, planners, and business leaders have already embraced TOD. It is also admired by advocates of transit and smart growth as a viable strategy that creates opportunity and accessibility for low-income households, and urban revitalization (PolicyLink 2008). It is believed that a community or a city, which is designed adhering to TOD principles, is able to move more passengers with lower spatial requirements (Mu and Jong 2012).
Preliminary work on TOD was undertaken by Calthorpe (1993) drawing on the future trajectories of American cities. He provided new planning guidelines as alternatives to housing, traffic, environmental, and social issues
Soheil Sabri, Ahmad Ncrt.ri M. L11di11 & Foziah Johar
Assessment of Neighbourhood Affordability based 011 Housing and Transportation Costs in Kuala Lumpur,
Malaysia
caused by urban sprawl. Therefore, many American cities such as San Diego, San Francisco, and Boston have adopted TOD principles (Kahn 2007; Duncan 201 I; Hess and Almeida 2007). There is a vast literature on good practices of TOD in Emopean and Asian cities (Mu and Jong 2012). However, the synergy between all goals of TOD such as economic, land use, transportation, environmental, housing and equity are not achieved in most cases (PolicyLink 2008).
Many claimed to be TOD projects are not fundamentally different from traditional residential suburban developments. They are not well-integrated with the station or the surrounding community, and they are neither mixed-use nor mixed-income. For instance, Cervera and Duncan (200 I), who investigated the land value effects of proximity to light and commuter rail stations on Santa Clara County, California, highlighted a substantial capitalization benefits for commercial lands. Similar study conducted on Buffalo, New York by Hess and Almeida (2007), indicated that a home located within one-quarter of a mile radius of a light rail station earns more compared with that of the city's median home value. Other studies (Cervero and Duncan 2002a,b; Duncan 2011) also conclude the likelihood that TOD housing will be unaffordable to low-income households. In other words, TOD can produce gentrification, which replaces the affordable housing and low-income residents by high-end residential, commercial, or offices (Kahn 2007). For instance, Cho-yam Lau (2011) reported a spatial mismatch caused by redevelopment of central area into business district in Singapore. The low-income residents have to spend a considerable percentage of their income and time going to work.
One question that needs to be answered, however, is to what extent the proximity to transit infrastructure reduces the overall household expenditure. A variety of influential factors for implementing an equitable TOD is reported in numerous academic and government documents. Among these factors, governance (including tax incentives and alternative transport service coordination) (Levine 2005; Cho-yam Lau 2011), land use (including density and diversity) (Cho-yam Lau 2011; Kim et al. 2007; Chakrnborty and Mishra 2013), urban design (including pedestrian friendly design, designs with human scale characteristics, safety and security) (Jacobson and Forsyth 2008), urban policy (protection from displacements, and securing local communities' benefits of TOD) (Cervera 2007; Winston and Maheshri 2007), expanding multi-centric developments and management of real estate market (Cervera and Duncan 2002b, Debrezion et al. 2007) are considered as priorities in achieving an equitable TOD principle.
AFFORDABLE HOUSING
PLANNING MALAYSIA Geospatial Analysis in Urban Pla1111i11g
Generally, housing affordability involves the capacity of households to consume housing services; specifically, it involves the relationship between household incomes and housing expenditure. If expenditure on housing relative to income is reasonable or moderate, it is considered as affordable (Kutty 2005). Affordability is commonly measured based on the ratio of housing costs to income. The rule of thumb in US, Australia, and most of Europe is that households exceeding 30% of the expenditure on housing, are identified as having an affordability problem (Nelson et al. 2002; Kutty 2005).
This approach, however, does not consider whether the income available after the housing expenditure is adequate to meet other household needs, such as transportation, food, cloth, education, and health care. In recent years, there has been an increasing criticism on this approach because of its normative and arbitrary nature (Hulchanski 1995; Kutty 2005; Mulliner et al.,
2012; Stone 2006; Seelig and Phibbs 2006). ln contrast to the conventional way of measuring affordability, Kutty (2005) and Stone (2006) recognise that housing affordability should address the issue of large families with more needs
versus the one- or two-person households. Their approach, which is known as
'shelter poverty' measure or residual income, considers the adequacy of household income to cover both housing costs and non-housing costs.
However, the residual income approach shares some shortcomings of the ratio measure, such as inability to cover the housing condition and impacts of location (Mulliner et al. 2012). Bogdon and Can (1997) question whether the
condition, location and neighbourhood characteristics of the housing are as
important as housing price and standards. Recently, literature has offered
contradictory findings about affordability and satisfaction in different places
and times. For instance, Mulliner et al. (2012) argued that environmental and social sustainability must also be taken into consideration for measuring the affordability in the UK. They identified 13 social sustainability indicators, such
as availability of affordable home ownership products, safety (crime level),
quality of housing, and access to public services and facilities. In addition, they identified four environmental sustainability indicators namely, energy efficiency
of housing, availability of waste management facilities, and presence of environmental problems. Other studies suggested more planning, management,
and regulatory factors such as, density and mixed-use development, growth
management initiatives, regulatory tax, local land use controls, and building
regulations (Nelson et al., 2002; Aurand, 201 O; Cervero and Duncan 2002b; Cheung et al. 2009; Glaeser and Gyourko 2001; Quigley et al. 2004).
Soheil Sabri, Ahmad Nazri M. Ludin & Foziah Johar
Assessment of Neighbourhood Affordability based 011 Housing and Tram/JOrtation Costs in Kuala Lumpur, Malaysia
In Malaysian context, studies on housing quality and affordability have indicated the importance of neighbourhood facilities, environment, housing costs and types, and length of residency (Salleh 2008; Tan 2012; Salfarina et al. 2011; Moh it et al. 20 l 0). Sal farina et al. (2011) proposed to include the quality of life and satisfaction on housing and neighbourhood conditions in measuring affordability of housing in Malaysia. Similar to the argument of Bogdon and Can ( 1997), Sal farina et al. (201 1) agreed that besides house price, the Malaysian urban residents are also concerned about location, neighbourhood, and distance from work place. In addition, the period of housing ownership which influences the socio-cultural interactions as well as access to religious facilities are considered by Malaysian households. However, these factors have yet to be included in measuring the affordability of housing in neighbourhood level in the Malaysian context.
The Malaysian government has been committed to provide adequate, affordable and quality housing for all Malaysia, particularly the low income group as addressed by the Seventh ( 1996-2000), Eight (2001-2005), Ninth (2006-2010), and Tenth (201 I -2012) Malaysia plans (Government of Malaysia, 1996, 200 I, 2006, 20 I 0). As a strategy for transportation planning, the Ninth Malaysia Plan suggested that the commuter, LRT and monorail systems be improved by taking into account the growth of new residential areas, new commercial centres and complexes, new public infrastructure such as schools and also population growth and density around transportation networks (Government of Malaysia 2006). Nevertheless, these systems need to be integrated comprehensively with a wider network in order to become more effective. The Tenth Malaysia Plan 2011-2015 initiated the Urban Public Transport as one of six National Key Result Areas (NKRA) which to considerably increase public transport ridership in three urban areas: Greater KL, Pulau Pinang and Johor Bahru. This plan promotes mixed-use developments, which calls for building high-density mixed-use developments, which must be integrated with a well-functioning public transport system. However, no attempt was made to quantify the association between TOD and affordable housing in implementing the government initiatives.
The findings from literature indicate that most factors related to affordable housing and TOD are similar and interchangeable. Both of them seek to provide a reliable quality of life for households. However, affordable housing and TOD as smart growth components are likely to be in controversy (Cervera 2007). Hence, a supportive policy should foster the affordable housing implementation in well-serviced locations of the city. Real affordable housing
PLANNING MALAYSIA
Geospatial Analysis in Urban Planning
index should serve as a decision support tool to help the government and other advocates to formulate accurate policies.
METHOD AND MODEL
Since this study is considering both affordable housing and TOD as the components of smart growth, it would be relevant if the meaning of affordability is redefined using new components such as neighbourhood characteristics, accessibility, and socio-economic factors. The Centre for Neighbourhood Technology (CNT) has introduced a new affordability index, called "H
+
T Affordability Index", by adopting housing and transportation costs (Haas et al. 2008). The index is tested on several US metropolitan areas. To date, there is no report on the application of this index on international level. Nevertheless, in order to adopt the H+ T
affordable index on other cities than US, it is necessary to consider the local characteristics and requirements. This section presents the new conceptualisation of H+
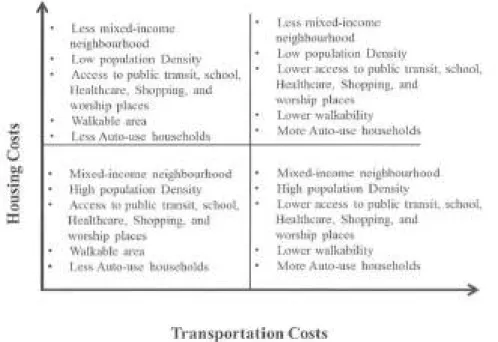
T affordable index based on Malaysian context.The neighbourhood characteristics determine housing type, affluency of households and the amount of money spent on transportation, thus the characteristics outline the transportation demand (Dissanayake et al. 2012). The neighbourhood characteristics can be divided into two: physical, and accessibility. The former characteristics are density, walkability, and availability and quality of transit service. The later characteristics include access to facilities like shopping, health centre, school, and entertainment or access to job. Neighbourhoods with all these characteristics are considered as "location
efficient" (Soo et al. 2008), where the household cost is lower than the others.
These costs should be considered in the housing affordability standards which
can be used in allocating low-income housing incentives and schemes. Figure 1, indicates the conceptualization of affordability index based on housing and transportation costs in Malaysian context. Providing both housing and transportation facilities allow low-income households to get access to better quality of life. This combination also provides a substantial incentive to the private sector to invest in transit-oriented locations, and supports the public sector in making investments that reduce household transportation costs. The affordability of a home, therefore, can be calculated based on the market value
and the transportation costs acquired in each location. It is possible also to perfo1m the measurement in both regional and local levels. In both levels, the decision makers can investigate the different needs of communities and the distribution of services, thus enhancing affordability.
Soheil Sabri, Ahmad Na:ri M. Ludi11 & Foziah Johar
Assess111e111 of Neighbourhood Affordabilily based on Housing and Tra11sportatio11 Costs in Kuala Lumpur, Malaysia
Affordability Index Model
There are three general factors in calculating affordability index (Al), namely housing cost (He), transportation cost (Tc) and neighbourhood income (N1). The housing cost includes current housing sales price and rents, while transportation cost is measured based on the sum of auto ownership, auto use, and public transit costs as three separate components. The neighbourhood income is the average income of households in the neighbourhood.
(Eq. I)
The three components of transportation cost are the dependent variables which are affected by nine independent variables, seven which are built environment variables, and two are household variables. Table I includes all the dependent variables and Table 2 summarizes the independent variables. These variables represent the neighbourhood and socio-economic characteristics
that affect the household transportation costs. The resolution of the model is based on the census data tract, although the best resolution would be at the scale
of enumeration block that represents the neighbourhood characteristics.
"'
....
"'
0u
OJ)=
·;;;=
0 ~Less mixed-income
neighbourhood
Low population Density
Access to public transit, school, llealthcarc, Shopping, and worship places
Walkable area
Less Auto-use households
Mixed-income neighbourhood
I Iigh population Density Access to public transit, school, lleallhcare, Shopping, and worship places
Walkable area
Less Auto-use households
Less mixed-income neighbourhood
Low population Density
Lower access to public transit, school, Healthcare, Shopping, and
worship places
Lower walkability
More Auto-use households
Mixed-income neighbourhood
I Iigh population Density
Lower access to public transit. school. lleallhcare, Shopping, and
worship places
Lower walkability
More Auto-use households
...
Transportation Costs
Figure I: Conceptual framework for Affordability Index
PLANNING MALAYSIA Geospatial Analysis in Urban Planning
d
Table 1: Deoen ent Variables in the Transoortat1on
c
ost Mo di eDependent Variables Source Purpose
Auto ownership (vehicles Calculated based on independent To determine the per household) household and local environment number of
auto-variables ownership by each
household and ownership costs Auto use (annual miles Calculated based on household To detem1ine the driven per household) travel survey and vehicle miles mileage a household
travelled fitted to the independent drives each vehicle and
variables usage costs
Transit rides per day Calculated based on independent To determine the household and local environment number of transit riders variables per day per household
d
Table 2: In eoendent Variables in Transport
c
ost Mo di e.Independent Variables Purpose
Household per residential area unit Measures the density, which influences auto
(e.g. Acre, Hectare) ownership and use
Household per total area unit Measures the density, which influences auto
(e.g. Acre, Hectare) ownership and use
Average block size in area unit Contributes to the walkability of area, which (e.g. Acre, Hectare) influences on three dependent variables Transit Connectivity Index Availability and extent of transit, which
influence transit use
Distance to job centre Access to job influences auto-ownership and auto-use
Job density and access ·Number of jobs per square area unit
(e.g. Mile, Km) Influences three dependent variables
Access to facilities Existence of nearby services influences three dependent variables
Household income Influences auto-ownership and use Household size Influences auto-ownership and use
A spatial interaction model determines proximity to the employment
centres (Birkin et al. 1996). It considers the number of and distance to all
available jobs related to the neighbourhood. The flow of people is calculated by
two main hypotheses: 1. Flows between residential areas and job centres will be proportional to the attractiveness of the job centre rather than all other
Soheil Sabri, Ahmad Nav·i M. Ludin & Foziah Johar
Assessment of Neighbourhood Affordability based 011 Housing and Transportation Costs in Kuala Lumpur,
Malaysia
competing destinations. 2. Flows between residential areas and job centres will
be propo1tional to the relative accessibility of that centre rather than other competing centres (Equation Eq. 2).
F .. =A .xQ.xW.xj(d . .) (Eq. 2) lj l l j lj
Where, F .. is the job accessibility,
o.
is the total number of potential~ l
job seekers in the neighbourhood (representing the demand factor),
w.
is a jmeasure of the attractiveness of centre), di) is the distance from the centre of
the neighbourhood i to the job centre), and Ai is a balancing factor wich takes
account of the competition and ensures that all demand is allocated to job
centres in the region. It is written as:
A.=1/
I
w.xj(d .. ) (Eq. 3)l . .I lj
j
fn order to estimate the three dependent variables of transportation cost, namely, auto ownership, auto use, and transit use, different methods and data
sources should be used. The auto ownership in each neighbourhood is
determined based on the vehicles per household, and the costs are based on Malaysian standards and available data on depreciation, finance charges,
insurance, and license, registration and taxes. Similarly, auto use should
consider the local costs such as fuel price, maintenance, and repairs.
The transit use costs also are very dependent on data availability. There are several sources to estimate the transit use costs such as the report on total
revenue of transit agencies, and reports on total passenger trips (Ministry of
Transportation, 20 I 0).
The general model of transportation cost is presented in Equation Eq.4. Auto ownership (Au ), auto use (Au ), and public transpo1t (Pub
1) are functions
0 u
of the local environment
cv,
e
)
characteristics, and household income and size(V Hh).
(Eq.4)
And
(Eq. 5)
PLANNING MALA YSL4 Geospatial Analysis in Urban Planning
In Equation Eq.4, Ttc is the total transportation cost, andC Auo' C Auu
,and C Pubt are cost factors of auto ownership, auto use, and public transit use
respectively. Similarly,FA , FA , and Fp b are functions of the independent
UO UU U t
variables for auto ownership, auto use, and public transit uses respectively. In order to construct the regression equations, each variable should be tested separately for two reasons. First, it determines the distribution of the sample, and second it shows the strength ofrelationship to the variable.
CASE STUDY AND SAMPLE SELECTION
Kuala Lumpur is selected for the case study which is the only urban area that
receives the transit service by both bus and light rail transit (LRT). The affordability of housing also is under quest in this city due to the concentration of services (Tan 2012). The 2010 Malaysian household consumption reported that families spent about a quarter of their income on food, followed by housing at nearly 20%. The expenditure on transportation constitutes the third item at 13.4% (Bank Negara 2010). According to the Department of statistics Malaysia (2011), generally, the average monthly household expenditure increased by 88.6% from RMl,161 in 1993/94 to RM 2,190 in 2009/10. A substantial increase was reported for housing, water, electricity, gas and other fuels (102.0%), as well as transport (94.6%) (Figure 2). It is assumed, however, that the figure is different in Kuala Lumpur as the housing price and transportation cost is higher than other parts of the country.
Soheil Sabri, Ahmad Nazri M. L11di11 & Fo~iah Johar
Assess111e111 of Neighbourhood Affordability based 011 Housing a11d Tra11sportatio11 Costs i11 Kuala Lumpur, Malaysia
l
15001000
SOO
199&'99
-f1nhW1c. M1wlltkt tq•p•tal ud r11d1t M1wWd •••INllK1' Rtcrn•• unlm aid cWltrt
-AlrtMlc b«1mra1H •blm Uni~
- Ed1nll11
-A\tnCt lltlCM)' npttclflrtpn llN\tll .. d
Ytar
200.t/05 2009110
2192
-Rnb1r11b1Ml10Cth
-1111\11&. ••trr.~mrict~·. in,., •Orr hlth - c••ntni••
\DKril11to" &tock •d ~mlrn
__J
Figure 2: Average monthly household expenditure, Malaysia, 199311994-2009/2010.
Sources: Adopted from Depan111e11t of Stati.stic.1· Malaysia (2011 ).
A low-cost house in Kuala Lumpur is generally priced at RM 42,000 which is considerably higher than other low-cost houses in other parts of Peninsular Malaysia, which is from RM 25,000 to RM 32,000. Thus, a household with a monthly income of less than RM 2,500 in Kuala Lumpur will
have difficulties to spend only 20% for housing. The transportation cost, however, maybe less than other parts of the country in case the public transport is available for such households.
The traditional measure of affordability, however, ignores transportation costs which incur relatively high proportion of mcome. Combining housing and transportation costs offers an expanded view of affordability. ln order to test this claim, three different neighbourhoods (Tamans) in Kuala Lumpur are selected. These are Taman Melati, Taman Setiawangsa, and Taman Teratai Mewah (Figure 3).
·
+
•·
~Rail line
• Station
Kuala Lumpur
-==--=~---====---•Meters
0 1,300 2,600 5,200 7,800 10,400
PLANNING MALA YSJA
Geospatial Analysis in Urban Planning
Figure 3: Location ofTaman Teratai Mewah, Taman Melati, and Taman Setiawangsa in Kuala Lumpur.
Taman Melati and Setiawangsa are located in close proximity to two of
Kelana Jaya LRT stations. The third Taman is relatively far from the nearest
LRT station at 3.7 Km. Table 3 indicates the distance of each neighbourhood
from the nearest LRT station. The density of bus stops in Taman Teratai Mewah
is lower than two other neighbourhoods.
Soheil Sabri, Ahmad Nazri M. ludi11 & Foziah Johar
Assessment of Neighbourhood Affordability based 011 /-/011si11g a11d Transportation Costs in Kuala Lumpur, Malaysia
T bi a e 3
o·
1stance to N ea rest LRTS tat1on an d tie um er o I N b fB us S tops.Neigbourhood Station Distance (km) Bus Stops
Teratai Mewah Wangsa Maju 3.7
Melati 3.7 2
Sentul Timur 4.4
Melati Melati 1.4
4
Terminal Putra 1.2
Setiawangsa Setiawangsa 1.8 8
The affordability of residential buildings in the three neighbourhoods is
measured and mapped based on the income and rental price. The measurement of affordability is based on the classic definition that considers the percentage of income spend on housing and maintenance (Figure 4). The percentage of housing expenditure in Taman Melati is between 18% and 24%, while the percentage in other two neighbourhoods is between 20% and 24%. ft means that the housing price and rental in Taman Melati are slightly more affordable than the other two, which is most likely due to existing public housing schemes such as "Public Housing Sri Tioman I" and "Public Housing Sri Tioman 11". Despite the existence of medium-high cost housing in Taman Melati (Melati Utama Condominium), the housing expenditure remains at 18%.
~ Rail line • Station
L J%18
L J%20
L J%23
~ %24
Taman Te111tal Mewah
-:=::1~::::11----====---•Meters
0 350 700 1,400 2,100 2,800
PLANNING MALA YS/A Geospatial Analysis in Urban Planning
Taman Sellawangaa
Figure 4: Percentage of Households' Expenditure on Housing
In Taman Teratai Mewah, the majority of residential buildings are
medium-cost houses and the lowest rental value is RM 600. However, there are
residents earning RM 2,800 a month, which are categorized as low-income,
living in these houses. They would have to spend up to 24% of their income for
housing.
Soheil Sabri, Ahmad Nazri M. Ludin & Foziah Johar
Assess111e111 of Neighbourhood Affordability based 011 Ho11si11g and Transportatio11 Costs i11 Kuala Lumpur, Malaysia
ln Taman Setiawangsa there is a combination of low-cost (e.g., Menara Sri Pulai), medium-cost (e.g., Sri Cendana), and medium-high cost housing (e.g, Putra Apartment). The average rental value ranged from RM 300 in Menara Sri Pulai in Menara to RM I, OOO in Putra Apartment.
In order to measure the transportation cost, the independent variables
are extracted from several databases. As mentioned before, the transportation
services are different for each neighbourhood. Taman Melati has the best combination of transit rail and bus routes and stations, which explained the development of medium-high cost residential buildings during the last six years. ln contrast, Taman Teratai Mewah is receiving the lowest public transportation service. The number of bus stops in this neighbourhood is as low as two; one
near to residential area and the second one closed to the local shopping centre.
Table 3 indicates that the nearest train station to Taman Teratai Mewah, which is twice farther than the other two neighbourhoods.
The number of bus routes and stops are higher in Taman Setiawangsa
than the other two neighbourhoods. However, there is a poor connection between train station and bus services in this neighbourhood. Thus, the
transportation cost for households is affected as they have to change the transport two times to reach the train station. The straight distance of Setiawangsa LRT station to the study area is about 1.6 km. It is expected that access to the LRT station has to be supported by bus services. Conversely, the nearest bus stops to this station are about 400 meters, which adds to frustration in changing several modes of transport and consequently, a decline in ridership.
MODEL IMPLEMENTATION AND RESULTS
Table 4 shows the independent variables for each of the three neighbourhoods.
The household costs are measured separately based on the tenure status, allowing the affordability index to be measured for both owner and tenant resident types.
As can be seen in Table 4, despite the lower annual median household income in Taman Teratai Mewah, the average vehicle per household as well as
the percentage of workers using private cars for the daily commute are higher.
This is confirmed by the transit connectivity index, which is low in Teratai Mewah compared to the other two neighbourhoods.
PLANNING MALAYSIA
Geosparial Analysis in Urban Pla1111i11g
Table 4: Background information on three neighbourhoods ofMelati, Setiawangsa, and Teratai Mewah
Independent Indicator Taman Ta man Taman Teratai
variable Melati Setiawangsa Mew ah
Demographics Number of
3,279 2,166 1,196
household
Avg. household size 4.2 4.1 3.5
Income Factors Annual median
household income 33,000 45,500 28,500
(RM)
Annual median
18,000- 18,000
-household income 18,000- 39,000
range (RM) 39,000 90,000
Density Walkability
1.18 2.00 5.2
Measures
A vg. households I
30.3 49.98 23.05
residential acre
Jobs I sq. mi. 21 65 5
Access to Percent commuting
10% 10% 7%
transit and jobs by transit Transit
High Medium Low
Connectivity Index Housing and Avg. monthly
transportation mortgage payment 707 778 647
cost indicators (RM)
Avg. monthly rental
590 710 500
payment (RM)
To calculate the total transportation costs, values for the unit of each
component are determined. Ultimately, the aggregation of values concluded the specific transportation cost of each neighbourhood.
Auto Ownership Costs
There are several variables 111 auto ownership that can be assumed as fixed
values in calculating the total cost. These are depreciation, finance charges, insurance, license, registration and taxes. Generally, the most used cars for low and medium-income households in Malaysia are the local productions. In order to cover almost all engine classes, four years old Proton Persona with engine capacity of 1600cc is considered. The total ownership cost is estimated at RM14,000 based on usage miles per annum. Table 5 shows the percentage of each variable in estimating the car ownership cost.
Soheil Sabri, Ahmad Nazri M. L11di11 & Foziah Johar
Assessment of Neighbourhood Affordability based on Housing and Transportation Costs in Kuala Lumpur, Malaysia
T a bi 5 A e uto 0 wners hIP ' C ost C a cu at1011. I I .
Total cost Depreciation Finance Insurance llegistrntion, Ownership 1>er mile per mile charges per mile licenses, tax cost 1>er mile
per mile
Percent 100.00 35.00 27.00 15.00 3.00 20.00
Value(RM) 0.96 0.34 0.26 0.14 0.029 0.77
Total (RM) 13,520 4,732 3,650 2,028 405 10,816
Auto Use Costs
Three variables are identified for auto use costs in this study, namely, fuel,
maintenance, and repairs. These variables are largely different depending on
type, age and level of usage. For simplicity, Proton Persona is again used to calculate the auto use cost. The maintenance and repairs per mile are taken as 5% and 2% of the total price, which are equivalent to RM0.07 and RM0.03 per mile respectively.
The fuel cost is calculated based on the 20 I 0 price of regular petrol, which is RM 1.9 per litre. Thus, the fuel cost per mile is RM0.26, assuming the fuel consumption is 8.5 litre for 62.137 miles (equivalent to I 00 kilometres). The total auto use cost, which is equal to RM 0.35 per mile (0.06
+
0.03+
0.26), is then applied to the modelled results of average vehicle miles travelled (VMT) by each household. The VMT for each neighbourhood is calculated based on trip generated by each household, data of which is obtained from the Kuala Lumpur City Hall.Transit Use Costs
According to the Transport Statistics report (Ministry of Transportation 2010),
the number of passenger trips in Malaysia has risen from 52.5 million in 2001 to
58 million passengers in 2010. Although, the highest number of passengers was
recorded at 60.2 million in 2006, the 20 I 0 figure is still remarkable. This
statistic forms the basis for transit use cost in the current research.
The average fare for Kelana Jaya Line is RM 1.6, which is calculated based on the minimum RM0.7 per station and the maximum RM2.5 for full
length of trip in 20 I 0 (RapidKL, 2011 ). The breakdown of total transportation cost in each neighbourhood is indicated in Table 6.
PLANNING MALAYSIA
Geosparial A11alysis i11 Urba11 Pla1111i11g
T a e bi 6 B rea kd own o fT IT ota ranspo rt at1on C ost . m ac E h N e1. hb g1 our oh o d
Taman Melati Ta man Taman Teratai
Setiawangsa Mew ah
Auto ownership
12,979 14,061 17,306
cost (RM)
Auto use cost (RM) 445 570 579
Transit cost (RM) 2,203 1,421 469
Transportation
13,424 16,051 18,353
cost (RM)
It can be seen that in Taman Melati, which has relatively efficient transport coverage, the transportation costs are far less than the other two neighbourhoods. This implies that the lack of public transport in Taman Teratai
Mewah does contribute to higher transportation cost. Basically, auto ownership contributes to the higher transportation cost. The study shows that if the total transportation cost as a percentage of household income is deducted from household expenditure, the affordability index is different.
The results of combined housing and transpo1tation costs, as shown by Table 7, indicate that Taman Setiawangsa offers more affordable opportunity
than the other two neighbourhoods. Taman Melati is the second affordable area for low- and medium-income residents. Ultimately, Taman Teratai Mewah is
not affordable, with risk of spending up to 90% of household income on housing and transportation.
T ba e i 7 H ousmg an dT ransportat10n
c
osts 111 t h e Th ree eIJ N . hb our h oo s dTaman Melati Ta man Taman Teratai
Setiawangsa Mew ah
Median income (RM) 33,000 45,500 28,500
Annual transportation costs
13,424 16,051 18,353
(RM)
Transportation costs as
40% 35% 64%
percentage of income Average housing cost as
21.2% 22% 22.4%
percentage of income Housing and transportation
66% 56% 91%
cost for owners
Housing and transportation
61% 54% 85%
cost for renters
It was expected that Taman Melati is more affordable than Taman
Setiawangsa, however, since the median annual income in this neighbourhood is
lower than the other two, affordability index is lower as well. Despite lower
Soheil Sabri, Ahmad Nazri M. Ludi11 & Foziah Johar
Assessmem of Neighbourhood Affordability based 011 Housing and Tra11spor1a1io11 Costs i11 Kuala Lumpur, Malaysia
median household income in Taman Teratai Mewah, the affordability is low due to poor public transport coverage. The results of this study show that housing provisions without considering the transportation costs is not representing true affordability of a neighbourhood.
DISCUSSION AND POLICY IMPLICATION
The purpose of this study is to provide guiding principles for development of
affordable housing with respect to TOD and affordability concepts. The
conceptual framework, considers the socio-economic, population density, accessibility, neighbourhood physical characteristics, and auto-use criteria in
order to examine the housing and transportation costs. Overall, our findings are
consistent with previous research in showing that considering transportation
costs incurred by the location and characteristics of neighbourhood is necessary in measuring affordability of a neighbourhood (Holtzclaw et al. 2002; Hess and
Almeida 2007; Haas et al. 2008). ln addition, unlike the previous studies on measuring the affordability and satisfaction of housing in Malaysian context (Sal farina et al. 20 I 1; Salleh 2008; Moh it et al. 20 l 0), we examined the association of neighbourhood's physical characteristics (e.g Average block size, walkability, etc.) with housing and transportation costs that indicates the extent
in which a neighbourhood satisfies the requirements of all income-groups.
Specifically, two dependent variables of auto ownership and auto use
were significant predictors of transportation costs, whereby, access to jobs and
public facilities as independent variables contributed more than the others. Consistent with the research on "location efficient neighbourhood" (Holtzclaw et al. 2002) and sustainable housing affordability (Mulliner et al. 2012), our
findings suggest that when neighbourhoods are located close to job centres and other urban facilities, residents are most likely to use public transpo1t. This is more apparent when there is a high or medium level of interconnection between
residential blocks and transit stations. However, no relation was found in
walkability and public transport usage. A possible explanation is that the
neighbourhood with high value of walkability has a low interconnectivity index.
In contrast, neighbourhoods with low value of walkability have high and
medium interconnectivity index. Since walkability is measured by the average
block size, smaller block sizes are an indication of greater streets network,
where housing and other amenities are within walking distance. However, a
high value of walkability cannot indicate better public transport usage if there is a poor interconnection of residential blocks and transit stations.
PLANNING MALAYSIA
Geospatial Analysis in Urban Planning
The evidence from this study suggests that despite the existence of
medium- and high-medium cost housing types, neighbourhoods with good
public transportation services have higher affordability index. The other major finding was that combining different modes of transport, motorised and non-motorised (i.e. walking, bus, train) contribute to higher affordability of the neighbourhood. One explanation for this is that neighbourhoods with high accessibility to different modes of transport incur considerably lower transportation costs than the others. It is interesting to note that the average
household's expenditure on transport at the three neighbourhoods (40% at
Melati, 35% at Setiawangsa, and 64% at Teratai Mewah) in this study is
significantly higher than the 2009/2010 national average which is 14.9% (Department of Statistics Malaysia 2011). This can be explained by the higher auto ownership and use in Kuala Lumpur than the other parts of the country. Alternatively, in this study more factors are considered in calculating the transportation costs (i.e. finance charges, insurance per mile, registration, licenses, and tax per miles) that may not be used in the government's figure. This is a good reason for providing more varied modes of transport in order to reduce the household's transportation costs.
Our findings suggest that a modified affordability index is an
appropriate tool for measuring affordability of a neighbourhood. For this tool the gravity model is replaced by spatial interaction model in measuring job accessibility. ln this study, two concepts are added to the H
+
T affordabilityindex. These are the stochastic behaviour of households in selecting the job centre, and the interaction of attractiveness and accessibility in job selection by households. This model has also considered more variables in determining the affordability of a neighbourhood. There are other variables, however, that may be important in decision making such as the number and age of children, multiple occupied homes, especially in studentified areas (Sabri et al. 2010). The spatial factors can also be considered in this model, such as safety and
security, weather condition, pedestrian environment, and quality of services
(Haas et al. 2008).
Such tool can be used to develop a development framework which can
accommodate a rapidly urbanising city into a more sustainable urban growth. Central to an entire discipline of TOD is the concept of housing and land use
governance. ln a federated system of government, the land use governance can
be simply conducted by all levels of government (Knaap and Hacco 2007).
However, the dominant role in land use governance is played by local
governments (Hawkins 2011). Kuala Lumpur, envisaged to be a world class city
is expected to offer a world class living environment having among other things adequate housing and efficient transportation (Kuala Lumpur City Hall 2008).
Soheil Sabri, Ahmad Nazri M. L11di11 & Foziah Johar
Assess111e11t of Neighbourhood Affordability based 011 I-lousing and Tramportatio11 Costs in Kuala Lumpur, Malaysia
Although the Kuala Lumpur Master Plan promised to implement Travel
Demand Management measures, particularly in increasing public transport usage, a more holistic manner of city design in accordance with TOD principles should be considered to allow affordable housing environment.
CONCLUSION
The present research adds to the growing literature on combining transport and housing costs to measure affordability. It concludes that improved affordability index, which combines housing and transportation indicators is an appropriate tool for examining affordability of Malaysian neighbourhoods. Based on the implementation of the affordable index in three neighbourhoods of Kuala Lumpur, our findings confirmed the need to address affordability by both the housing and transportation costs.
Despite the deficiencies, this study is able to highlight the impact of spatial characteristics on neighbourhood's affordability. The interactions of transportation, housing market, and socio-economic characteristics are illustrated in constructing the morphology of neighbourhood and the level of satisfactory in living area. More research should be conducted to explain other possible factors based on various neighbourhoods.
ACKNOWLEDGMENT
The authors would like to express their appreciation to the Universiti Teknologi Malaysia, Johor, Malaysia for sponsoring this research through Fundamental
Research Grant Scheme (FRGS) from 2009 - 2011, vote number: 78438. Thanks are due to Mr. Ismail Mohd Yusof Deputy Director of Urban Planning Department, City Hall Kuala Lumpur for his generous assistance in providing valuable information for the study.
REFERENCES
PLANNING MALA YSL4 Geospatial Analysis in Urban Planning
Aurand, A. (2010). Density, Housing Types and Mixed Land Use: Smart Tools
for Affordable Housing? Urban Studies, 47, 1015-1036.
Bank Negara, M. (2010). Bank Negara Malaysia Annual Report 2010. Technical Report Bank Negara Malaysia Kuala Lumpur.
Belzer, D., Hickey, R., & Lawson, W. (2007). The Case for Mixed-Income
Transit-Oriented Development in the Denver Region. Technical Report. Birkin, M., Clarke, G., Clarke, M., & Wilson, A. (1996). Intelligent GIS:
Location Decisions and Strategic Planning. Cambridge Science Park,
Cambridge, UK: Geoinformation International.
Bogdon, A. S., & Can, A. (1997). Indicators of Local Housing Affordability:
Comparative and Spatial Approaches. Real Estate Economics, 25,
43-80.
Calthorpe, P. (1993). The Next American Metropolis: Ecology, Community,
and the American Dream. New York: Princeton Architectural Press.
Cervero, R. (2007). Transit-orinted development in the us: Contemporary
practices, impacts and policy directions. In Incentives, Regulations and
Plans The Rolw of States and Nation-states in Smart Growth Planning
(pp. 149-167). Cornwall, UK: Edward Elgar Publishing.
Cervero, R., & Duncan, M. (2001). Rail Transit's Value-Added: Effects of
Proximity to Light and Commuter Rail Transit on Commercial Land
Values in Santa Clara County, California. Technical Report National Association of Realtors, Urban Land Institute.
Cervero, R., & Duncan, M. (2002a). Land Value Impacts of Rail Transit Services in Los Angeles County. Technical Report National Association of Realtors, Urban Land Institute.
Cervero, R., & Duncan, M. (2002b). Land Value Impacts of Rail Transit
Services in San Diego County. Technical Report National Association
of Realtors, Urban Land Institute.
Chakraborty, A., & Mishra, S. (2013). Land use and transit ridership
connections: Implications for state-level planning agencies. Land Use Policy, 30, 458-469.
Cheung, R., Ihlanfeldt, K., & Mayock, T. (2009). The Incidence of the Land Use Regulatory Tax. Real Estate Economics, 37, 675-704.
Debrezion, G., Pels, E., & Rietveld, P. (2007). The Impact of Railway Stations
on Residential and Commercial Property Value: A Meta-analysis. The
Journal of Real Estate Finance and Economics, 35, 161-180.
Department Of Statistics Malaysia, M. (2011). Household Expenditure Trend 1993/94-2009/10.
Dissanayake, D., Kurauchi, S., Morikawa, T., & Ohashi, S. (2012). Inter
-regional and Inter-temporal Analysis of Travel Behaviour for Asian
Soheil Sabri, Ahmad Nazri M. L11di11 & Foziah Johar
Assess111e111 of Neighbourhood Affordabiliry based 011 /-/011si11g and Tra11.1por1a1io11 Costs in Kuala Lumpur, Malaysia
Metropolitan cities: Case studies of Bangkok, Kuala Lumpur, Manila,
and Nagoya. Transport Policy, 19, 36-46.
Duncan, M. (2011 ). The I rnpact of Transit-oriented Development on Housing
Prices in San Diego, CA. Urban Studies, 48, I 01-127.
Glaeser, E. L., & Gyourko, J. (200 I). The Impact of Building Restrictions on
Housing Affordability. Federal Reserve Bank of New York Economic
Policy Review, 9, 21-39.
Haas, P., Makarewicz, C., Benedict, A., & Bernstein, S. (2008). Estimating
Transportation Costs by Characteristics of Neighborhood and Household. Transportation Research Record: Journal of the Transportation Research Board, 2077, 62-70.
Hawkins, C. V. (2011 ). Smart Growth Policy Choice: A Resource Dependency
and Local Governance Explanation. Policy Studies Journal, 39, 679-707.
Hess, D. B., & Almeida, T. M. (2007). Impact of Proximity to Light Rail Rapid
Transit on Station-area Property Values in Buffalo, New York. Urban
Studies, 44, I 041-1068.
Holtzclaw, J., Clear, R., Dittmar, H., Goldstein, D., & Haas, P. (2002). Location
Efficiency: Neighborhood and Socio-Economic Characteristics
Determine Auto Ownership and Use - Studies in Chicago, Los Angeles
and San Francisco. Transportation Planning and Technology, 25, 1-27.
Hulchanski, J. D. (1995). The Concept of Housing Affordability: Six Contemporary Uses of the Housing Expenditure to Income Ratio. HousingSt11dies, 10,471-491.
Jacobson, J ., & Forsyth, A. (2008). Seven American TODs: Good Practices for Urban Design in Transit-Oriented Development Projects. Journal of Transport and Land Use, 51-88.
Kahn, M. E. (2007). Gentrification Trends in New Transit-Oriented
Communities: Evidence from 14 Cities That Expanded and Built Rail Transit Systems. Real Estate Economics, 35, 155-182.
Kirn, S., Ulfarsson, G., & Toddhennessy, J. (2007). Analysis of Light Rail Rider Travel Behavior: Impacts of Individual, Built Environment, and Crime
Characteristics on Transit Access. Transportation Research Part A: Policy and Practice, 41, 511-522.
Knaap, G.-J., & Haccou, H. A. (2007). Introduction: Why explore smart growth
from a trans-atlantic perspective? In Incentives, Regulations and Plans
The Rolw of States and Nation-states in Smart Growth Planning (pp. 1
-16). Cornwall, UK: Edward Elgar Publishing.
Kuala Lumpur City Hall (2008). Draft Kuala Lumpur 2020 City Plan. Kuala Lumpur. I.
PLANNING MALA YSL4
Geospatial Analysis in Urban Planning
Kutty, N. K. (2005). A New Measure of Housing Affordability: Estimates and Analytical Results. Housing Policy Debate, 16, 113-142.
Cho-yam Lau, J. (2011). Spatial Mismatch and the Affordability of Public Transport for the Poor in Singapore's New Towns. Cities, 28, 230-237. Levine, J., Inam, A., & Torng, G.-W. (2005). A Choice-Based Rationale for
Land Use and Transportation Alternatives. Journal of Planning Education and Research, 24, 317-330.
Litman, T. (2007). Evaluating rail transit benefits: A comment. Transport Policy, 14, 94-97.
Litman, T. (2012). Smart Congestion Relief Comprehensive Analysis Of Traffic Congestion Costs and Congestion Reduction Benefits. Technical Report Victoria Transport Policy Institute.
Government of Malaysia, E. M. P. (2001). Eighth Malaysia Plan 2001-2005.
Technical Report.
Government of Malaysia, N. M. P. (2006). Ninth Malaysia Plan 2006-2010. Technical Report.
Government of Malaysia, S. M. P. (1996). Seventh Malaysia Plan 1996-2000. Technical Report.
Government of Malaysia, T. M. P. (2010). Tenth Malaysia Plan 2011-2015. Technical Report.
Moh it, M. A., Ibrahim, M., & Rashid, Y. R. (2010). Assessment of Residential Satisfaction in Newly Designed Public Low-cost Housing in Kuala Lumpur, Malaysia. Habitat International, 34, 18-27.
Mu, R., & Jong, M. (2012). Establishing the Conditions for Effective Transit-oriented Development in China: the Case of Dalian. Journal of Transport Geography, 24, 234-249
Mulliner, E., Smallbone, K., & Maliene, V. (2012). An Assessment of Sustainable Housing Affordability Using a Multiple Criteria Decision Making Method. Omega, 41, 270-279
Nelson, A. C., Pendall, R., Dawkins, C. J., & Knaap, G. J. (2002). The Link Between Growth Management and Housing Affordability: The
Academic Evidence. Technical Report The Brookings Institution. PolicyLink (2008). Equitable Development Toolkit Building Regional Equity
Transit Oriented Development. Technical Report PolicyLink 1438 Webster Street Suite 303 Oakland, CA.
Quigley, J. M., Raphael, S., & Rosenthal, L. A. (2004). Local Land-use
Controls and Demographic Outcomes in a Booming Economy. Urban Studies, 41, 389-421.
RapidKL, I. P. M. T. D. (2011). Technical Visit to Rapid KL Depot, Subang (16 June 2010). Web Site.
Rimmer, P. J., & Dick, H. (2009). The City in Southeast Asia: Patterns, Processes and Policy. NUS PRESS SINGAPORE.
Soheil Sabri, Ahmad Nazri M. Ludi11 & Foziah Johar
Assessment of Neighbourhood Affordability based 011 1-Iousiug and Tmmportatio11 Costs in Kuala Lumpur, Malaysia
Sabri, S., M Ludin, A. N., & Jaffar, A. R. (20 I 0). Geostatistical analysis of studentification: A connection between decision makers and new urban
phenomena. In Map Asia 20 I 0 & ISG 20 I 0.
Sal farina, A. G., Nor Malina, M., & Azrina, H. (201 J ). Trends, Problems and
Needs of Urban Housing in Malaysia. International Journal of Human
and Social Sciences, 5, I I 03-1 I 07.
Salleh, A. G. (2008). Neighbourhood Factors in Private Low-cost Housing in
Malaysia. Habitat International, 32, 485-493.
Seelig, T., & Phibbs, P. (2006). Beyond the Normative: Low Income Private Renters' Perspectives of Housing Affordability and Need for Housing Assistance. Urban Policy and Research, 24, 53-66.
Soo, J., Ettema, D., & Ottens, H. (2008). Analysis of Travel Time in Multiple
-Purpose Trips. Transportation Research Record: Journal of the Transportation Research Board, 2082, 56-62.
Stone, M. E. (2006). What is housing affordability? The Case for the Residual Income Approach. Housing Policy Debate, 17, 151-184.
Tan, T. H. (2012). Housing Satisfaction in Medium- and High-cost Housing: The Case of Greater Kuala Lumpur, Malaysia. Habitat International, 36, J 08-1 16.
Centre for Transit Oriented Development, C., & Centre for Neighbourhood, C. T. (2006). The Affordability Index: A New Tool for Measuring the True Affordability of a Housing Choice. Technical Report, The Brookings
Institution.
Ministry of Transportation, M. (20 I 0). Transport Statistics.
Weitz, J., & Waldner, L. S. (2002). Smart Growth Audits. Technical Report
American Planning Association.
Winston, C., & Maheshri, V. (2007). On the Social Desirability of Urban Rail Transit Systems. Journal of Urban Economics, 62, 362-382.