Investigation of Preliminary
Student Test Performance Data
Using the ANOM Statistical Tool
and Mixed Model Analysis
Anja Habus-Korbar
1, Vesna Lu
zar-Stif
ˇ
fl
er
2,3and Vanda Bazdan
11National Center for External Evaluation of Education, Zagreb, Croatia 2University Computing Centre – Srce, University of Zagreb, Croatia 3CAIR Center, Zagreb, Croatia
The goal of this paper is to demonstrate the analytical use of a statistical tool ANOM (more commonly used by quality control engineers), mixed model analysis and other statistical tools (used in social sciences) to investigate differences found in Croatian high school stu-dent performance in mathematics examinations, recently developed as part of the National Assessment project.
Keywords: National Assessment, analysis of means, ANOM, mixed models, Shewhart procedure, mathemat-ics scores
1. Introduction
This research is based on the results of the Na-tional Assessment in mathematics organized by the National Center for External Evaluation of Education (NCVVO). The objective and func-tion of NCVVO (among others) is to moni-tor and evaluate the global and regional per-formance of students in order to improve the quality of the Croatian educational system. The National Assessment is a testing procedure con-ducted on high school students with the goal of learning more about student knowledge and the educational system. It also serves as a pre-cursor for students and teachers concerning the final high school exam which will be(in future years)held as a standardized, uniform test. The paper is divided into seven sections: After the introduction and background of the National Assessment project, Section 3 concentrates on
the description and history of the ANOM pro-cedure. In Section 4 we present the global de-scriptive statistics and the distribution of scores (globally and also by programs and by different counties). The Shewhart procedure was used for visualization of the differences among pro-grams and counties. In Section 5, we cover the results obtained from three-way analysis of vari-ance. After detecting the differences among dif-ferent programs and counties it was reasonable to suspect that the interactions among these fac-tors might be significant. Section 6 illustrates the use of the ANOM procedure for two-way effects, applied due to the results of previous analysis. For the final analysis, in Section 7, a mixed model(with schools and classes as ran-dom, nested effects)was developed.
2. Background
The survey was carried out on a random sam-ple of size 2664, 2nd grade students attending
Croatian gymnasium programs.
288 Investigation of Preliminary Student Test Performance Data Using the ANOM Statistical Tool...
observe if differences existed for different gym-nasium programs. In Croatian schools there are four types of gymnasium programs: general, language, mathematics and classical. The final test results for all subjects and across different counties, programs and schools were presented to the general public.
In this paper we focus only on the data avail-able at the time and the statistical methodology used to detect key differences among different groups of high school students.
3. Analysis of Means (ANOM)
After applying standard procedures for describ-ing the data, the Shewhart procedure for visual-izing performance across different groups and the three-way ANOVA to test for significant ef-fects and interactions, it was necessary to select a procedure which would test for any difference between means of the different programs ( dis-tinguish above-average programs from those which are at or below the average). Above all, the results had to be easy to interpret for most of the general public.
Originally studied by Laplace in 1827, Analy-sis of Means has become a common approach to identifying any group that is performing dif-ferently from the rest.
It compares the absolute deviations of group means from their overall mean. Halperin and others derived a version of this method in the form of a multiple significance test in 1955. Ott developed a graphical representation for the test and introduced the term "analysis of means" in 1967. Refer to Ott(1967).
P. R. Nelson (1982) introduced exact critical values for ANOM when the groups have equal sample sizes and (also in 1991) developed a method for computing exact critical values for ANOM when group sample sizes are not equal. Unlike ANOVA, which tests for significant dif-ference among the group means, Analysis of Means identifies those means which are sig-nificantly different from the overall(or grand) mean.
The ANOM is a type of multiple comparison procedure. The results of the analysis are sum-marized in an ANOM decision chart. This chart is similar in appearance to a control chart. It has a centerline, located at the overall mean(rate or
proportion)and upper and lower decision lim-its. Group means (or rates or proportions)are plotted on this chart and if one falls beyond a decision limit, then that group is said to be sta-tistically different from the overall mean (rate or proportion). Practical as well as statistical significance can be easily assessed. It is easy to understand, and sheds light on the nature of the differences among the populations.
The underlying model assumptions for ANOM are the same as for fixed effects ANOVA – in-dependent random samples from normal popu-lations with homogeneous variances.
4. Data and Descriptive Statistics
Prior to the analysis, each student score was di-vided by the highest possible score(maximum) to yield a percent maximum score. In other words, we used a relative scale ranging from 0 to 100. (Note: Test validity and reliability anal-yses were performed, but are not part of this presentation.)
4.1. Data Distribution
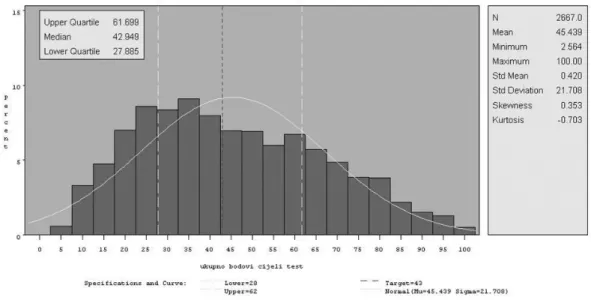
The distribution(of percent maximum mathe-matics score)is close to normal with skewness of 0.35 and kurtosis of -0.7. Since the sam-ple size was large(n=2664)we could perform further analysis, even though the assumption of the normal distribution was not met. The mean score was 45%, median was slightly lower (43%). Standard deviation was approximately 22%, which is substantially higher than stan-dard deviations for the other exams (Croatian and English percent maximum test scores each had a standard deviation of approximately 15). The distribution is shown in Figure 1.
4.2. The Shewhart procedure
Figure 1.Distribution of scores(expressed as percent maximum score)on the National Exam in mathematics.
Figure 2.Differences in achievements among four gymnasium programs.
The control limits are automatically adjusted to the varying group sizes. The legend at the bot-tom of Figure 2 reports the minimum and maxi-mum group sizes(min. n=143, max. n=1626).
From the Figure, we can see that the mean of the program labeled 320204(indicating mathemati-cal gymnasiums)is significantly above the over-all mean. Since the lower line on the boxplot represents 1st quartile, we could say that about 75% of the mathematical gymnasium students scored above the global mean. On the other
hand, the mean score of students attending the program labeled 320304 (indicating language gymnasiums)is significantly below the global mean with about 75% of scores falling below the lower control limit for the global mean.
290 Investigation of Preliminary Student Test Performance Data Using the ANOM Statistical Tool...
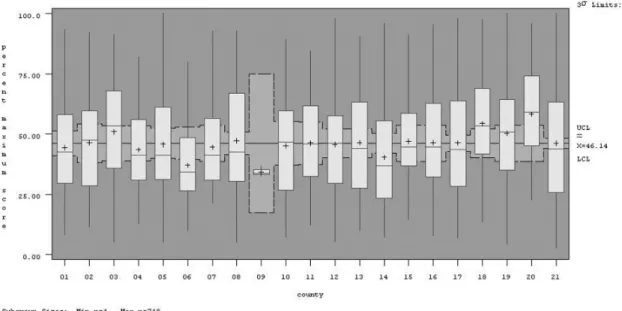
Figure 3.Differences in achievements among 21 Croatian counties.
5. Three-way Analysis of Variance
In further analysis we used a three-way analy-sis of variance to test for the differences among counties, programs and also school sizes. For school size we used (for this analysis) a binary variable(“small”/”large”), with “small” category representing schools with 100 or less students and “large” indicating those schools that had more than 100 students. The anal-ysis yielded all three significant main effects, which confirmed previous results, indicating that mathematics test scores differed both by the program and by region. Small and large schools performed differently as well, larger schools demonstrating significantly higher achievement. Significant interactions were found between county and program (F=3.45 p<0.001), be-tween county and school size (F=5.59 p<0.001) and between program and size (F=7.99 p<0.001). These results indicate that programs do differ, but these differences are contingent on the county and also on school size. The above model explains 24% of variabil-ity(R2=0.24). The interactions among county and program are visualized in Figure 4.
Blue line(squares)shows mean scores of math-ematical gymnasiums by county; yellow ( cir-cles) and green line (triangles) represent gen-eral and language mean program scores,
respec-Figure 4.Line plot(connecting means)showing the interactions among programs and counties.
tively. Classical gymnasium(not available in all counties)average results are shown using pur-ple triangles(not connected with a line). This graphical display allows us to see the differences analyzed previously. From the line plot we can-not see which programs and counties achieved significantly higher results.
6. The ANOM Procedure
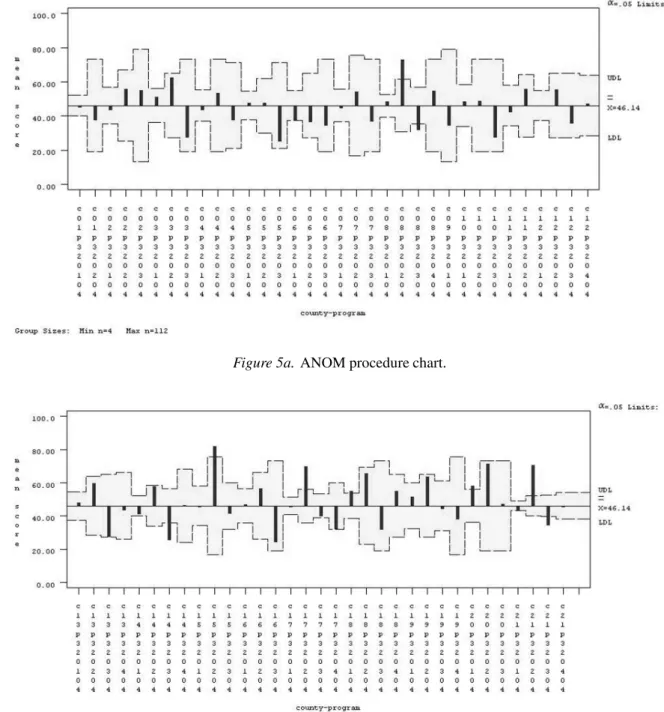
rel-Figure 5a. ANOM procedure chart.
Figure 5b.ANOM procedure chart(continued).
ative to the county), we used the ANOM proce-dure for significant two-way effects. The results by county and program are shown in Figures 5a and 5b.
The yellow field (dash lines)shows the confi-dence interval (around the global mean). The confidence interval is different across different counties and programs, due to different number of students and the variability. If the group’s mean falls above/below the confidence interval
292 Investigation of Preliminary Student Test Performance Data Using the ANOM Statistical Tool...
Alpha=.05 Limits for Mean (Adjusted for multiple testing)
Significantly different county-program SampleGroup
Size LowerLimit GroupMean AverageMean UpperLimit ExceededLimit
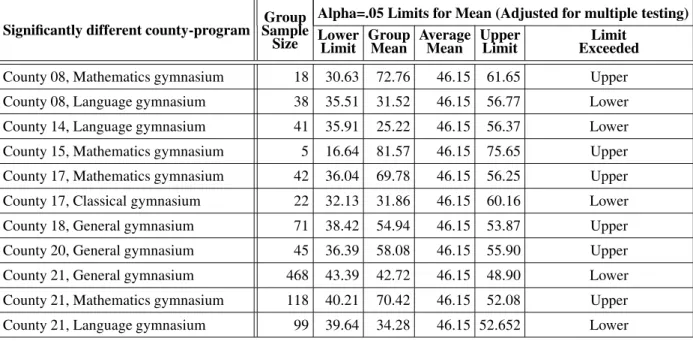
County 08, Mathematics gymnasium 18 30.63 72.76 46.15 61.65 Upper County 08, Language gymnasium 38 35.51 31.52 46.15 56.77 Lower County 14, Language gymnasium 41 35.91 25.22 46.15 56.37 Lower County 15, Mathematics gymnasium 5 16.64 81.57 46.15 75.65 Upper County 17, Mathematics gymnasium 42 36.04 69.78 46.15 56.25 Upper County 17, Classical gymnasium 22 32.13 31.86 46.15 60.16 Lower County 18, General gymnasium 71 38.42 54.94 46.15 53.87 Upper County 20, General gymnasium 45 36.39 58.08 46.15 55.90 Upper County 21, General gymnasium 468 43.39 42.72 46.15 48.90 Lower County 21, Mathematics gymnasium 118 40.21 70.42 46.15 52.08 Upper County 21, Language gymnasium 99 39.64 34.28 46.15 52.652 Lower
Table 1.County-programs scoring significantly better/worse than the average.
As part of the output of the SAS1 ANOM pro-cedure, means chart summary (shown in Table 1) can be obtained with the results for each group that is above or below the average. All data preparation, analyses, graphics and tabula-tion for the current study were performed using SAS software(licenced to NCVVO).
Cov Parm Estimate
School(County) 100.48
Class(County*School) 27.2344
Residual 292.50
Table 2.Covariance Parameter Estimates.
Effect NumDF DenDF Value PrF >F
Size 1 2224 0.86 0.3551
County 20 78 1.04 0.4308
Program 3 2224 4.41 0.0042
Size*County 16 2224 1.38 0.1440
Size*Program 3 2224 5.25 0.0013
County*Progr. 43 2224 1.48 0.0227
Table 3.Type 3 Tests of Fixed Effects.
7. The Mixed Model Analysis
For the final analysis we applied SAS MIXED (mixed model) procedure. Program, county, size of the school and the interactions were treated as fixed effects(as in the previous anal-ysis). School(within county)and class(within school and county)were treated as random ef-fects. The results are shown in Tables 2-4. Un-der the “Covariance Parameter Estimates” in Table 2 the estimates are displayed of random effects variances and the residual variance,σ2. (As was previously mentioned, this was a ran-dom sample of n=2664.)
As expected, mixed model analysis yielded slightly more conservative results than the pre-viously performed three-way ANOVA. From the results displayed in Table 3, we see that out
Program NumDF DenDF Value PrF >F
General gynasium 16 2224 1.20 0.2559 Mathematics gynasium 16 2224 1.89 0.0173 Language gynasium 14 2224 1.24 0.2363 Classical gynasium 6 2224 1.46 0.1878
Table 4.Simple effect tests of difference among counties for each program separately.
of three main effects (Size, County, Program) only Program is significant(F=5.25 p<0.001). As it might have been expected, interactions were significant between county and program (F=1.48, p=0.02) and between program and school size(F=5.59, p=0.001).
These results confirm(the outcome of the other analyses described in this paper)that the Mathe-matics scores are different across different gym-nasium programs and that the differences among the counties are not the same for all programs. Additionally, the differences among programs are not the same in “small” as in “large” schools. If we examine Table 4(for the test of differences among counties for each program separately) we can see that the only program where signif-icant differences were found across counties is the Mathematical gymnasium program.
8. Conclusion
Several analyses were conducted using the cur-rently available data on student achievement in Mathematics. Analysis of variance results showed that Mathematics scores are on aver-age significantly different across regions, pro-grams and school sizes. Analysis of means (ANOM) was used to identify and visualize the differences among those individual pro-grams/counties in which students achieved re-sults that were significantly better/worse than the average. We showed that, even though the results of Mathematical gymnasiums were glob-ally significantly above the average, this was not the case in all counties.
The final, mixed model analysis, in which we considered school and class as random (and nested)effects, gave more conservative results. We conclude that mathematics scores differ among programs, with only the mathematics program showing significant differences across the counties.
The main disadvantage of the analyses pre-sented in this research is the inability to con-trol for possible confounding variables(student socio-economic status, data on teachers and schools, etc.), data on which are currently being collected.
Once this additional information becomes avail-able, less biased estimations and comparisons of student performance will be possible. Addi-tionally, a program of longitudinal studies for
continuous measuring and monitoring of stu-dent achievement in a number of subject areas over a period of at least five years should be planned and implemented.
References
[1] P. R. NELSON,(1982), Exact Critical Points for the
Analysis of Means.Communications in Statistics – Theory and Methods, 11(6), pp. 699–709.
[2] P. R. NELSON, (1983), A Comparison of Sample
Sizes for the Analysis of Means and the Analysis of Variance.Journal of Quality Technology, 15, pp. 33–39.
[3] P. R. NELSON ANDE. J. DUDEWICZ, (2002), Ex-act Analysis of Means with Unequal Variances.
Technometrics, 44, pp. 152–160.
[4] E. R. OTT,(1967), Analysis of Means – A
Graph-ical Procedure.Industrial Quality Control, 24, pp. 101–109.
[5] W. L. SANDERS, A. M. SAXTON ANDS. P. HORN,
(1997), The Tennessee Value-added Assessment System: A Quantitative Outcomes-based Approach to Educational Assessment. In J. Millman (Ed.), Grading Teachers, Grading Schools: Is Student Achievement a Valid Educational Measure? Thou-sand Oaks, CA:Corwin Press. pp. 137–162.
[6] S. P. WRIGHT,(2004), Advantages of a Multivariate
Longitudinal Approach to Educational Value-added Assessment without Imputation.Paper presented at the National Evaluation Institute, Colorado Springs, CO, USA.
Received:June, 2008
Accepted:September, 2008
Contact addresses:
Anja Habus-Korbar National Center for External Evaluation of Education Maruli´cev trg 18 10 000 Zagreb, Croatia e-mail:[email protected]
Vesna Luzar-Stiffler, PhDˇ
University of Zagreb University Computing Centre J. Marohni´ca 5 10 000 Zagreb, Croatia e-mail:[email protected]
294 Investigation of Preliminary Student Test Performance Data Using the ANOM Statistical Tool...
ANJAHABUS-KORBAR, after finishing elementary and high school edu-cation in Croatia, USA and Italy, graduated from the Faculty of Veteri-nary Medicine at the University of Zagreb. She is currently completing her postgraduate study at the Faculty of Science, Department of Biology
(with the thesis in the area of data mining, using the data from the field of anthropology)at the University of Zagreb. After a few years with the pharmaceutical company Merck, she moved to the field of educational statistics and IT and is currently working at the National Center for External Evaluation of Education.
VESNALUZARˇ -STIFFLERis a senior researcher at the University Com-puting Centre, University of Zagreb and the Director of Statistical Meth-ods at CAIR Research Center in Zagreb, Croatia. She obtained her B.Sc. in mathematics, and her Ph.D. in computer science / compu-tational statistics from the University of Zagreb, and was awarded a Fulbright Postdoctoral Grant for research at the Department of Statis-tics, Stanford University, specializing in computational statistics and multivariate analysis. Her research interests include visualization meth-ods in data mining and computational statistics. She has been chairing the International Program Committee of the ITI (Information Tech-nology Interfaces)Conference since 2004. For the past twenty years she has taught a broad range of software-aided statistics and data min-ing courses at the University Computmin-ing Centre, University of Zagreb, Stanford University, University of Maryland, University of Naples, Uni-versity of Neuchatel(postgraduate study in statistics), SAS Institute, and at many government and business/industry institutions. Dr. Luzar-ˇ
Stiffler has consulted in the area of statistical/graphical/data mining application, clinical trials, marketing research, survey sampling, risk assessment and quality improvement with various companies( includ-ing pharmaceutical, bankinclud-ing, aeronautic, automotive, semiconductor manufacturing technology, insurance, food retail, beverage, telecom-munications)and government organizations in the US, Italy, Croatia, Slovenia, Macedonia, Romania, BiH, etc.