Reporting 8.0
The information contained herein is proprietary and confidential and cannot be disclosed or duplicated without the prior written consent of Genesys Telecommunications Laboratories, Inc.
Copyright © 1999–2010 Genesys Telecommunications Laboratories, Inc. All rights reserved.
About Genesys
Genesys Telecommunications Laboratories, Inc., a subsidiary of Alcatel-Lucent, is 100% focused on software for contact centers. Genesys recognizes that better interactions drive better business and build company reputations. Customer service solutions from Genesys deliver on this promise for Global 2000 enterprises, government organizations, and telecommunications service providers across 80 countries, directing more than 100 million customer interactions every day. Sophisticated routing and reporting across voice, e-mail, and Web channels ensure that customers are quickly connected to the best available resource—the first time. Genesys offers solutions for customer service, help desks, order desks, collections, outbound telesales and service, and workforce management. Visit www.genesyslab.com for more information.
Each product has its own documentation for online viewing at the Genesys Technical Support website or on the Documentation Library DVD, which is available from Genesys upon request. For more information, contact your sales representative.
Notice
Although reasonable effort is made to ensure that the information in this document is complete and accurate at the time of release, Genesys Telecommunications Laboratories, Inc., cannot assume responsibility for any existing errors. Changes and/or corrections to the information contained in this document may be incorporated in future versions.
Your Responsibility for Your System’s Security
You are responsible for the security of your system. Product administration to prevent unauthorized use is your responsibility. Your system administrator should read all documents provided with this product to fully understand the features available that reduce your risk of incurring charges for unlicensed use of Genesys products.
Trademarks
Genesys, the Genesys logo, and T-Server are registered trademarks of Genesys Telecommunications Laboratories, Inc. All other trademarks and trade names referred to in this document are the property of other companies. The Crystal monospace font is used by permission of Software Renovation Corporation, www.SoftwareRenovation.com.
Technical Support from VARs
If you have purchased support from a value-added reseller (VAR), please contact the VAR for technical support.
Technical Support from Genesys
If you have purchased support directly from Genesys, please contact Genesys Technical Support at the regional numbers provided on page 8. For complete contact information and procedures, refer to the Genesys Technical Support Guide.
Ordering and Licensing Information
Complete information on ordering and licensing Genesys products can be found in the Genesys Licensing Guide.
Released by
Genesys Telecommunications Laboratories, Inc. www.genesyslab.com
Table of Contents
Preface ... 7
Intended Audience... 7
Making Comments on This Document ... 8
Contacting Genesys Technical Support... 8
Chapter 1 Reporting Overview... 9
What Is Reporting?... 9
Reporting Architecture... 10
The Reporting Services ... 11
New In This Release ... 22
Chapter 2 Predeployment Measures ... 23
Supported Operating Systems ... 24
Prerequisites for Each Reporting Component ... 24
Data Sourcer... 24
Data Modeling Assistant ... 25
Data Mart/ETL Runtime ... 25
Hyperion Performance Suite... 25
CCPulse+ ... 25
Preparing the Databases ... 26
Supported RDBMSs ... 26
Calculating Database Capacity... 27
Calculating the Number of Threads ... 27
Preparing Your Database Environment ... 27
Estimating ODS Size ... 29
Estimating Data Mart Size ... 33
Distributed Architecture ... 36
Calculating the Number of Collection Units ... 36
Chapter 3 High-Availability Architecture ... 39
Overview... 39
Table of Contents
HA Architecture ... 41
Primary and Backup Data Sourcer Applications... 42
Hot Standby Mode ... 42
Deployment ... 43
Using the Data Sourcer Wizard ... 43
Modifying Your Primary Data Sourcer Application Properties for High Availability ... 44
Modifying Your Stat Server Application Object for High Availability .... 44
Chapter 4 Solution Reporting Wizards ... 45
Overview... 45
The CC Analyzer Wizard ... 46
The CCPulse+ Wizard... 46
Installing and Starting the Solution Reporting Wizards... 47
Chapter 5 Configuring Genesys Solution Reporting... 49
Invoking the Solution Reporting Wizard ... 50
Navigating the CC Analyzer Wizard ... 51
Navigating the CCPulse+ Wizard ... 51
Deploying Reporting Templates... 52
Operating the Data Sourcer Wizard ... 53
Operating the Data Modeling Assistant Wizard... 58
Operating the Data Mart Wizard... 61
Operating the Database Access Point Wizard ... 65
Operating the CCPulse+ Wizard ... 67
Summary Screen... 72
Resolving Statistical Parameter Ambiguities ... 72
Chapter 6 Installing Historical Reporting Components ... 75
Installing Data Modeling Assistant... 75
Installing Data Sourcer on Windows Platforms... 76
Installing Data Sourcer on UNIX Platforms... 78
Installing Data Mart on Windows Platforms ... 79
Installing Data Mart on UNIX Platforms ... 81
Chapter 7 Setting Up Historical Reporting ... 83
Initializing the Data Mart ... 83
Specifying ETL Service Starter Processes ... 85
Deploying ETL Runtime Using DB2 v8+ ... 85
Table of Contents
Chapter 8 Starting and Stopping Historical Reporting... 87
Starting and Stopping DMA ... 87
What Must Be Running Prior to Start... 87
Starting DMA on Windows Platforms ... 88
Stopping DMA... 90
Starting and Stopping Data Sourcer ... 90
What Must Be Running Prior to Start... 90
Starting Data Sourcer from the Solution Control Interface... 91
Starting Data Sourcer from Windows Platforms... 92
Manually Starting Data Sourcer from UNIX Platforms ... 93
Stopping Data Sourcer on Windows Platforms ... 94
Stopping Data Sourcer on UNIX Platforms ... 95
Starting and Stopping ETL Assistant ... 95
What Must Be Running Prior to Start... 95
Starting ETL Assistant... 96
Stopping ETL Assistant... 96
Starting and Stopping ETL Runtime ... 96
What Must Be Running Prior to Start... 97
Starting ETL Runtime Starter from SCI ... 97
Starting ETL Runtime Starter from Windows Platforms ... 97
Starting ETL Runtime Starter from UNIX Platforms ... 99
Starting the ETL Runtime Modules Individually ... 100
Stopping ETL Runtime Starter on Windows Platforms... 101
Stopping ETL Runtime Starter on UNIX Platforms... 102
Default Source Path ... 102
Chapter 9 Installing Real-Time Reporting... 103
Chapter 10 Setting Up Real-Time Reporting Users ... 105
Setting Up Users ... 105
Setting Up Administrators... 106
Chapter 11 Starting and Stopping Real-Time Reporting... 107
Starting and Stopping CCPulse+ ... 107
What Must Be Running Prior to Start... 107
Starting CCPulse+ ... 108
Stopping CCPulse+... 108
Default Source Paths... 109
Chapter 12 Uninstalling Reporting Components ... 111
Table of Contents
Uninstalling Data Mart ... 112
Uninstalling Data Sourcer... 113
Uninstalling CCPulse+... 114
Appendix Scaling Your Environment... 115
Do You Need to Scale Your Environment?... 115
Adding New Collection Units ... 116
Removing Collection Units ... 119
Problems with Scaling Incorrectly... 120
Supplements Related Documentation Resources ... 121
Document Conventions ... 123
Preface
Welcome to the Reporting 8.0 Deployment Guide. This guide provides detailed instructions for configuring, installing, and setting up Historical and Real-Time Reporting. It also includes the following information:
• An overview of the Data Collection, Data Mart, and Information Delivery Services, including a description of their supporting components
• Deployment planning checklists for configuration and installation • Database preparations, and sizing and scaling guidelines
• General system requirements
• Starting, stopping, and uninstall procedures
This guide is valid only for the 8.0 release of Solution Reporting, which consists of 8.0 Real-Time Reporting components and 7.6 Historical Reporting components.
This preface contains the following sections:
Intended Audience, page 7
Making Comments on This Document, page 8 Contacting Genesys Technical Support, page 8
For information about related resources and about the conventions that are used in this document, see the supplementary material starting on page 121.
Intended Audience
This guide, primarily intended for system and database administrators, assumes that you have a basic understanding of:
• Computer-telephony integration (CTI) concepts, processes, terminology, and applications.
Note: For versions of this document created for other releases of this product, visit the Genesys Technical Support website, or request the
Documentation Library DVD, which you can order by e-mail from Genesys Order Management at [email protected].
Preface Making Comments on This Document
• Network design and operation. • Your own network configurations.
You should also be familiar with the Genesys Framework architecture and functions, and particularly with Configuration Manager.
Making Comments on This Document
If you especially like or dislike anything about this document, feel free to e-mail your comments to [email protected].
You can comment on what you regard as specific errors or omissions, and on the accuracy, organization, subject matter, or completeness of this document. Please limit your comments to the scope of this document only and to the way in which the information is presented. Contact your Genesys Account
Representative or Genesys Technical Support if you have suggestions about the product itself.
When you send us comments, you grant Genesys a nonexclusive right to use or distribute your comments in any way it believes appropriate, without incurring any obligation to you.
Contacting Genesys Technical Support
If you have purchased support directly from Genesys, contact Genesys Technical Support at the following regional numbers:Region Telephone E-Mail
North America and Latin America
+888-369-5555 (toll-free) +506-674-6767
Europe, Middle East, and Africa
+44-(0)-1276-45-7002 [email protected] Asia Pacific +61-7-3368-6868 [email protected] Malaysia 1-800-814-472 (toll-free)
+61-7-3368-6868
India 000-800-100-7136 (toll-free) +91-(022)-3918-0537
Japan +81-3-6361-8950 [email protected]
Before contacting technical support, refer to the Genesys Technical Support Guide for complete contact information and procedures.
Chapter
1
Reporting Overview
This chapter introduces Genesys Reporting and explains the data collection and organization components that deliver contact center data to CCPulse+ and Contact Center Analyzer (CC Analyzer). These applications provide real-time and historical reporting.
This chapter contains the following sections:
What Is Reporting?, page 9 Reporting Architecture, page 10 New In This Release, page 22
What Is Reporting?
Genesys Reporting is a powerful tool for viewing and analyzing contact center performance, enabling you to improve enterprise efficiency. It consists of two products, CC Analyzer and CCPulse+, which draw on much of the same data but provide different functional capabilities.
High availability (HA) of historical reporting data—a new feature provided since the Reporting 7.2 release—is intended to minimize the chance of loss of historical reporting data in the event of a single hardware component failure. Refer to Chapter 3, “High-Availability Architecture,” on page 39 for
information about how to implement this feature.
A number of components support CC Analyzer and CCPulse+ in their historical reporting functions. These components are organized into two services: the Data Collection Services and the Data Mart Services. A third service, Information Delivery Services, consists of:
• CC Analyzer, in combination with Report Generation Assistant, the Hyperion Performance Suite, and, if desired, other third-party report-generation tools.
Chapter 1: Reporting Overview Reporting Architecture
The following sections describe the functions and components of these services.
Reporting Architecture
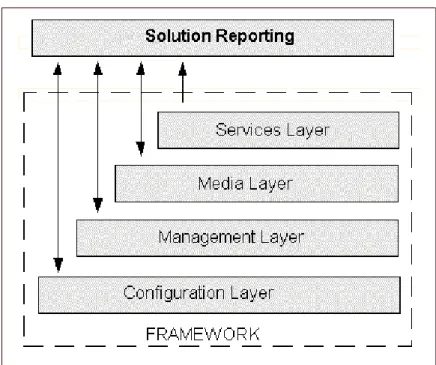
CC Analyzer and CCPulse+ rely on information and processes managed by the Genesys Framework layers depicted in Figure 1.
Figure 1: Genesys Framework Architecture
• The Configuration Layer provides information about configuration objects for which statistics are collected.
• CC Analyzer integrates with the Management Layer, where you centrally manage Genesys applications via the Solution Control Interface.
• The Media Layer, the most important component of which is the Genesys T-Server, supplies TEvent information used by other Framework
components, such as Stat Server, that then supply data to CC Analyzer and CCPulse+.
• The Services Layer defines statistical parameters and provides the statistical information requested by CC Analyzer and CCPulse+. The Services Layer consists of Stat Server.
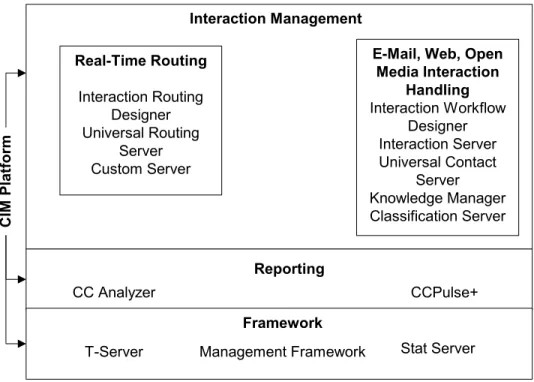
Starting with release 7.0, CC Analyzer and CCPulse+ also serve as part of the Customer Interaction Management (CIM) platform, which includes the Genesys Framework, Real-Time Routing via the Genesys Universal Routing Server, and open media interaction handling abilities. Figure 2 illustrates CIM platform components.
Chapter 1: Reporting Overview Reporting Architecture
Figure 2: Reporting as Part of the CIM Platform
For information on the Reporting architecture including high availability, refer to “HA Architecture” on page 41.
The Reporting Services
Reporting functionality can be conveniently broken down into three services: • The Data Collection Services collect the data.
• The Data Mart Services then transfer, organize, and store this data.
• The Information Delivery Services request data from the Data Mart and use that data to generate reports that summarize your contact center’s
activities.
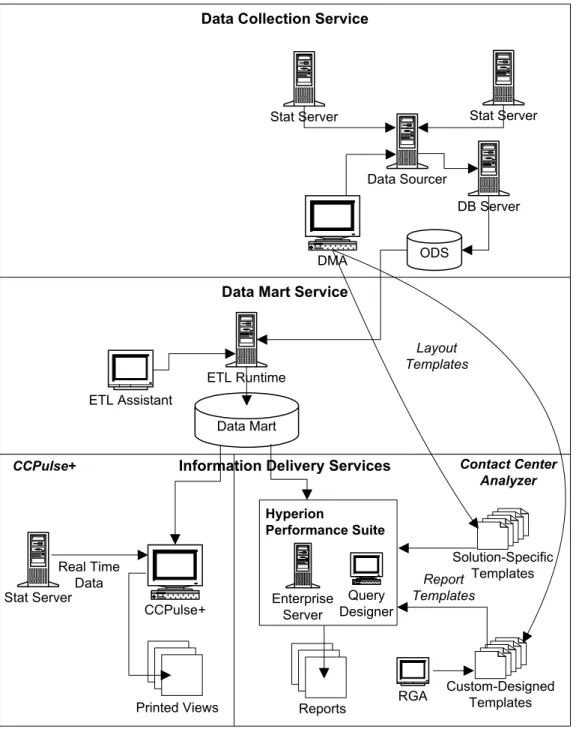
Each service consists of several components that work together to perform its functions. Figure 3 illustrates Reporting components and their relationships.
C
IM Plat
fo
rm
Interaction Management Real-Time Routing
Interaction Routing Designer Universal Routing
Server Custom Server
E-Mail, Web, Open Media Interaction
Handling Interaction Workflow
Designer Interaction Server Universal Contact
Server Knowledge Manager Classification Server Reporting
CC Analyzer Call Concentrator CCPulse+ Framework
Chapter 1: Reporting Overview Reporting Architecture
Figure 3: Reporting Architecture
Data Collection Services
This section focuses primarily on the Data Sourcer component of the Data Collection Services and its relationship with Stat Server, DB Server, and ODS (Operational Data Storage).
Information Delivery Services Data Collection Service
Data Mart Service
Stat Server
Data Sourcer
DB Server
ODS
ETL Runtime ETL Assistant
Data Mart
CCPulse+ Stat Server
DMA
CCPulse+
Real Time Data
Custom-Designed Templates Solution-Specific
Templates
RGA Stat Server
Reports Printed Views
Layout Templates
Report Templates
Contact Center Analyzer
Hyperion
Performance Suite
Enterprise Server
Query Designer
Chapter 1: Reporting Overview Reporting Architecture
The Data Collection Services include:
• Data Sourcer—Collects statistical data from Stat Server and writes it to ODS.
• Data Modeling Assistant (DMA)—A GUI application that you can use to import, export, edit, create, and delete layout templates (defined on
page 14).
• ODS—A relational database that serves as the staging area for the Data Mart Services.
The Data Collection Services use these other Genesys components: • Stat Server—Supplies statistical information to Data Sourcer about
interactions and the objects that handle them, such as queues or agents. • DB Server—DB Server handles database requests from multiple clients. It
provides a single interface from its clients to a variety of database engines including Sybase, Oracle, Microsoft SQL Server, and DB2. As a client of DB Server, Data Sourcer reads information about activated report layouts and writes statistics received from Stat Server to the ODS.
What Is a Collection Unit?
The Data Collection Services are the foundation for the Historical Reporting functionality of both CC Analyzer and CCPulse+. These services consist of one or more collection units—groupings of servers and databases that collect and store data specifically for use by the Data Mart Services.
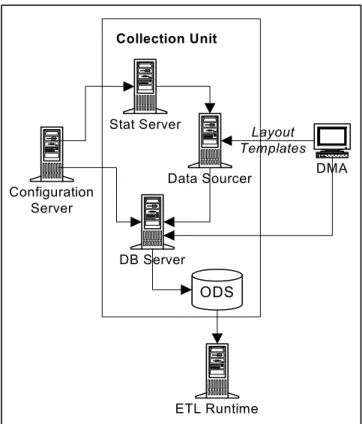
For contact centers using a Genesys Stat Server to track interactions, each collection unit consists of a Stat Server, Data Sourcer, DB Server, and an ODS located on one of four industry-standard RDBMS servers (see Figure 4). Starting with release 7.2, a collection unit may also be comprised of backup Data Sourcer and Stat Server applications.
Note: See the Framework 8.0 Stat Server User’s Guide for information on Stat Server, the Framework 8.0 DB Server User’s Guide for
Chapter 1: Reporting Overview Reporting Architecture
Figure 4: Data Collection Unit
Layout Templates
Data Sourcer uses layout templates to store statistics that are to be collected for selected contact center objects. Each layout template is stored in ODS and specifies:
• Statistics to be included in each new report layout. • Stat type parameters.
• Time profiles for the schedules to be created. • A default name for report layouts.
• A default description.
These layout templates control Data Sourcer’s data collection parameters— which statistics to collect, for which objects, on which schedule, and so on. Data Modeling Assistant
To import, export, edit, create, and delete layout templates, use Data Modeling Assistant. You use DMA to manage layout templates specific to your solution. Layout templates for Genesys Outbound Contact, for instance, contain a set of Note: Because Data Sourcer handles a very heavy volume of data, Genesys
recommends that you dedicate a Stat Server to each Data Sourcer application in your environment.
ETL Runtime Configuration
Server
DMA
ODS Stat Server
Data Sourcer
DB Server Collection Unit
Layout Templates
Chapter 1: Reporting Overview Reporting Architecture
statistics that include outbound-specific activities. These include indicators for campaign performance such as the number of callbacks completed, the number of unsuccessful dial attempts, how long a campaign was active, and so forth. DMA performs the following functions:
• Connects to DB Server to read data from, and write data to, the ODS specified by the server’s database access point, which is defined in Data Sourcer’s configuration.
• Reads information from Configuration Server about all configured Data Sourcer Application objects and their corresponding database access points, as well as all configured objects within the tenant(s), such as agent queues, routing points, and places.
• Updates information about statistical types, time profiles, time ranges, and filters, and sends it to the Configuration Server. Configuration Server then updates the configuration of the corresponding Stat Server application. • Sends information to Data Sourcer about the activation and deactivation of
report layouts. Report Layouts
Data Sourcer uses the layout templates to create report layouts for tenants within your contact center. You must create and activate report layouts before data collection or the reporting interval begins.
Layouts are automatically created if you enter true as the value for the auto-create-new-tenant-layouts option; and layouts are automatically activated if you enter true as the value for the activate-new-layouts option when you configure the Data Sourcer application using the Reporting Wizard. If you set both the auto-create-new-tenant-layouts and
activate-new-layouts options to false, create and activate the layouts using Data Modeling Assistant.
Report layouts specify:
• Which contact center objects are to be monitored. • What statistics are to be collected for these objects. • How often statistical data is to be collected.
Note: When report layouts are first created and a new tenant is connected to Data Sourcer (option auto-create-new-tenant-layouts is set to true), Data Sourcer automatically activates the new report layouts for each new tenant if you have set the Data Sourcer activate-new-layouts configuration option to true. Data Sourcer collects statistical data only for activated report layouts. You can activate or deactivate report layouts at any time using the DMA.
Chapter 1: Reporting Overview Reporting Architecture
The number of report layouts Data Sourcer can create is bound by database limitations and Data Sourcer performance considerations. Chapter 2 on page 23 shows you how to calculate this number.
Time Profile
Data Sourcer collects statistical information about contact center objects on a periodic basis, as specified by a time profile associated with the report layout. This time profile defines the timing and frequency, in consecutive time intervals of constant duration, that Data Sourcer must use to send requests for statistics to Stat Server. For instance, the default time profile, named
CollectorDefault, has Data Sourcer sending requests to Stat Server every 15 minutes, starting at midnight (0:00+0:15).
Operational Data Storage
ODS is the staging area for statistical data about objects in Configuration Server. This data is aggregated over the time period (the time profile) you specify, which is every 15 minutes by default. Data Sourcer draws this data from Stat Server and deposits it into ODS.
ODS is a relational database:
• Into which Data Sourcer writes, organizes, and stores this data. • From which ETL Runtime extracts and, if desired, purges data. Data Sourcer can use the Genesys DB Server to access an ODS on the following DBMS types:
Component Interconnectivity for the Data Collection Services Data Sourcer, a server itself, is a client of:
• Configuration Server • Stat Server
• DB Server DMA is a client of: • DB Server
• Configuration Server • Data Sourcer
The sections below present more detailed information about these components. • Oracle
• Microsoft SQL Server
• Sybase • DB2
Note: The ODS schema is proprietary. Genesys reserves the right to alter it from release to release.
Chapter 1: Reporting Overview Reporting Architecture
Configuration
Server As a client of Configuration Server, primary and backup Data Sourcer receives information about configuration objects for which statistics are collected. Configuration Server provides information about contact center objects (agents, tenants, places, calling lists, campaigns, and so on), statistical
parameters (time ranges, time profiles, filters, and statistical types), as well as information about changes to contact center objects. Data Sourcer uses this delta information for ODS upkeep and for creating appropriate report layouts. The “Tracking Configuration Server Objects” chapter in the Reporting 7.6 Data Sourcer User’s Guide discusses in detail what information Data Sourcer collects about your environment.
Stat Server Stat Server tracks information about customer interaction networks that consist of one or more contact centers in conjunction with one or more computer networks. Stat Server receives information from one or more T-Servers and converts the accumulated data for directory numbers, agents, agent groups, and so on, into statistical information.
As a client of Stat Server, Data Sourcer requests historical statistics for objects belonging to particular report layouts and periodically receives statistical values, calculated metrics, and information about whether the reported values are valid.
The statistics measure quantities associated with time intervals rather than single moments of time. These time intervals are specified by the report layout’s time profile (CollectorDefault, by default). For example, Data Sourcer might issue the following request:
How many calls were answered in the past 15 minutes? but not:
How many calls are currently in queue?
The statistics that Data Sourcer requests from Stat Server for groups of intervals must be calculable from the values for the individual intervals in the group. For example, you can request statistics for an hour, based on four 15-minute collection intervals. You cannot request statistics for a 20-minute period if your collection time profile is every 15 minutes.
Also, you can request statistics for categories, such as TotalTime and
TotalNumber, that produce meaningful values when added together. However, some statistical categories, such as AverageTime, are not additive.
Note: Data Sourcer does not track individual calls but rather collects aggregated predefined statistics from Stat Server.
Note: In Stat Server, such additive statistics are referred to as cumulative and the categories to which they belong are called cumulative categories.
Chapter 1: Reporting Overview Reporting Architecture
Data Sourcer uses only the statistical types defined in Stat Server. As additional statistical types are developed, Data Sourcer inherits the ability to use them.
DB Server DB Server is the Genesys component that handles database requests from multiple client processes. DB Server provides a single interface from the clients to a variety of database engines, including Sybase, Oracle, Microsoft SQL Server, and DB2. As a client of DB Server, Data Sourcer reads
information about activated report layouts and writes statistics received from Stat Server to ODS. Also, when operating in a high-availability environment, Data Sourcer uses the DB Server connection to track its current ODS access mode.
Data Modeling Assistant
Data Modeling Assistant (DMA) enables you to use layout templates to choose which standard operational statistics to collect, on what objects, and how often. Additionally, DMA supports the creation of custom business statistics, such as the number of calls received concerning Product X or revenue generated by Agent Group A.
Data Sourcer acts as a server for DMA. Data Sourcer receives commands from DMA on the activation and deactivation of report layouts. When you activate a report layout within DMA, DMA notifies Data Sourcer, which starts collecting data for that report layout. When you deactivate a report layout, DMA notifies Data Sourcer to stop collecting data for that report layout.
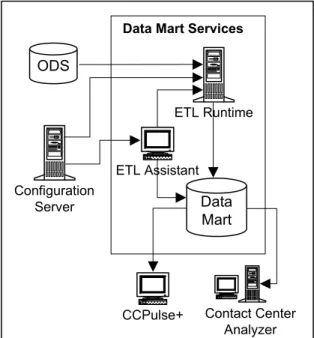
Data Mart Services
The components of a collection unit work together to collect and provide temporary storage for historical data until ETL Runtime (Extraction,
Transformation, and Loading Runtime) transforms the data and transfers it to the Data Mart, the database where data is permanently housed.
ETL Runtime, ETL Assistant, and the Data Mart are the components of the Data Mart Services.
You can view results of ETL Runtime transformation using ETL Assistant, which manages the metadata in the Data Mart.
This section describes the Data Mart Services as they relate to CC Analyzer and CCPulse+ as a whole, focusing particularly on ETL Runtime.
Component Interrelationships
ETL Runtime is the workhorse of the Data Mart Services as it interacts with the following components to read, write, aggregate, and delete data:
Note: Reporting 7.6 ETL Assistant Help describes ETL Assistant
functionality, and the Reporting 7.6 Physical Data Model describes the table and field structure of the Data Mart for the supported RDBMS types.
Chapter 1: Reporting Overview Reporting Architecture
• ODS
• Configuration Server • ETL Assistant • Data Mart
Figure 5 illustrates this connectivity.
ODS ODS, the final component of the Data Collection Services, holds historical data until ETL Runtime transfers it to the Data Mart. Furthermore, if the ETL Runtime dropTransferredTables parameter is used, ETL Runtime deletes the corresponding tables from ODS after it confirms that the data transfer has successfully completed.
Figure 5: Components of the Data Mart Services
ETL Assistant ETL Assistant is the front-end interface you use to communicate with the ETL Runtime server. Using ETL Assistant, you:
• Specify the ODSs from which ETL Runtime is to read data. • Establish a purge schedule for Data Mart elements.
• Discover the names of the Data Mart tables to which data has been transferred.
• Review Data Mart content.
ETL Assistant accesses the Data Mart using a JDBC driver.
Data Mart The Data Mart is the target database where data is permanently stored for retrieval using report-generation tools such as Report Generation Assistant (RGA), CCPulse+, Hyperion Query Designer, or other third-party tools. Data is organized in report folders by aggregation level, for quick access. Genesys Reporting supports four DBMS types for your Data Mart: Oracle, Microsoft
ETL Runtime
Configuration Server
ODS
Data Mart Services
Data Mart ETL Assistant
CCPulse+ Contact Center Analyzer
Chapter 1: Reporting Overview Reporting Architecture
Configuration
Server Although Configuration Server is not a part of the Data Mart Services, ETL Runtime connects to this server to: • Register itself as a Genesys component (all Genesys software is registered
in the Configuration Server).
• Track tenant changes, such as tenant additions or deletions.
• Track group changes, such as when new members are added to, or deleted from, a group.
ETL Runtime tracks only those objects, groups, and tenants that you have assigned it to monitor using ETL Assistant.
The Genesys ETL Service Starter
The Reporting Configuration Wizard creates an ETL Service Starter Application object, among other Application objects, that you can view and edit using Configuration Manager. When you run the Starter, it schedules the following processes to run:
• Transformation Module • Aggregation Module
• Configuration–Object Tracking Module
All three processes run continuously until stopped. You can add other modules, such as the Purging module, at your discretion.
You can configure this application to run other ETL Runtime processes on a daily basis. If, however, you want to schedule processes to run beyond today (such as every Sunday at 2:00 AM or on the first day of each month), you will have to use a third-party scheduler.
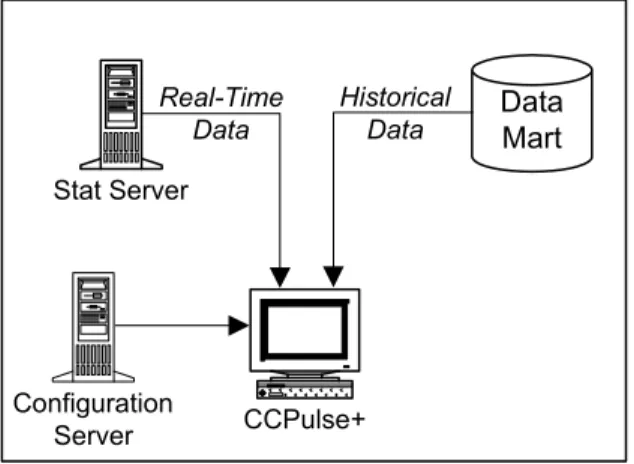
Information Delivery Services–CCPulse+
CCPulse+ enables both real-time and historical monitoring of contact center activity. CCPulse+ monitors the status and statistics related to contact center objects (such as agents, queues, routing points, and interaction queues) and displays them on the user’s desktop. Using CCPulse+ you can:
• Customize real-time, historical, and query-based views of contact center objects.
• Monitor the current state and activity of objects throughout the contact center, to help make decisions about staffing, scheduling, and call-routing strategies.
• Create threshold/action associations that generate some kind of notification when a specified activity reaches the threshold level you set.
• Print views, which can then function as basic reports of contact center activity.
CCPulse+ interfaces with the Services and Configuration Layers of the Genesys Framework (refer to Figure 1 on page 10) to monitor agent performance of one or more tenants from one or more sites.
Chapter 1: Reporting Overview Reporting Architecture
If you are using Historical Reporting, CCPulse+ also connects to the Reporting Data Mart Services.
Figure 6 illustrates the architecture delivering these capabilities. For detailed information on CCPulse+, refer to Reporting 8.0 CCPulse+ Help and the Reporting 8.0 CCPulse+ Administrator’s Guide.
Figure 6: CCPulse+ Architecture
Information Delivery Services—CC Analyzer
CC Analyzer is a powerful and flexible tool for generating historical reports. CC Analyzer is comprised of Report Generation Assistant (RGA), a Reporting component powered by the Hyperion Query Designer (formerly, BrioQuery Designer). Genesys provides Hyperion Query Designer to CC Analyzer customers through an agreement with Oracle Corporation.
Report Generation Assistant
RGA is the Reporting component that enables automatic generation of queries, charts, and reports, based on the Genesys-provided report templates and metadata from your Data Mart. RGA is powered by Hyperion Query Designer. Hyperion Query Designer
Oracle Corporation provides Hyperion products that enable the design and delivery of reports by means of client-server connections, the Web, e-mail, and more. Genesys Reporting supplies Hyperion products that provide powerful Historical Reporting tools. These tools, which draw upon the data stored in the
Stat Server
Data Mart
CCPulse+
Real-Time Data
Historical Data
Configuration Server
Chapter 1: Reporting Overview New In This Release
Data Mart, enable you to create a wide range of report types and to customize the data presentation to suit your reporting needs.
New In This Release
This section lists topics that are new or that have changed significantly since the 7.5 release:
• Security banner, if configured, prompts a user to accept or reject conditions of use before the CCPulse+ login window appears.
• CCPulse+ employs a new silent server reconnect procedure. • CCPulse+ supports new improved storage file formats. • CCPulse+ connection to Genesys Info Mart is discontinued. • Data Sourcer supports multiple chunk composition modes. • IS Data Sourcer is discontinued.
Note: For detailed information about Hyperion’s products, refer to the provided Hyperion documentation. For additional information about generating reports using Contact Center Analyzer, refer to the Reporting 7.2 Report Generation Assistant User’s Guide and the Reporting Technical Reference Guide.
Chapter
2
Predeployment Measures
This chapter describes preparatory steps you should perform before
configuring and installing the Genesys Reporting 8.0 components. Be sure to read through this chapter and understand the requirements for each component. This chapter contains the following sections:
Supported Operating Systems, page 24
Prerequisites for Each Reporting Component, page 24 Preparing the Databases, page 26
Distributed Architecture, page 36
Calculating the Number of Collection Units, page 36
To successfully install any Reporting 8.0 component, you must first: • Have the Reporting and Reporting Templates CDs at hand.
• Have a current 8.0 version of Configuration Server running in your environment.
• Have administrator privileges to create Application objects in Configuration Server. (User privileges are set using Configuration Manager.)
• Install JRE 1.4 or later on the same machine on which the Reporting 8.0 Configuration Wizards run. The Configuration Wizards perform RDBMS validation and connect to RDBMS using JDBC.
Note: You can use Reporting 8.0 with Configuration Server 7.6. However, to take advantage of the 8.0 Reporting Configuration Wizards, which are launched through the Genesys Wizard Manager, you must install the Framework 8.0 Configuration Wizard, which are found on the Management Framework CD.
Chapter 2: Predeployment Measures Supported Operating Systems
Supported Operating Systems
Refer to the Genesys Supported Operating Environment Reference Manual for the list of operating systems and database systems supported in Genesys releases 6.x, 7.x, and 8.x. You can find this document on the Genesys Technical Support website at
http://genesyslab.com/support/dl/retrieve/default.asp?item=B6C52FB6 2DB42BB229B02755A3D92054&view=item.
For UNIX-based (UNIX) operating systems, also review the list of patches Genesys uses for software product builds, and upgrade your patch
configuration if necessary. A description of patch configuration is linked to installation read_me.html files for the Genesys applications that operate on UNIX, and is available within the installation packages.
Prerequisites for Each Reporting
Component
Before running either the CC Analyzer or the CCPulse+ Wizard, review the requirements for each Reporting component listed in the following sections to verify that you have correctly prepared your environment for installation.
Data Sourcer
The following are required to install Data Sourcer:
• You must have administrative privileges on the target host.
• A database prepared by your database administrator for Data Sourcer (ODS). See “Preparing the Databases” on page 26 for details on preparing the database.
• The user name and password for ODS.
• A running DB Server for Data Sourcer to access the ODS.
• Database user privileges to create, update, and delete tables, and to create procedures and triggers. This database user should not have administrator privileges.
• The DB Server tran_batch_mode configuration option set to OFF.
Note: For 7.6 Data Sourcer to operate properly, DB Server version 7.6.000.09 or later is required.
Chapter 2: Predeployment Measures Prerequisites for Each Reporting Component
Data Modeling Assistant
Before installing Data Modeling Assistant, ensure that:
• You have administrator privileges on your Windows platform.
• Microsoft Internet Explorer 6+ is installed on the host machine which will run DMA.
Data Mart/ETL Runtime
Before launching the setup program to install the Data Mart, ensure that: • JRE 1.4 or later is installed.
• A supported database is available for the Data Mart. See “Preparing the Databases” on page 26 for details.
• A RDBMS user account for the Data Mart has been created with privileges to create tables, views, and indexes. This account, however, should notbe granted DBA privileges.
Hyperion Performance Suite
The report-generation tools that you can use with CC Analyzer are offered in cooperation with Oracle Corporation. The Hyperion tool set comes with its own documentation to which you should refer for complete installation requirements.
CCPulse+
Before launching the setup program to install CCPulse+ reporting, ensure that: • You have administrator privileges on your Windows platform.
• Microsoft Internet Explorer 6+ is installed on the host machine which will run CCPulse+.
• All prior versions of CC Pulse/CCPulse+ have been completely uninstalled.
Note: Administrative privileges are required to register Object Linking and Embedding (OLE) Custom Controls (OCXs) to the system registry; DMA cannot operate without the registered OCXs.
Note: Administrator privileges are required to register OCXs to the system registry; CCPulse+ cannot run without the registered OCXs.
Chapter 2: Predeployment Measures Preparing the Databases
If you intend to use Historical Reporting in CCPulse+, also review the component-specific requirements for Data Sourcer, DMA, and ETL Runtime, which are described on pages 24 and 25.
Preparing the Databases
Historical Reporting, whether delivered by CC Analyzer or CCPulse+, requires two databases: ODS and the Data Mart. Both databases must use the same relational database management system.
Refer to the Reporting 7.6 Physical Data Model for your specific RDBMS type to understand Data Mart structure and to the Standard PDM Report for your RDBMS type to understand ODS structure. The standard PDM reports are available in the database directory where Data Sourcer is installed.
In preparing these databases, you complete several preparatory steps including: • Ensuring that you are using a supported RDBMS.
• Ensuring that database capacity requirements are met.
• Ensuring that a dedicated number of threads exist for Data Sourcer and ETL Runtime.
• Preparing the database environment.
• Appropriately sizing the ODS and Data Mart databases.
Supported RDBMSs
Reporting 8.0 supports the following relational database management systems: • Oracle 9.0, 9.2, 10g, 10.2, and 11g
• Sybase 12.5
• Microsoft SQL Server 2000, SP 3 or later, Microsoft SQL Server 2005, SP1,
Microsoft SQL Server 2008 • DB2 8.2, DB2 9.1, and 9.5
Notes:See also, Genesys Supported Operating Environment Reference Manual,
which contains the most recent information.
Ensure that you are using an appropriate version of DB Server that supports your version of DBMS and meets a minimum DB Server version requirement (7.6.000.09) for Data Sourcer to operate properly.
Chapter 2: Predeployment Measures Preparing the Databases
Calculating Database Capacity
Develop database-capacity requirements as they relate to your system by answering the following questions.
• How much space is needed for the database? • How much space is to be added in the future? • How powerful should the database be?
• How will this database be used? (to generate operational reports? analytical reports?)
• When and how often will loading and transformation occur? • When will aggregation occur?
• How will indexes be managed? For example, do you require separate tablespaces for indexes?
Calculating the Number of Threads
The Data Collection and Data Mart Services use numerous threads to run many functions in parallel. Use this optional procedure if you are using an operating system that has a low limit for the number of threads.
You can calculate the number of threads used by the various components as follows:
• 11 for each Data Sourcer application (primary and backup).
• 17 + (3 x NODSs) for ETL Runtime’s Transformation and Aggregation modules, where NODSs denotes the number of data sources defined to ETL Runtime.
This calculation represents the maximum number of threads ETL Runtime uses. The number of threads ETL Runtime uses decreases in direct relation to the number of writers defined by the numberOfWriters ETL Runtime parameter. (ETL Runtime modules and parameters are described in the Reporting 7.6 ETL Runtime User’s Guide.)
Preparing Your Database Environment
Prior to installation, the requisite database environment must be prepared by a database administrator. Because working with both the Data Collection and the Data Mart Services is database intensive, Genesys also recommends DBA participation during the installation process.
Note: See pages 29 through 36 for information about estimating the correct size for each database.
Chapter 2: Predeployment Measures Preparing the Databases
Example: The Oracle Database Environment
The Oracle database environment, for example, is composed of the following: • A tablespace for ODS (refer to sizing information on page 29 to estimate
database size).
• A tablespace for the Data Mart (refer to sizing information on page 33 to estimate database size).
• An additional tablespace for each collection unit, if you plan to operate a second or third Data Sourcer. These additional tablespaces might not be required depending on your level of resource usage. (Refer to page 36 to determine the number of collection units your environment requires.)
Preparatory Steps
After developing capacity requirements, prepare databases for ODS and Data Mart using the following procedure.
During the configuration process, you are prompted for the user name and password of each user created, as well as the RDBMS host and port.
1. Create accounts for Data Sourcer and for ETL Runtime. (You must have DBA privileges to create accounts). Consult the documentation for your database and/or your DBA for the procedure.
2. Ensure that the following initialization parameters allow all clients, including Data Sourcer and ETL Runtime, to work with this database instance:
open_cursors (default: 49; recommended: 200) dm1_locks (default: 100; recommended: 200)
3. Ensure that the COMPATIBLE parameter for an Oracle ODS and Data Mart reflects the current version of your RDBMS. For example,
COMPATIBLE=9.0.1.
Note: During the configuration process, you are prompted for the user name and password of each user created, as well as the RDBMS host and port. For the Oracle database, a system identification number (SID) is required. If you do not have this information, you cannot proceed with the configuration.
Note: The Data Collection and Data Mart Services support only single-byte database names.
Note: The accounts for Data Mart and Data Sourcer must not have administrator privileges.
Chapter 2: Predeployment Measures Preparing the Databases
DB2 Database Requirements
If you are using a DB2 database, verify that it meets these requirements: • A buffer pool has been created with page size of at least 16 KB. • A tablespace is associated with that buffer pool.
• Rights to the tablespace associated with the buffer pool are assigned to the Data Mart owner.
• Given that, in most cases, the default value of the DB2 applheapsz configuration parameter is too low, increase this value as needed.
Microsoft SQL Server Database Recommendation
Setup Steps If you are using Microsoft SQL 2005 for your ODS database, Genesysrecommends that you perform the following setup steps:
1. Create a login, or choose an existing one, for Data Sourcer to use to connect to your ODS database.
2. Create a database.
3. Create a new schema in the database; for example, genesys or ods.
4. Create a new user for this database. The user must have the same name as the schema created in Step 3. Map the new user to the login created for Data Sourcer in Step 1, and set the ownership of the new schema to this new user.
5. Grant the required database privileges to the new user. Modify the DAP
Application
To enable Data Sourcer to retrieve needed configuration parameters, Genesys also recommends modifying the DAP application used to access the ODS database, if:
• You are using a Microsoft SQL Server database for your ODS. • Your Data Sourcer application is release 7.6.x.
For more information, see the chapter about fine-tuning your Data Sourcer configuration in the Reporting 7.6 Data Sourcer User’s Guide.
Estimating ODS Size
Genesys recommends reserving enough space in ODS for at least two
additional days of data collection, in the event data is not removed from ODS as you anticipate. Determining an appropriate size for ODS depends on the number of requests, the time profiles, the average size of record requests, and how often you plan to purge the database.
Use the following formula to estimate the minimum ODS size:
Chapter 2: Predeployment Measures Preparing the Databases
where:
• ODSSize is the size of the Operational Data Storage in bytes. • NRequests is the number of requests made to Stat Server.
• NTimesPerDay is the number of Collection Time Profiles per day. • RequestsRecordSize is the request record length in bytes.
• NDays is the number of days data is stored in the ODS.
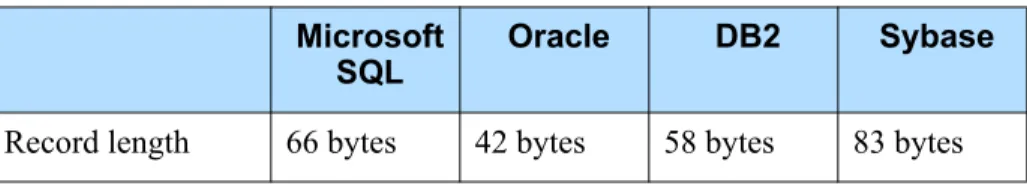
Data Sourcer stores the data it requests from Stat Server in OL_DATAn tables in ODS. This table’s record length depends on your relational database
management system and its storage parameters. Table 1 provides record length estimates for the supported RDBMSs.
The actual record length in your OL_DATAn tables may differ.
You can calculate the number of requests made to Stat Server as follows:
where:
• NObjects is the number of objects in your report layout.
• NStatistics is the number of statistics collected by each report layout. • NLayouts is the number of active report layouts in Data Sourcer.
Example
Assume the following: 100,000 requests, a 15-minute time profile, an Oracle RDBMS, and ODS is cleared once daily.
Table 1: Estimated Length of Request Records by RDBMS
Microsoft
SQL Oracle DB2 Sybase
Record length 66 bytes 42 bytes 58 bytes 83 bytes
Note: DMA shows the number of requests for all active report layouts in the Status bar when the topmost report folder (the default name is Report Layouts) is selected on the Folder pane. DMA displays the total number of statistics for a particular report layout when that report layout is selected on the Folder pane.
• NRequests = 100,000 • NDays = 1
• NTimesPerDay = 4 collections/1 hr x 24 hrs/day = 96 collections/day NRequests NObjectsiNStatisticsi
i=1 NLayouts
Chapter 2: Predeployment Measures Preparing the Databases
An appropriate database size for this scenario is ~1.2 GB (100,000 x 96x42x
ndit is a good idea to factor in some extra space.
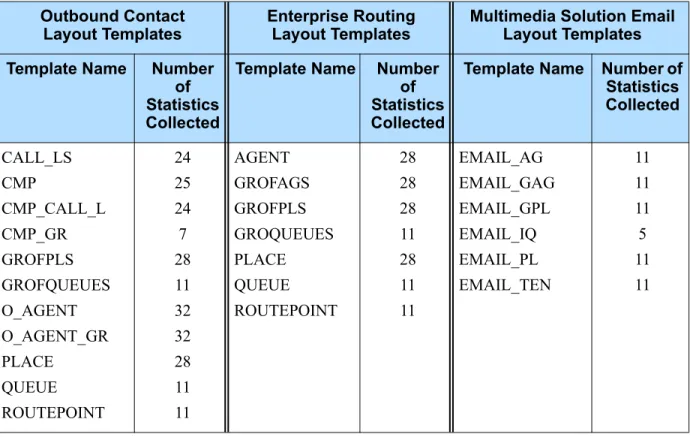
Calculating the Number of Requests
Table 2 shows some examples of solution-specific layout templates.You can use these templates as starting points for creating report layouts that measure the status and performance of specific contact center objects. The table also shows the number of statistics collected. For a complete list of templates, please refer to the Reporting Technical Reference Guide.
Note: See “ODS Layout Templates” in the Reporting Technical Reference Guide for more information about the statistics gathered.
Table 2: Solution Layout Templates
Outbound Contact
Layout Templates Enterprise RoutingLayout Templates Multimedia Solution Email Layout Templates Template Name Number
of Statistics Collected
Template Name Number of Statistics Collected
Template Name Number of Statistics Collected CALL_LS CMP CMP_CALL_L CMP_GR GROFPLS GROFQUEUES O_AGENT O_AGENT_GR PLACE QUEUE ROUTEPOINT 24 25 24 7 28 11 32 32 28 11 11 AGENT GROFAGS GROFPLS GROQUEUES PLACE QUEUE ROUTEPOINT 28 28 28 11 28 11 11 EMAIL_AG EMAIL_GAG EMAIL_GPL EMAIL_IQ EMAIL_PL EMAIL_TEN 11 11 11 5 11 11
Chapter 2: Predeployment Measures Preparing the Databases
Example
Consider the following sample environment:
Multimedia Solution Email
Layout Templates Multimedia Solution Voice Layout Templates Multimedia Solution Live Web Layout Templates Template Name Number
of Statistics Collected
Template Name Number of Statistics Collected
Template Name Number of Statistics Collected EMAIL_AG EMAIL_GAG EMAIL_GPL EMAIL_IQ EMAIL_PL EMAIL_TEN 11 11 11 5 11 11 VOICE_A VOICE_AG VOICE_GQ VOICE_P VOICE_PG VOICE_Q VOICE_RP VOICE_T 22 22 12 22 22 15 15 16 CHAT_A CHAT_GA CHAT_GH CHAT_GP CHAP_P 13 13 7 13 13
VCB Email Layout Templates
Use the following formula to calculate the number of requests generated for an ODS containing all seven layout templates for Enterprise Routing:
NRequests = (NAGENTsx28) + (NGROFAGSsx28) + (NPLACEsx28+(NGROFPLSx28) + (NQUEUEsx11) + (NROUTEPOINTsx11) + (NGROFQUEUESx11)
Template Name Number of Statistics Collected VCB_GQ_EV VCB_GQUEUE VCB_Q_EV VCB_QUEUE VCB_RP VCB_TENANT 9 12 9 12 12 21
Table 2: Solution Layout Templates (Continued)
Tenant 1 Tenant 2
1,000 agents 50 agent groups 500 places 25 place groups 10 queues 20 routing points
5 queue groups 15-min time profile (NTimesPerDay=96) Oracle RDBMS
ODS cleared once daily
2,000 agents 100 agent groups 500 places 25 place groups 10 queues
100 routing points
5 queue groups 15-min time profile (NTimesPerDay=96) Oracle RDBMS
Chapter 2: Predeployment Measures Preparing the Databases
Using these figures in the equation on page 30, you calculate the number of requests and ODS size as follows:
NRequests = [(1000 x 28) + (50 x 28) + (500 x 28) + (25 x 28) + (10 x 11) + (20 x 11) + (5 x 11)] +
[(2000 x 28) + (100 x 28) + (500 x 28) + (25 x 28) + (10 x11) + (100 x 11) + (5 x 11)]
= 44,485 + 74,765 = 119,250
ODSSize = 119,250 x 96 x42 x (1 + 2) = ~1.4 GB
Estimating Data Mart Size
The appropriate size for Data Mart depends on the number of objects stored, the number of statistics gathered, and how long data is kept. This database is much larger than ODS because:
• It maintains a much longer history of contact center statistics; typically, it stores statistics for one year.
• Presummarized data is generated for several aggregation levels, to improve reporting performance.
To calculate the Data Mart size, you must calculate its raw data size and then factor in whatever amount of overhead is appropriate for your enterprise. Overhead size includes the space required for such things as indexes and metadata and highly variable. Steps for calculating the minimum size for the Data Mart appear in the next section.
As a guideline, note that in addition to storage requirements for raw data, you must also store three default indexes:
• One composite index for the Fact table on the Object and Time foreign keys.
• Two indexes, one each on the primary key indexes for the Dimension tables. Refer to the Standard PDM documents for your RDBMS for information on these and other Data Mart tables. These three indexes and the two Dimension tables consume approximately one-third again as much space, so the total minimum space required for the Data Mart is calculated as follows:
Calculating Data Mart Size
Calculating the raw data size requires that you first calculate the number of aggregations you are using, and then use this figure in the equation for raw data size.
Chapter 2: Predeployment Measures Preparing the Databases
Calculating Number of Aggregations
Each report layout star schema contains two dimension tables (object and time) and one Fact table for each aggregation level. Fact tables affect database size more than dimension tables do. All Fact tables hold the number of
aggregation periods maintained for each aggregation level.
For example, at the 15-minute aggregation level, Data Mart maintains 35,040 aggregation periods for a one-year period (365 days/year xhours/day x aggregations/hour, while at the one-year aggregation level, the Data Mart maintains just one aggregation period.
The total of all aggregation periods can be represented as follows:
where i represents one of seven default aggregation levels: 15-minute, hour, day, week, month, quarter, and year. The total number of aggregations for these seven aggregation levels is:
Calculating Raw Data Size For each report layout schema:
• The number of objects multiplied by the total number of aggregation periods translates into the number of rows.
• The number of statistics translates into the number of columns.
In addition, two keys in each row, the Object and Time foreign keys, point to the Dimension tables. Each statistic and the two keys occupy four bytes of space.
To calculate the total size of the raw data in the Data Mart, sum the star schema sizes for each report layout:
where is the size of the row key (that is, the size of the TIME_KEY and OBJECT_ID fields).
Example
To calculate Data Mart size, assume the following: • The Data Mart is loaded daily.
• You are using the default aggregation levels.
• You are maintaining a one-year history in the Data Mart. Tenant characteristics are as follows:
TotalAggs NAggregationsi i=1
NLevels
=
TotalAggs = 35040 8760 365 52 12 4 1+ + + + + + = 44234
RawDataSize TotalAggs NObjectsj NStatisticsj 4 +
j=1 NLayouts
Chapter 2: Predeployment Measures Preparing the Databases
:
As shown above, the equation is as follows:
You must perform the calculation separately for each layout, using the correct number of objects and number of statistics for each layout. Add these results together to obtain the raw data size.
Total Aggs = 44234 (See the calculation in
“Calculating Number of Aggregations” on page 34.) NLayouts = 7 (Agent, Agent Group, Place, Place Group, Queue,
Queue Group, Routing Point)
NObjectsj 3000 agents, 150 agent groups, 1000 places, 50 place groups 20 queues, 120 routing points, and 10 queue groups.
NStatisticsj The number of statistics for each layout as shown in Table 2 on page 31.
= 30 (Row key size)
Using these figures, the raw data size comes to 25.02664458 GB. The minimum recommended Data Mart size is as follows: Raw Data Size x 1.33 = 25.02664458 x 1.33 = 33.28543729 GB Example—Alternative Calculation of Data Mart Size
You can also calculate the minimum Data Mart size as follows: DMSize = (NRequestsxNTimesPerDayxNDaysx 8) + 20,000 where:
• DMSize is the size of the Data Mart in bytes.
• NRequests is the total number of requests from all Data Sourcers connected to the Data Mart.
• NTimesPerDay is the number of Collection Time Profiles per day. • NDays is the number of days data is stored in the Data Mart.
Tenant 1 Tenant 2
1,000 agents 50 agent groups 500 places 25 place groups 10 queues 20 routing points 5 queue groups
Oracle row-key size = 30
2,000 agents 100 agent groups 500 places 25 place groups 10 queues
100 routing points 5 queue groups
Oracle row-key size = 30
RawDataSize TotalAggs NObjectsj NStatisticsj 4 +
j=1 NLayouts
Chapter 2: Predeployment Measures Distributed Architecture
Using the same number and types of objects as in the previous example, this is calculated as:
DMSize = (119,250 x 96 x 365 x 8) + 20,000 = 33,428,180,000 bytes To convert the answer to GB, divide by 1,073,741,824. This gives an
appropriate database size for this scenario of ~32 GB. ndit is a good idea to factor in some extra space.
Distributed Architecture
In estimating database- and hardware-sizing requirements, first determine the implementation architecture for the Data Collection Services. In most cases, a centralized configuration easily accommodates interaction volume. For large volumes—more than 30 interactions per second—Genesys recommends a distributed configuration.
Calculating the Number of Collection Units
Because Stat Server tracks and maintains statistics in memory, Stat Server can handle only a limited number of statistics. This limitation depends on call volume, RDBMS throughput, CPU speed, and available memory. To scale beyond these limitations, distribute the monitoring and collection of statistics across multiple collection units. Refer to Figure 4 on page 14 for an illustration of collection unit components.Determining how many collection units to configure requires site-specific information on contact center volume, interaction complexity, and hardware and software environments. In general, configure one collection unit for every contact center or for every tenant in a multi-tenant environment. For a more precise determination of initial distribution, use the following procedure. Note: The procedure is only a guideline because accurate scaling of
collection units requires ongoing monitoring and tuning.
1. Determine the number of calls per second each T-Server handles.
2. Organize the T-Servers into groups whose total call volume adds up to no more than approximately 30 contacts per second:
Note: NRequests is calculated as follows:
[(1,000 x 28) + (50 x 28) + (500 x 28) + (25 x 28) + (10 x 11) + (20 x 11) + (5 x 11)] + [(2,000 x 28) + (100 x 28) + (500 x 28) + (25 x 28) + (10 x 11) + (100 x 11) + (5 x 11)]
Chapter 2: Predeployment Measures Calculating the Number of Collection Units
3. For each group of T-Servers, calculate the number of requests for all report layouts associated with each T-Server:
4. Calculate the number of collection units for each T-Server group by multiplying its number of requests by its total call volume. Then, divide the result by the product of the tested limits for call volume per second and requests for the hardware on which the collection unit will run:
5. Add the sum of collection units for each T-Server group to get the total number of collection units:
6. In the event of fractional results, round up the number of collection units as a cushion for increasing volumes.
Example
Adding to the previous example on page 30, Tenant 1 is serviced out of two equally sized contact centers, each with a T-Server handling contact volume of approximately 10 contacts per second. Tenant 2 is also serviced out of two equally sized sites, each with a T-Server handling 20 contacts per second. The total contact volume is 60 contacts per second, which would overload a single collection unit.
This example is based on a Windows Server environment running on computers with Pentium 400 processors and 256 MB of RAM, which tests have shown to be capable of handling:
• Approximately 30 contacts per second. • Approximately 50,000 requests per second.
Note: The value for the maximum number of requests per collection unit (NRequestsH) is based on the performance of both Stat Server and Data Sourcer. Performance, in turn, is based on a number of factors including disk space, memory, and whether binding is used, to
mention a few. Refer to “Stat Server Performance” and “Data Sourcer Performance” in the “Performance Measurements” chapter of the Reporting 8.0 Reference Manual for more information.
GroupCV30
NRequests NObjectsiNStatisticsi i= 1
NLayouts
=
NCollectionUnits NRequestsTGroupCV CVMax NRequests H ---=
TotalCollectionUnits NCollectionUnitsi i=1
NGroups
Chapter 2: Predeployment Measures Calculating the Number of Collection Units
These numbers depend heavily on call complexity, which can vary widely. The tests used contacts of average complexity (for example, few transfers, few conferences, typical amounts of attached data, and so forth).
In making the collection-unit calculation, you could distribute four collection units, one each to the four sites. However, you can optimize the distribution by following this process:
1. The T-Server contact volumes are:
T-Server 1: 10 contacts per second. T-Server 2: 10 contacts per second. T-Server 3: 20 contacts per second. T-Server 4: 20 contacts per second.
2. You can pair each Tenant 1 site with a Tenant 2 site:
T-Server 1 + T-Server 3: 30 contacts per second T-Server 2 + T-Server 4: 30 contacts per second
3. Since each of the paired sites has the same characteristics, the number of requests is identical:
NRequests
= [(500 x28) + (25x28) + (250 x28) + (12 x28) + (5x11) + (10x11) + (5x11)] +[(1000 x28) + (50x28) + (250x28) + (12x28) + (25x11) + (50x11) + (5x11)]
= 22,256 + 37,616 = 59,872
4. The number of collection units for each T-Server group is calculated as follows:
5. The total number of collection units for the two T-Server groups is calculated as follows:
If 2.4 is rounded up, you would distribute three collection units. In this case, instead of the two pairs of sites above, you could, alternatively, configure one collection unit for Tenant 1’s two sites and a separate one for each of Tenant 2’s two sites.
Tenant 1 (Each Contact Center) Tenant 2 (Each Contact Center)
500 agents 25 agent groups 250 places 12 place groups 5 queues 10 route points
5 queue groups 15-min time profile 70-bit record size 2 T-Servers
10 contacts per second
1,000 agents 50 agent groups 250 places 12 place groups 25 queues 50 route points
5 queue groups 15-min time profile 70-bit record size 2 T-Servers
20 contacts per second
NCollectionUnits 59872 30 1500000
--- 1.2
= =
Chapter
3
High-Availability
Architecture
This chapter discusses the concept of High-Availability (HA) architecture in Reporting release 8.0. This chapter contains the following sections:
Overview, page 39
Planning Considerations, page 40 HA Architecture, page 41
Primary and Backup Data Sourcer Applications, page 42 Deployment, page 43
Overview
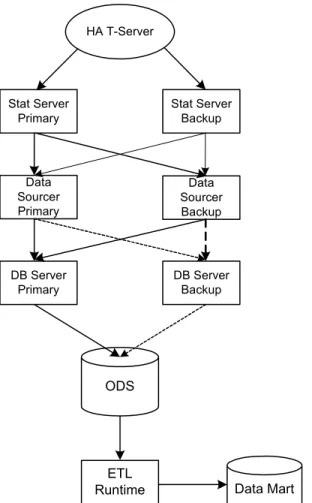
The high-availability architecture in historical reporting is intended to minimize the chance of any loss of historical reporting data, in the event of a single hardware component failure.
The HA reporting architecture consists of two Data Sourcer applications, configured in Hot Standby mode, and connected to two Stat Server applications, an HA T-Server, an ODS, and a Data Mart. The Stat Server applications will collect and send duplicate sets of data to the Data Sourcer pair, although only the Data Sourcer with the ODS lock will write to the ODS. Data redundancy, connections to backup servers, and components operating in Hot Standby mode, will together ensure high availability of historical reporting data in release 8.0. Figure 7 illustrates the HA reporting architecture.
Note: Reporting 8.0 consists of two products, Contact Center Analyzer 7.6 and CCPulse+ 8.0.
Chapter 3: High-Availability Architecture Planning Considerations
Figure 7: High-Availability Reporting Architecture
Planning Considerations
Proper planning is required to ensure successful implementation of the HA reporting architecture. The following suggestions are guidelines for planning your HA architecture:
• Install your primary and backup reporting components on separate servers, if your hardware boxes are not HA.If possible, physically separate each primary server from each backup server.
• Use HA networks or clustered boxes.
• Set up alarms to signal component failures, and create a response plan for handling these alarms.
• Configure your ODS and Data Mart databases to operate in HA mode. It is the responsibility of your DBA to configure both ODS and Data Mart databases in HA mode, to ensure that there is no loss of data from databases on the RDBMS side. For example, in the case of an Oracle
HA T-Server
Stat Server Primary
Stat Server Backup
Data Sourcer Primary
Data Sourcer Backup
DB Server Primary
DB Server Backup
ODS
ETL