TOO SMALL TO REGULATE: INTERNATIONAL EVIDENCE ON REGULATORY MONITORING
Lorien Stice-Lawrence
A dissertation submitted to the faculty at the University of North Carolina at Chapel Hill in partial fulfillment of the requirements for the degree of Doctor of Philosophy in the Department
of Accounting in the Kenan-Flagler Business School.
Chapel Hill 2017
ii © 2017
iii ABSTRACT
Lorien Stice-Lawrence: Too Small to Regulate: International Evidence on Regulatory Monitoring
(Under the direction of Mark Lang)
I examine a phenomenon called Too Small to Regulate (TSTR) by which industries composed predominantly of small firms are more likely to violate regulatory requirements because their industry composition makes them especially difficult to effectively monitor. I identify TSTR industries throughout the world and find evidence consistent with firms in these industries receiving less regulatory monitoring using measures derived from firms’ financial disclosures and downloads of EDGAR filings by SEC and IRS employees. Consistent with inadequate oversight, firms in TSTR industries are penalized by the market with lower liquidity and are more likely to engage in non-compliant activities such as tax avoidance. The
iv
v
ACKNOWLEDGEMENTS
vi
TABLE OF CONTENTS
LIST OF TABLES………...vii
LIST OF ABBREVIATIONS………..viii
CHAPTER 1: INTRODUCTION………1
CHAPTER 2: LITERATURE REVIEW AND HYPOTHESIS DEVELOPMENT...………6
CHAPTER 3: DATA AND MEASUREMENT..………..13
CHAPTER 4: RESULTS…….………..20
Tests of H1: Regulatory Monitoring of Firms in TSTR Industries..……….…….20
Tests of H2 and H3: Non-compliance of Firms in TSTR Industries...……….……..22
Tests of H4: Substitutes for Regulatory Monitoring………....………..24
CHAPTER 5: VALIDATING THE TSTR MECHANISM………..27
SOX Section 408………..………..27
Insider Trading Law Enforcement………...……….……..29
Regulatory Resource Constraints and Recessions………….……...………..30
Industry-Specific Importance of Regulation………....………..31
Additional Analysis and Robustness……….……....……….33
CHAPTER 6: CONCLUSION.……….35
TABLES……….……….………...37
APPENDIX 1: DATABASES……….……….………..52
APPENDIX 2: VARIABLE DEFINITIONS………...………..53
APPENDIX 3: EXAMPLE REGULATION-RELATED KEYWORDS AND PHRASES……..57
vii
LIST OF TABLES
viii
LIST OF ABBREVIATIONS
IRS Internal Revenue Service
1
CHAPTER 1: INTRODUCTION
In this paper I use an international setting to identify variation in the amount of regulatory monitoring and deterrence that firms face. Motivated by a recent World Bank policy paper which theoretically demonstrates the difficulty regulators face in deterring non-compliant behavior when firms in an industry are small (Basu and Dixit, 2014) as well as evidence documenting the spillover effects of regulatory monitoring for industry peers (Block and Feinstein, 1986; Gande and Lewis, 2009; Gleason et al., 2008; Schenk, 2012), I examine how the size distribution of firms in an industry affects the ability of regulators to effectively monitor and deter non-compliance. I find that firms in industries composed predominately of small firms receive disproportionately less regulatory monitoring and are more likely to engage in non-compliant activities, as manifested through tax avoidance and market liquidity. This phenomenon, termed Too Small to Regulate (or TSTR) by Basu and Dixit (2014), has important implications for regulators who must optimally choose which firms to monitor, as well as investors and other stakeholders who rely on regulators to ensure compliance.
2
because resource-constrained regulators cannot perfectly monitor all firms, and smaller firms face smaller maximum penalties because of limited liability. This Too Small to Regulate problem generalizes to a wide variety of regulatory settings.1 In addition, empirical evidence documents that regulatory monitoring of individual firms has spillover effects on other firms within the same industry by directing attention to and deterring potential non-compliance of peers (Block and Feinstein, 1986; Gande and Lewis, 2009; Schenck, 2012). This is because monitoring any individual firm provides information about and decreases the cost of monitoring its peers. Further, small firms are individually subject to less regulatory monitoring in the first place (Hoopes et al, 2012). These forces further compound the initial problem identified by Basu and Dixit (2014) because when a firm’s peers are small, these peers are subject to less regulatory monitoring at any given time and thus generate fewer regulatory spillovers. As a result of the theoretical forces predicted by Basu and Dixit (2014) as well as the spillover effects documented in the empirical literature, firms in industries composed predominantly of small firms are likely to face less regulatory monitoring and engage in more non-compliant behaviors.
In my empirical analyses, I provide what is, to my knowledge, the first empirical
evidence on the effect of industry structure on financial regulators. In particular, I identify TSTR country-industry-years as those where the median firm is small (in the bottom size quintile) relative to other firms in the same year and find that firms in TSTR industries are subject to less oversight by regulators, even when controlling for firm and industry size and commonly used industry concentration measures as well as industry and firm fixed effects. I indirectly measure regulatory monitoring for firms in many countries by counting regulatory monitoring-related
1
3
keywords in their corporate annual reports. Additionally, for U.S. firms I directly measure one type of regulatory monitoring by tracking the extent to which employees at the Securities and Exchange Commission (SEC) and Internal Revenue Service (IRS) access firms’ publicly available financial disclosures via the SEC’s EDGAR database. Both measures indicate that firms in TSTR industries face less regulatory monitoring.
Further, I find evidence suggesting that firms in TSTR industries are more likely to engage in non-compliant behavior. I choose two measures of non-compliance that are observable even when firms are subject to less regulatory monitoring: tax avoidance, measured with
effective tax rates, and stock liquidity. Firms in TSTR industries have lower effective tax rates, consistent with them engaging in more tax avoidance activities than they would if they were subject to greater monitoring by regulators. In addition, they experience significant stock
liquidity penalties, consistent with market participants facing a greater information disadvantage relative to informed traders, facing greater uncertainty about the level of firms’ compliance, or in some cases directly observing non-compliant activities.
Prior research demonstrates that other market monitors can act as substitutes for more formal regulatory monitoring (Dyck et al., 2008; Miller, 2006). Similarly, I find that firms in TSTR industries that have greater media coverage, financial analyst following, ownership by large institutional investors (e.g., mutual funds), and those which have a Big N auditor are less affected by TSTR. To the extent to which other market mechanisms can complement regulatory efforts, this can help resource-constrained regulators more efficiently deter non-compliance.
4
increases in monitoring after the advent of SOX 408 which mandates periodic filing reviews of all firms, and the effect of TSTR on liquidity decreases after the initial enforcement of insider trading laws. Further, the TSTR effect is amplified during recessions when regulators are particularly resource-constrained and in industry sectors where regulation is more important.
Most of the results in this paper use a cross-country setting to test predictions in many economies throughout the world. A cross-country study is ideal because it allows me to compare outcomes between TSTR and non-TSTR industries while controlling for the type of industry in which firms operate. This ensures that the outcomes that I document are attributable to a TSTR industry configuration and not innate differences across industries. An international setting also allows testing of this effect in a variety of regulatory environments, with the TSTR phenomenon occurring in both high and low enforcement countries.
My results regarding the Too Small to Regulate phenomenon have both practical and academic significance. First, whereas the prior academic literature has focused mainly on firm-level determinants of regulatory monitoring (Johnston and Petacchi, 2015), I demonstrate that the size distribution of firms within an industry also plays an important role in determining how much regulatory monitoring a firm receives. More importantly, this is a relevant issue to
5
My study is also important because the results indicate that regulators may want to allocate their scarce resources to monitoring firms that do not have the benefit of other informal monitors in order to ensure the most efficient use of these resources in terms of promoting
compliance. To the extent to which other market mechanisms can complement regulatory efforts, it is possible to reduce some of the negative consequences of TSTR.
6
CHAPTER 2: LITERATURE REVIEW AND HYPOTHESIS DEVELOPMENT While the benefits of any particular regulation are often context specific and depend on its relative costs and benefits (Arrow et al., 1995; Becker, 1968; Zingales, 2009), prior research has generally shown that greater regulatory enforcement and monitoring is beneficial.2 However, there is very little evidence on the effects of within-country variation in regulatory monitoring (Bushee and Leuz, 2005; Christensen et al., 2016), and even less about drivers of this variation (Kedia and Rajgopal, 2011). This paper adds insight into this literature by investigating
determinants and compliance outcomes of regulatory monitoring, with the caveat that my results are silent on the net costs of monitoring or the benefits of any specific regulation.
The hypotheses in my paper are based on the model from Basu and Dixit (2014) as well as a related literature on the spillover effects of enforcement. First, the Basu and Dixit (2014) model demonstrates that as the size of individual firms within an industry decreases (holding the total size of the industry constant) the total amount of regulatory monitoring required to ensure compliance for the industry as a whole increases. This is because the limited liability nature of corporations means that smaller firms essentially have less to lose because only corporate (not personal) assets are at stake when firms are penalized by regulators. As a result, smaller firms require a larger probability of detection in order to be successfully deterred from
non-compliance. On the other hand, although only a few segments or branches in a large firm may be found violating regulations, regulators can impose a much larger penalty by fining the
7
corporation as a whole.3 Thus managers of larger firms have incentives to monitor activities within the firm to ensure the entire firm is not penalized for non-compliance of a few segments, and regulators are essentially able to transfer some of the costs of monitoring to firms
themselves. Because of these forces, Basu and Dixit’s model predicts that it is disproportionately costly to monitor industries composed of small firms, or Too Small to Regulate (TSTR)
industries. Additionally, Basu and Dixit (2014) point out that this effect should also occur when some per-firm costs of monitoring are fixed (Dharmapala et al., 2011). The findings in Basu and Dixit (2014) imply that for a set amount of monitoring resources the probability that any
individual firm in a TSTR industry is monitored is smaller because its peers consume a greater amount of regulatory resources.4
Additionally, related findings from the empirical literature suggest that other factors may exacerbate the compliance problem that Basu and Dixit (2014) predict. As described below, regulators are disproportionately less likely to monitor firms in TSTR industries because of a lack of regulatory spillover from their (small) industry peers.
First, while regulators must satisfy a number of political, policy, and social objectives, they are also sensitive to the relative monetary costs and benefits of any given investigation. For example, anecdotal evidence indicates that the SEC is less likely to investigate companies when they expect the cost of the investigation to outweigh the value in terms of fines or investor benefits (Stewart, 2011). As a result, the limits on expected penalties and disproportionate costs to monitor small firms which drive the Too Small to Regulate problem described by Basu and
3 For example, consider the case of Wells Fargo, which was fined $224 million dollars in September 2016 by multiple U.S. government agencies for fraudulent business practices (http://www.reuters.com/article/us-wells-fargo-carloans-idUSKCN11Z2MN). Fines of this magnitude are simply not practical for most of the firms that I study because this amount exceeds the market value of more than half of the firms in my sample.
8
Dixit (2014) may in turn lead regulators seeking to maximize their expected payoff to monitor small firms less often in the first place. This is consistent with evidence such as Hoopes et al. (2012) which shows that the IRS is less likely to audit small firms.
These effects are likely to be amplified at the industry-level by the presence of regulatory spillover effects documented in prior studies which show that enforcement actions targeted at a single firm within an industry can lead to increased regulatory monitoring, capital market penalties, and deterrence of misbehavior for industry peers (Gande and Lewis, 2009; Gleason et al. 2008; Jennings et al. 2011; Schenck 2012). This is because monitoring one firm in an industry provides information about its industry peers and decreases the costs of monitoring those peers (Block and Feinstein, 1986). Firms in TSTR industries are much less likely to face spillover effects from their peers in the form of heightened regulatory monitoring or deterrence because their TSTR peers are unlikely to be singled out by regulators and thus unlikely to direct regulatory attention to other firms in the same industry. Further, prior research has shown that even when small firms are monitored by regulators, they are less likely to create spillovers for their peers, further compounding this result (Gleason et al., 2008).
Combined, these forces suggest that firms in Too Small to Regulate industries are not only more difficult to deter from non-compliance, but they also operate in an environment that is subject to unusually little oversight because firms are individually unlikely to be monitored and are also unlikely to be subject to regulatory monitoring as a result of spillover effects from their peers.5 This leads to my first hypothesis:
5 Essentially this relaxes two assumptions in Basu and Dixit (2014): first that all firms are equally likely to be monitored, and second that the total amount of monitoring resources for the industry as a whole is exogenously determined (i.e., not affected by industry composition). This second assumption is more likely to be the case for regulators whose monitoring role is industry-specific; for example, mine safety inspectors will not inspect
9
H1: Firms in TSTR industries are subject to less regulatory monitoring.
While my prediction in H1 is intuitive, there are many reasons why it might not be borne out in the data. For example, some critics argue that regulators spend a disproportionate amount of resources policing small companies while misbehavior from larger corporations goes
unchecked (Burns, 2003; Taibbi, 2012). Industries composed of large firms may also have greater political influence and could be subject to less monitoring because of regulatory capture (Blackburne, 2014). Thus it is an empirical question whether this phenomenon exists.
Next, if firms in TSTR industries face lower expected costs of non-compliance, as predicted by Basu and Dixit (2014), and less monitoring as predicted in H1, then they will be more likely to engage in non-compliant activities. While firms in TSTR industries are likely to engage in a wide variety of non-compliant activities, I focus on those which are empirically observable even when regulatory monitoring is low (Wang, 2013). This requirement is especially important in my setting because I predict that firms in TSTR industries are subject to an
unusually low amount of regulatory monitoring, making measurement error in measures of non-compliance that rely on regulatory detection especially severe. Given this requirement, I choose to focus on two measures of non-compliance: tax avoidance and liquidity.6
First, tax avoidance is one type of non-compliant activity explicitly suggested by Basu and Dixit (2014). I use firms’ effective tax rates as a proxy for tax avoidance in this setting, which are easily observable because firms report their yearly tax expense in their financial statements. Effective tax rates can pick up both legal tax avoidance and tax aggressiveness;
6
Non-compliant activities could include financial fraud, asymmetric disclosure of material information to a subset of investors and insider trading, inadequate internal controls, company-sanctioned use of bribes, or non-compliance with a variety of non-financial regulations such as health and safety requirements for both employees and
consumers. These types of activities are difficult to directly observe, especially for a large cross-country sample where this type of data is not widely available. Additionally, differences across countries in regulators’ definition of and response to compliant activities make it difficult to directly compare reported occurrences of
10
conceptually I am interested in measuring all types of questionable behavior that would be curbed by more intense regulatory monitoring, including those that might be technically legal. Thus effective tax rates are an appropriate outcome to measure. My next hypothesis is thus:
H2: Firms in TSTR industries are more likely to engage in tax avoidance.7
Additionally, market liquidity constitutes an indirect outcome of regulatory compliance that is easily observable and comparable across countries, where firms that are more compliant with rules and regulations should have greater liquidity. This is consistent with Bushee and Leuz (2005) and Christensen, Hail, and Leuz (2013 and 2016) which document increases in liquidity for firms who experience increases in the quality of securities and disclosure regulations, and, most importantly, increases in the amount and intensity of regulatory monitoring and
enforcement. To the extent that market participants are subject to a greater information
disadvantage relative to informed traders (for example because of insider trading), face greater uncertainty about the compliance of firms in TSTR industries because of a lack of regulatory monitoring, or observe some non-compliant activities directly, TSTR firms are expected to have lower stock liquidity. This prediction is reasonable; as pointed out by Christensen et al. (2016), one of the purposes of securities regulation in particular is to ensure greater liquidity. Although examining tax avoidance allows me to identify one specific mechanism for non-compliance, the broad nature of liquidity measures allows me to capture the aggregate effect of many different types of potential non-compliance, including non-compliance with non-financial regulations such as health and safety requirements; however, this must be caveated by the fact that liquidity has the potential to capture other sources of uncertainty and information asymmetry unrelated to
7
11
regulatory compliance.8 Lastly, liquidity has implications for the cost of capital and, like tax avoidance, is observable when regulatory monitoring is low. As a result:
H3: Firms in TSTR industries have lower stock liquidity.
H2 and H3 are not without tension. Advances in technology may have decreased the cost of monitoring so that firms in TSTR industries are adequately deterred from non-compliance. Additionally, it is possible that firms are able to make use of complicated ownership and legal structures in order to limit the legal liability of each subsidiary, in which case small firms would not face smaller maximum penalties relative to larger firms and I would not observe the TSTR effect. More generally, the assumptions of the Basu and Dixit (2014) model may simply not be representative of the real world. Lastly, there is considerable debate on the benefits of regulation; thus while firms in my sample might be violating tax regulations, they might actually benefit from higher liquidity if market participants view non-compliance as optimal.
Although firms in TSTR industries may receive less monitoring from regulators, prior research shows that informal market monitors can sometimes perform a similar function as regulatory monitors (Dyck et al., 2008; Miller, 2006), and high quality auditors have been shown to exercise a stronger deterrent role (Becker et al., 1998). As a consequence, higher attention by these market intermediaries may mitigate non-compliance in TSTR industries. This is an important avenue to investigate because to the extent that other market mechanisms can complement regulatory efforts, this can help resource-constrained regulators more efficiently enforce regulations. This leads to my final hypothesis:
12
H4: The effect of being in a TSTR industry (on tax avoidance, liquidity) is weaker for
firms subject to greater monitoring by other market participants (larger analyst
13
CHAPTER 3: DATA AND MEASUREMENT
I obtained the main sample of accounting and market data from Thomson Reuters Datastream with data spanning the fiscal years 1991 to 2011 for firms in 59 countries. I/B/E/S, the Thomson Reuters International Mutual Fund (TIMF) database, Ravenpack, and BvD Osiris are used for some control and outcome variables.9 Additionally, some tests in this paper use U.S.-only databases, in particular SEC EDGAR download data and Audit Analytics; for these tests, accounting and market data from Compustat and CRSP are used. More detailed
information on the databases is given in Appendix A1.
To empirically identify country-industry-years that are most likely to be Too Small to Regulate, I focus on industries for which the median firm is relatively small. In order to come up with a measure of firm size that is interpretable and comparable across time, I form yearly quintile ranks of firms across all countries by end of year market capitalization (lnMVE). If the median firm within an industry-country-year is in the lowest yearly size quintile then that
industry is given a value of TSTR equal to 1, and 0 otherwise. Tests for the main sample identify industries at the 4-digit ICB level.10
As presented in Table 1 Panel A, 6% of the final sample of firm-years are classified as
TSTR. However, as shown in Panel B there is significant variation across countries. Several
9
My sample ends in 2011 because my Osiris data end in that year.
14
small countries, for example Bulgaria, Sri Lanka, and Cyprus have high proportions of firms in TSTR industries compared to the overall sample. Part of this is driven by the specific
configuration of firms within industries in those countries. Additionally, some countries are composed of predominantly small firms because of less-developed economies. This will result in a large number of firms being classified into TSTR industries because a larger proportion of all firms in the total economy fall into the lowest overall size quintile. To the extent that a regulator will not allocate resources to monitoring firms if the overall size of the economy and individual firms are small, in particular because there are initial fixed costs of establishing regulation and monitoring mechanisms in the first place, then it makes sense that less-developed economies are more likely to suffer from the TSTR problem. Further, Panel C of Table 1 shows that TSTR firms are spread across many types of industries. The industry with the highest proportion of TSTR firms is Basic Resources (Forestry and Mining), while a very small proportion of banks are in TSTR industries. Historical reasons, institutional environment, and culture are all factors that may explain why particular industries tend to be TSTR in certain countries (for example, French consumers have a preference for small local stores whereas the U.S. is dominated by superstores), but it is important to distinguish the Too Small to Regulate story from the effects of previously studied drivers of regulation such as financial development or industry. Because of this, all specifications include country and industry or firm fixed effects, which allows me to control for static country-, industry-, and firm-level characteristics such as financial
development. I also control for year fixed effects.11,12,13
15
One important caveat of my TSTR measure is that it considers only publicly-traded firms. Because securities market regulators are tasked mainly with regulating publicly-traded firms, my measure is well-suited to the task of identifying the effects of inadequate monitoring by
securities regulators. However, the TSTR effect can arise in a number of regulatory contexts that involve privately held firms, for example health and safety regulations and, importantly, tax compliance. Thus my TSTR variable is a noisy measure of non-securities regulation in industries where the industry configuration of publicly-traded firms is not a good proxy for the industry configuration of both public and private firms, which should make it especially difficult for me to document significant effects on tax avoidance.
I use a variety of control variables in my empirical tests that correspond to the dependent variable that each analysis attempts to explain. Variable definitions are provided in Appendix A2. Importantly, each specification controls for several key variables. First, I control for firm size (lnMVE) to ensure my results are not simply picking up the fact that smaller firms are subject to less regulatory scrutiny, regardless of industry composition.14 I also control for the aggregate size of the entire industry (lnSumMVE).15 Additionally, I control for two measures of competition related to industry composition to ensure my TSTR measure is not picking up
12 Untabulated results identifying TSTR industries based on within-country-year size rankings provide similar though weaker results, consistent with size being an absolute and not relative construct (i.e., with respect to binding limited liability or whether a firm is large enough to induce regulators to expend fixed monitoring costs).
Additionally, size rankings within country-years with very few observations are more subject to measurement error. 13
The number of firms in an industry could potentially moderate the TSTR effect, either because industries with many small firms are more difficult to monitor than industries with a few small firms, or because industries with many small firms are economically more important and a greater focus of regulators. Untabulated results interacting
TSTR with the number of firms in the industry show inconsistent results, suggesting both forces are at play.
14 Results are consistent when instead of logged MVE I control for a firm’s percentile MVE ranking across all firms in that year, an indicator for whether its MVE is in the lowest yearly size quintile (similar to the TSTR measure), or controlling for its unlogged and squared MVE.
16
competitive pressures that increase incentives for firms to violate regulation (Karuna et al., 2012): the Herfindahl-Hirschman Index (HHI) and the industry’s concentration ratio
(CRATIO).16 Lastly, I control for the median age of firms in the industry (Med_Age) because small firms tend to be younger and firm lifecycle could affect monitoring and compliance.
H1 predicts that TSTR industries are subject to less regulatory oversight. Oversight is difficult to measure because the private monitoring activities of regulators are not publicly available and outputs of monitoring (i.e., enforcement actions) are jointly affected by the amount of wrongdoing and the amount of regulatory monitoring (i.e., whether the wrongdoing is
observed by regulators; see Coffee, 2007; Jackson and Roe, 2009). I use two different
approaches to measure regulatory oversight, one which can be used for firms in my international sample, and a second measure only available for firms which file financial reports with the SEC.
My first measurement approach indirectly measures the amount of firms’ regulatory monitoring by analyzing their annual reports. Wiesen and Wysocki (2015) demonstrate that regulation-related word counts vary predictably with the amount of regulation that firms face. Similarly, I analyze the English-language annual reports of firms in my sample and construct two measures based on how often firms mention enforcement-, compliance-, and deterrence-related keywords in general and how often they mention the names of specific securities regulators.
The keywords used to form the first text-based regulatory monitoring measure,
RegWords, were generated by compiling words likely to be used by a company to describe any measures the firm is taking to comply with laws and regulations (e.g., compliance); words describing active monitoring by regulators to ensure compliance, for example surprise
inspections, filing reviews, or inquiries (e.g., deterrence); keywords likely to indicate penalties or correction imposed by regulatory monitors after the discovery of non-compliance (e.g.,
17
enforcement); and phrases that refer to the names of government agencies and regulators, especially financial regulators. Example keywords and phrases are given in the Appendix with a more complete list in the Internet Appendix. RegWords is the total number of these keywords.1718 This measure is empirically reasonable because firms would be unlikely to discuss regulatory enforcement and monitoring activities if they weren’t having these types of interactions. As a result, if firms in TSTR industries face less regulatory monitoring, I expect to find significantly lower levels of regulation-related keywords in their reports.19
My second measure of text-based regulatory monitoring relates more specifically to securities regulation and counts the number of times firms mention specific securities regulators,
RegulatorNames. Similar to the RegWords measure, if firms in TSTR industries have fewer interactions with securities regulators through regulatory monitoring, then they should be less likely to discuss them in their annual reports.
The sample of annual reports used to generate these text-based monitoring measures spans 43 countries including the U.S. over the fiscal years 1998-2011 and was obtained from Bureau van Dijk’s Osiris database. Further details about the data can be found in Lang and Stice-Lawrence (2015). One limitation of this sample is that it only includes those firms which issued an English language annual report. International firms with English-language annual reports tend to be larger, more internationalized, from English-speaking countries, and with better governance (Jeanjean et al., 2010; Lang and Stice-Lawrence, 2015). Because these types of firms are more
17 The Internet Appendix can be found at: https://sticelaw.web.unc.edu/research-resources/.
18 All specifications including RegWords in the paper control for document length (polynomial of degree five). I find similar results if I scale RegWords by the total number of words in the document or if I exclude words relating to audit and legal (including litigation) activities which may pick up governance mechanisms unrelated to regulators. 19
18
likely to be subject to scrutiny from regulators and other monitors, it should be particularly difficult for me to document a TSTR effect using this subsample.
My final measures of regulatory monitoring use data on downloads of financial reports from the SEC’s EDGAR database by employees in two government agencies: the SEC and IRS. Using a method similar to Bozanic et al. (2016), I identify requests by SEC and IRS employees of firms’ publicly available financial information by tracking requests made by IP addresses allocated to these two agencies. My measures are SEC_TotalViews (IRS_TotalViews)and
SEC_UniqueViews (IRS_UniqueViews) and are the total number of a firm’s filings (including repeat downloads) that were downloaded by SEC-affiliated (IRS-affiliated) IP addresses over the fiscal year and the total number of a firm’s filings that were downloaded by SEC IP addresses for the first time, respectively. My sample period spans from 2004 to 2008, because 2004 is the first full fiscal year for which EDGAR download data are available and because downloads by the SEC are no longer available from the EDGAR database beginning in 2009.20
EDGAR downloads by government employees constitute a direct measure of one method of monitoring. For example, because the SEC’s Division of Corporation Finance is tasked with reviewing firms’ regulatory filings and, if necessary, issuing comment letters to firms to improve or clarify disclosure, EDGAR downloads by SEC employees may capture document views that are part of formal filing reviews. Similarly, the SEC’s Division of Enforcement is charged with identifying and investigating cases of financial fraud and misconduct and may consult a firm’s publicly available filings to help in its investigation, meaning that SEC EDGAR downloads
20
19
could also capture part of the regulatory task of that department.21 Although SEC employees can access EDGAR filings through an internal interface referred to as Internal EDGAR, anecdotally in the past many SEC employees have used the online interface out of convenience.
Additionally, although reviewing EDGAR filings is less directly related to the monitoring role of the IRS, firms’ regulatory filings contain performance and tax information that is relevant to tax authorities, and Bozanic et al. (2016) have demonstrated that IRS employees do indeed use the EDGAR database, consistent with it being an additional source of information in their audits.
21 My measure cannot distinguish between downloads by different departments within the SEC because the
20
CHAPTER 4: RESULTS
Tests of H1: Regulatory Monitoring of Firms in TSTR Industries
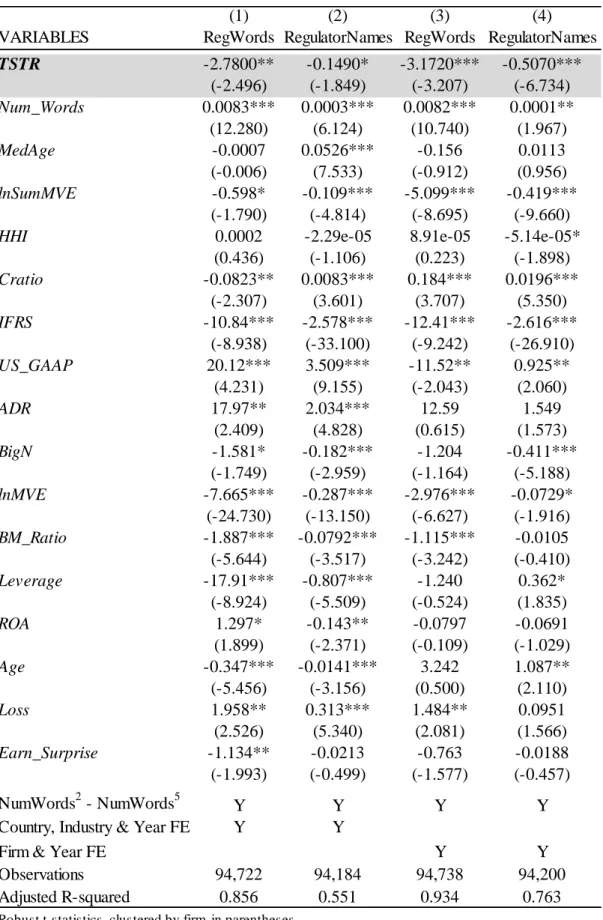
Table 2 reports the results of my first test of H1 using regulatory word counts for the full sample of international firms. If firms in TSTR industries are subject to less regulatory oversight and my regulatory word count measures capture regulatory monitoring, then I would expect that TSTR firms would have lower levels of regulatory deterrence-, compliance-, and enforcement-related words in their annuals reports and discuss specific securities regulators less often. Consistent with this hypothesis, Table 2 shows significantly lower levels of RegWords and
RegulatorNames for firms in TSTR industries, even in the presence of country, industry, and year fixed effects (Columns 1 and 2) and firm and year fixed effects (Columns 3 and 4). In general, the regulatory word count measures behave fairly predictably; for example, they are strongly positively associated with the total length of the annual report (Num_Words), which is to be expected because the amount of financial disclosure is another indication of regulatory compliance, and because these two measures are to some extent mechanically related
(underscoring the importance of controlling for total length when using any word count measure).22 In addition, firms appear to have higher regulatory monitoring when they have an American Depositary Receipt (ADR) or are reporting a loss. Curiously, the coefficient on lnMVE
is negative, while the relation with US_GAAP is inconsistent, even though these measures should
21
generally be positively associated with regulatory monitoring. However, this is likely a result of collinearity with Num_Words, which prior research has shown to be strongly positively
associated with size and accounting standards (Lang and Stice-Lawrence, 2015). When
Num_Words and its powers are omitted, these variables are positively associated with RegWords
and RegulatorNames.23
While the results in Table 2 are encouraging, they must be caveated by the fact that regulatory word count measures are likely to be noisy and subject to the concerns voiced by Jackson and Roe (2009) because they also capture ex post enforcement which is a joint function of compliance and monitoring. Because of these concerns, in Table 3 I focus on the U.S.
subsample in order to more tightly link the TSTR phenomenon with one type of regulatory monitoring: EDGAR downloads by government employees. While this second measure has the benefit of directly capturing regulatory monitoring, this test can only be conducted within a single country. The main benefit of the test in Table 2 is the fact that the presence of multiple countries allows me to fully control for industry type while still examining industry composition.
The results in Table 3 Panel A support the results from my international sample and show that SEC employees are significantly less likely to download the filings of firms in TSTR
industries, using 3-digit SIC code industries and controlling for both industry and year fixed effects and firm and year fixed effects. This is even after controlling for a variety of factors which have been linked to outcomes of regulatory monitoring in the past (i.e., comment letters, Johnston and Petacchi, 2015). These control variables behave reasonably, with firms more likely
23 For the subset of U.S. firms in my Datastream sample to which I can link SEC EDGAR download data, I find that
22
to be monitored if they are larger, are not audited by a Big N auditor, or if they have issued a restatement in the current or prior year.24
In Panel B of Table 3, I examine monitoring of firms in TSTR industries by IRS employees using 4-digit SIC industries to match the finer industry specialization of the IRS (Smith, 2001). These results show that firms in TSTR industries also experience significantly lower levels of monitoring by IRS employees. While the magnitude of the effect is smaller than for SEC monitoring, it is significantly negative in three of the four specifications.25 This smaller economic magnitude is consistent with IRS employees using the EDGAR database less
frequently than SEC employees as it is less directly related to their regulatory role, as can be seen in the descriptive statistics of Table 1. Overall, the results of Table 3 further support my first hypothesis that firms in TSTR industries are subject to less regulatory monitoring.
Although neither of my measures of regulatory monitoring are perfect, taken together, the results of my tests of H1 suggest that the TSTR effect leads to lower monitoring. This is true both when tested in a setting where industry characteristics and economic environment can be better controlled for and also in a setting with a more direct and precise measure of monitoring.
Tests of H2 and H3: Non-compliance of Firms in TSTR Industries
In order to test H2, I investigate the effects of TSTR industry membership on tax avoidance. I capture tax avoidance using a firm’s effective tax rate (ETR), where a lower
effective tax rate indicates that the firm is more likely to be avoiding taxes. Following Dyreng et
24 Results in the Internet Appendix show my SEC monitoring measures behave predictably in other settings. For example, firms are more likely to receive a comment letter in periods when the SEC is viewing more of their filings, further supporting these measures as proxies for SEC monitoring.
23
al. (2008),I winsorize a firm’s ETR to be between 0 and 1.26 Consistent with H2, I expect that firms in TSTR industries will be more likely to engage in tax avoidance activities.
In addition, I test H3 using three measures of liquidity calculated using Datastream market data: bid-ask spreads, the Amihud price impact of trade measure, and zero return days. Bid-ask spread is the difference between the bid and ask price divided by the average of the two and measures the explicit costs of trading. The Amihud liquidity measure is based on the price pressure measure from Amihud (2002) and is calculated as the absolute value of returns divided by volume. Lastly, zero return days is calculated as the percent of days during the year on which the stock price did not change, based on the idea that little trade is likely to have occurred when there is no change in price. If firms in TSTR industries suffer from a lack of regulatory oversight, then consistent with H3 I expect that they will engage in a variety of non-compliant activities. Because a lack of regulatory monitoring increases uncertainty about compliance and the amount of information asymmetry relative to informed traders, and because some types of
non-compliance may be directly observed by market participants, a rational market should respond by increasing the cost of trading in that firm’s stock, thereby decreasing liquidity.
The results of these analyses for my full sample of countries are reported in Table 4 Panels A and B for specifications including country, industry, and year and firm and year fixed effects, respectively. Both panels lend strong support to H2 and H3, with firms in TSTR industries reporting significantly lower tax rates and experiencing significantly lower liquidity relative to firms in non-TSTR industries. Thus it appears that not only are firms in TSTR
24
industries subject to less regulatory monitoring, but they also appear to engage in non-compliant behaviors in response to this lack of oversight.27
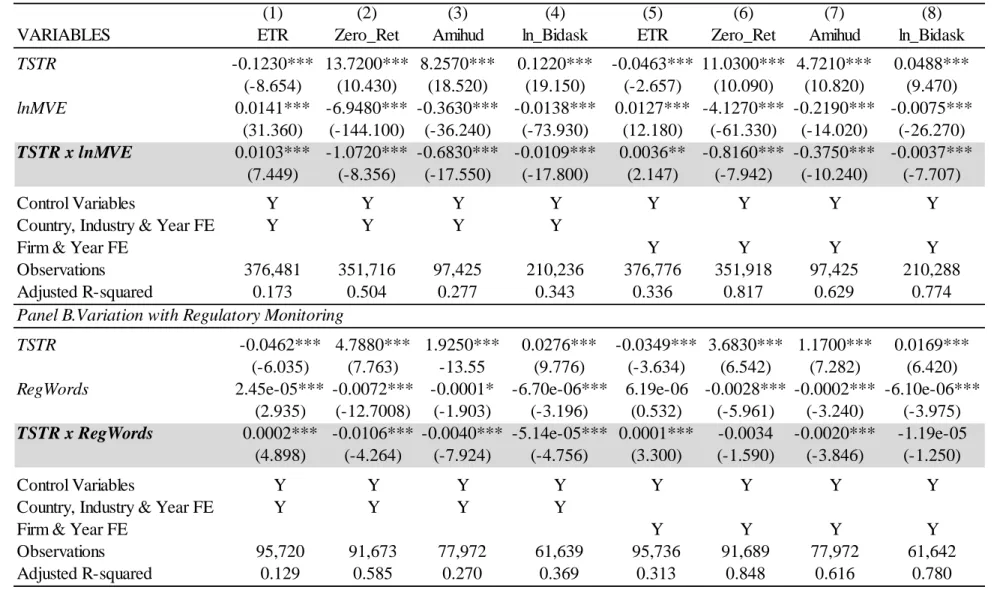
I provide further evidence of this regulatory non-compliance by showing that the effect of being in a TSTR industry varies predictably across firms. In Table 5 I examine the effect that a firm’s own size and amount of regulatory monitoring have on the relation between TSTR and tax avoidance and liquidity. In Table 5 Panel A, I reestimate the tests in Table 4 Panels A and B and show that the effect of TSTR on tax avoidance and liquidity is weaker for larger firms in TSTR industries, consistent with large firms facing larger maximum penalties and being monitored more frequently than small firms, even in TSTR industries. Similarly, in Panel B I show that the effect of TSTR on tax avoidance and liquidity is weaker for firms with higher levels of
regulatory monitoring, RegWords, consistent with the presence of monitoring acting as a deterrent. These results complement the results in my previous analyses by showing that the effect of TSTR varies predictably with size and regulatory monitoring, further supporting my interpretation of the mechanism driving the results in Table 4.
Tests of H4: Substitutes for Regulatory Monitoring
Next I examine the effect that informal monitoring has on the consequences of TSTR. In my tests of H2 and H3, I demonstrate that inadequate regulatory monitoring in TSTR industries leads to more non-compliant behavior on the part of firms and that the market penalizes these firms with lower liquidity. However, Dyck et al. (2008) and Miller (2006) show that other
market participants can serve a monitoring role. In Table 6 I interact my TSTR variables with the
27
To further confirm my interpretation of the ETR results in Table 4 as evidence of tax avoidance, I obtain data on tax haven activity for a subset of my firms from the BvD Osiris database and demonstrate in the Internet Appendix that firms in TSTR industries have a significantly greater number of subsidiaries incorporated in tax haven countries (t-statistic = 5.2), consistent with these firms being more likely to engage in tax avoidance activities, in particular those likely to be in violation of tax regulations (see Balakrishnan et al., 2012; Desai et al, 2006; and Lisowski, 2010, which use tax haven activity of U.S. firms as evidence of tax aggressiveness). Because these data are only available for a subset of firms in a single year, I rely on the ETR measure in my main analyses.
25
presence of four other monitors: analysts, institutional owners, the news media, and auditors. Analyst following (Analyst) reflects the number of analysts providing earnings forecasts about a firm in a given year; institutional ownership (Inst_Own) captures the percent of a firm’s shares held by mutual funds; media coverage (Media_Covg) represents the number of news articles written about a firm in a given fiscal year; and BigN is an indicator variable for whether a firm is audited by a Big N auditor. All four of these market participants have been shown to exert monitoring and disciplinary power over firms, thus H4 predicts that the TSTR effects
documented in Table 4 will be weaker in the presence of these monitors. The results reported in Table 6 are consistent with H4 and demonstrate that the effect of TSTR on tax avoidance and liquidity is weaker when analyst following, institutional ownership, and media coverage are high, and when a firm has a Big N auditor, suggesting that these monitors can mitigate the effects of TSTR.
26
27
CHAPTER 5: VALIDATING THE TSTR MECHANISM
I rely on assumptions from the Basu and Dixit (2014) model and the prior empirical literature on regulatory monitoring and spillover to generate my hypotheses and interpret my results. In this section I conduct a series of analyses which show predictable variation in the strength of the TSTR effect in order to validate these assumptions and the mechanisms that are driving my results. By documenting meaningful industry, country, and time variation in the TSTR phenomenon, I am able to further support the interpretation of my main results. Specifically I show that the effects of being in a TSTR industry vary predictably around
exogenous changes in monitoring (SOX 408), enforcement (insider trading laws), and resource constraints (recessions) and also with the importance of regulation to the industry.
SOX Section 408
Table 3 shows that firms in TSTR industries are subject to less monitoring by the SEC and IRS. Basu and Dixit (2014) and the literature on regulatory spillovers would suggest that this occurs because these industries are disproportionately costly to monitor and subject to fewer regulatory spillovers; however, it is possible that some other unobserved factor could be driving this relation. To further validate my interpretation of these results, I show that the effect of TSTR on SEC monitoring varies predictably with an exogenous shock to how the SEC allocates
28
SOX Section 408 requires the SEC to review every firm at least once every 3 years.28 Prior to SOX 408, the SEC was free to choose which firms to review, with some firms potentially going many years without being monitored. As a result, the SOX 408 mandate to periodically review all firms had a disproportionate effect on the monitoring of firms which had previously been overlooked, specifically small firms. Disproportionate increases in the
monitoring of small firms should in turn lead to disproportionate increases in the regulatory spillover they generate. This implies that increases in regulatory spillovers should be especially pronounced in industries composed of small firms, or TSTR industries, leading to particularly large increases in the monitoring of these firms. As a result, I predict that SOX Section 408 decreased the TSTR effect on SEC monitoring, or, stated conversely, that firms in TSTR
industries experienced disproportionately large increases in SEC monitoring around SOX 408. If regulatory spillovers exist, then I should find that increases in monitoring are particularly
pronounced in TSTR industries, even when controlling for increases in monitoring that individual firms experienced under SOX 408 as a result of their own size.
In Table 7 Panel A, I control for the effect of SOX 408 based on a firm’s own size (SOX408 x lnMVE) and demonstrate that the TSTR effect is considerably weaker in the post-SOX 408 period (TSTR x SOX408 is significantly positive) consistent with the presence of industry spillovers amplifying the effect of monitoring small firms in TSTR industries around SOX 408. These results confirm the mechanism in H1 by validating that a lack of regulatory monitoring for firms in TSTR industries is driven to some extent by a lack of regulatory spillover from small peers. Additionally, they provide novel evidence on the effects of SOX 408 by
showing a fundamental shift in how SEC monitoring was conducted after the Section was
29
implemented, as well as evidence that this requirement appears to have mitigated one type of regulatory shortcoming. However, I do not examine the net benefit of this shift in monitoring and cannot speak to the optimality of the SEC’s behavior before or after SOX 408.
Insider Trading Law Enforcement
In my analyses I use liquidity as an indirect measure of regulatory compliance because non-compliance on the part of the firm will increase uncertainty and information asymmetry between informed and uninformed investors thereby increasing illiquidity. One reason this is the case is that informed insiders have knowledge of a firm’s non-compliant activities, leading to information asymmetry between informed and uninformed investors. In other words, insider trading is one channel through which non-compliant activities affect market liquidity. To provide evidence that this is the case, I use staggered enforcement of insider trading laws across the countries in my sample to show that the effect of being in a TSTR industry on liquidity is lower when insider trading is curbed. As demonstrated in Bhattacharya and Daouk (2002) and
Bushman et al. (2005), countries which passed insider trading laws did not experience benefits of these laws until after the laws had been enforced. I therefore use the dates of initial insider trading law enforcement to identify decreases in the amount of insider trading in a country that are relatively exogenous with respect to individual firms and industries.29 If insider trading is one of the mechanisms by which firms in TSTR industries experience lower liquidity, then I expect that decreased insider trading after enforcement of these laws will mitigate the liquidity effects of being in a TSTR industry. The results of my analysis, reported in Table 7 Panel B, are consistent with my prediction and show that the effect of TSTR is mitigated for two of my three liquidity
29
30
measures after the enforcement of insider trading laws. I have no prediction for how insider trading law enforcement would affect tax avoidance and do not find a significant relation. Overall, these results are consistent with insider trading being one of the mechanisms by which non-compliance of firms in TSTR industries affects firm liquidity.
Regulatory Resource Constraints and Recessions
One of the critical conditions for the Too Small to Regulate phenomenon to occur is that regulatory resources be constrained so that regulators cannot perfectly monitor all firms. As a natural extension, increases in regulatory constraints should exacerbate this monitoring problem. To demonstrate that this is the case, I classify periods when regulators are particularly resource-constrained by identifying years in which countries are in recession (defined as years when per-capita GDP growth is negative) and predict that the effect of being in a TSTR industry on liquidity and tax avoidance is amplified during these periods.30 During recessionary periods, regulators are more likely to experience exogenous decreases in the budgets allocated to them while potentially facing a greater workload; regulators are more likely to engage in regulatory interventions during recessions (Zingales, 2009), and financial pressures lead a greater
proportion of firms to cut corners and violate regulations thus increasing the number of violations regulatory monitors need to investigate and resolve (Beneish et al., 2012; Rosner, 2003; Simpson, 1987). Consistent with my prediction, Table 7 Panel C shows that tax avoidance and illiquidity of firms in TSTR industries are especially high during recessionary periods.
31
Overall, these results suggest that the effects of being in a TSTR industry tend to be amplified when regulators are particularly resource-constrained.31
Industry-Specific Importance of Regulation
Lastly, while I rule out industry as an explanation for my results by including industry and firm fixed effects in my specifications, it is possible that the Too Small to Regulate effect may vary systematically across industries. I examine this possibility in Table 7 Panel D by measuring the importance of regulation to an industry and showing that when regulation is more important the liquidity consequences of being in a TSTR industry are significantly stronger.
Certain industries face higher levels of regulation because lawmakers believe that
regulatory interventions are particularly important to mitigate externalities and market failures in these industries. For example, healthcare-related industries such as hospitals or pharmaceutical companies tend to face relatively high levels of regulation because failures in these markets are perceived to be particularly costly. Similarly, the recent financial crisis has shown that problems in financial industries can lead to negative consequences for the economy as a whole. On the other hand, industries related to consumer goods such as clothing or furnishings have historically been subject to less industry-specific regulation because the costs of failures in these markets are perceived to be smaller. Consequently, I predict that the liquidity effects of non-compliance in TSTR industries will be pronounced when regulation is more important because non-compliance in these industries should lead to greater uncertainty and information asymmetry of market participants.
31
One potential concern is that these results are driven by firms in TSTR industries experiencing exacerbated effects of the recession itself. However, the main effect of the Recession variable and its interaction with TSTR rarely exhibit the same sign; as a result, firms in TSTR industries do not appear to experience exacerbated effects of recessions themselves (i.e., TSTR industries don’t tend to be particularly procyclical) but instead appear to respond
32
In Table 7 Panel D, I interact TSTR with the importance of regulation to an industry,
Reg_Importance, which is constructed using an index of industry regulation from Al-Ubaydli and McLaughlin (2015) which measures the amount of industry-specific regulation for each industry in the U.S. in any given year. I assume that regulation is more important in industries with more industry-specific regulation because in equilibrium lawmakers will impose more regulations on industries where the benefits are greatest. Additionally, while the importance of regulation may vary across countries because of political, economic, cultural, and geographic factors, most aspects should remain constant. This reasoning is consistent with Rajan and Zingales (1998) who use U.S. data to infer industry dependence on external financing internationally. Further, I find reasonable variation in Reg_Importance; industries related to healthcare, oil and gas, and financial services have high values of Reg_Importance while industries related to consumer goods and industrial products have low values.
Consistent with my prediction, in Table 7 Panel D I find that the liquidity effects of being in a TSTR industry are pronounced for firms that are in industries where regulation is more important, suggesting that the effects of being in a TSTR industry are amplified when the consequences of regulatory non-compliance are greatest.32 By documenting a predictable link between the magnitude of the TSTR effect on liquidity and the importance of regulation, I further support my interpretation that a TSTR industry configuration affects liquidity through effects on regulatory monitoring and compliance. It would be unlikely that the TSTR relation with liquidity would vary predictably with the importance of regulation if this relation were driven by factors completely unrelated to regulation.
33
Additional Analysis and Robustness
While the results presented in Table 7 further confirm my interpretation of my main analyses, a variety of factors could potentially confound the observed relation between TSTR industry configuration and regulatory compliance and monitoring. For example, if the prevalence of small firms in TSTR industries is a sign that they have less developed stock markets then my empirical measure of TSTR could be capturing changes in stock market development that are not controlled for by my firm, country, industry, and year fixed effects. Because industries in
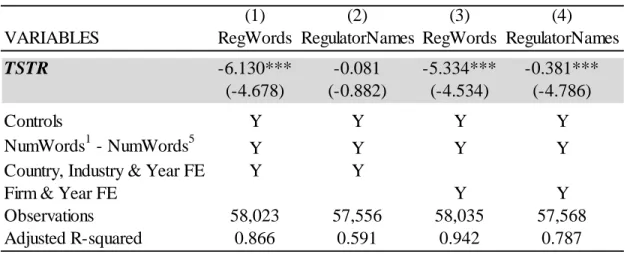
countries with well-developed stock markets are unlikely to experience changes to their stock market development, the results of Table 3 which examines the effect of TSTR on monitoring by the SEC within the well-developed market of the U.S. are unlikely to be driven by changes in stock market development. In addition, Table 8 presents the main results from Tables 2 and 4 for only those countries which have the highest quality regulatory and reporting practices according to Table 3, Panel C of Leuz (2010). Results are similar to the main specifications.33
In order to rule out other potential factors, I conduct a battery of robustness tests which vary the fixed effect structure in my international analyses. I include country-year, industry-year, country-industry, and country-industry-year fixed effects (using 2- and 3-digit ICB codes which are broader than the 4-digit ICB codes used to define my TSTR measure), and additionally calculate standard errors that are clustered by industry-country, country-year, industry-year, country, and industry and continue to find consistent results.
One further concern could be that firms strategically choose to remain small in order to avoid regulatory monitoring. While this has been documented around specific thresholds (Iliev, 2010), it seems much less likely that firms would limit their long-term growth in order to avoid regulation. Further, this seems even less likely to occur at the industry level because it would
34
35
CHAPTER 6: CONCLUSION
In this paper I examine a phenomenon called Too Small to Regulate (TSTR) which occurs when an industry is predominantly composed of small firms. Basu and Dixit (2014) predict that firms in such industries are more difficult for resource-constrained regulators to deter because of limited liability constraints on penalties and fixed costs of monitoring, while
empirical evidence suggests this monitoring and deterrence problem will be exacerbated at the industry-level by regulatory spillovers (Block and Feinstein, 1986; Schenk, 2012). Consistent with these predictions, I demonstrate that a firm’s level of regulatory monitoring is lower in TSTR industries, using text-based measures of regulatory monitoring for my international sample as well as a direct measure of one type of regulatory monitoring for U.S. firms: regulatory filing downloads from the EDGAR database by SEC and IRS employees. Firms in TSTR industries are more likely to engage in tax avoidance and are penalized by investors through lower liquidity; however, these effects are mitigated by the presence of analysts, institutional investors, the news media, and Big N auditors. Lastly, I provide evidence that the effects of being in a TSTR industry vary predictably with exogenous changes in regulatory monitoring (SOX 408), enforcement (insider trading laws), and resource constraints (recessions), and is amplified in industries where regulation plays a greater role.
36
how often firms are monitored by regulators. This finding is of interest to regulators to the extent that they wish to ensure that firms under their jurisdiction abide by existing laws and regulations. Additionally, to the extent that other firm stakeholders such as investors, consumers, and
creditors rely on regulatory monitoring to ensure compliance and a level playing field, it will be of interest to them as well. While the limited resources of regulators mean that they will
optimally fail to prevent non-compliance by some firms, especially small ones, my results
indicate that the Too Small to Regulate problem at the industry-level can be significant; although each individual firm may be small, in aggregate this problem can be non-trivial. Lastly, my paper is among the first to directly measure regulatory monitoring, in particular by the SEC, and
provides novel evidence on the determinants of this monitoring.
I see several avenues for future research. First, while this paper focuses mainly on the TSTR effect in financial regulation, further work can examine this phenomenon in the context of non-financial regulation, for example emissions standards or health and safety requirements, or for other types of financial regulation such as banking. More broadly, future research can continue to examine all determinants and outcomes of regulatory monitoring, especially for the SEC. While prior research on the SEC has been limited to examining ex post observed
37
Full Sample
N Mean Median Std P25 P75
TSTR 376,481 0.06 0.00 0.24 0.00 0.00
ETR 376,481 0.31 0.28 0.31 0.00 0.41
Zero_Ret 351,716 25.96 15.71 26.40 5.60 38.96
Amihud 97,425 0.79 0.01 2.78 0.00 0.25
BidAsk 210,236 0.04 0.02 0.07 0.01 0.04
RegWords 95,720 230.06 177.00 186.52 100.00 295.00
RegulatorNames 95,169 3.83 1.00 7.66 0.00 3.00
Analyst 375,141 2.87 1.00 5.02 0.00 3.00
Inst_Own 172,524 6.82 2.74 9.50 0.40 9.50
Media_Covg 129,828 69.10 27.00 105.74 9.00 88.00
BigN 376,481 0.43 0.00 0.50 0.00 1.00
Recession 345,994 0.17 0.00 0.38 0.00 0.00
Reg_Importance 376,481 0.49 0.33 0.37 0.00 0.67
Med_Age 376,481 10.60 9.69 5.02 6.95 13.43
lnSumMVE 376,481 16.54 16.77 2.22 15.05 18.18
HHI 376,481 2,337.42 1,686.27 1,963.90 899.74 3,145.22
CRatio 376,481 68.28 68.44 22.89 50.08 89.50
IFRS 376,481 0.14 0.00 0.35 0.00 0.00
US_GAAP 376,481 0.26 0.00 0.44 0.00 1.00
ADR 376,481 0.01 0.00 0.11 0.00 0.00
lnMVE 376,481 11.57 11.47 2.04 10.13 12.92
BM_Ratio 376,481 1.02 0.71 1.27 0.39 1.24
Leverage 376,481 0.23 0.19 0.22 0.04 0.35
ROA 376,481 -0.05 0.02 0.41 -0.01 0.06
Age 376,481 12.18 10.24 8.22 5.65 16.90
Loss 376,481 0.29 0.00 0.45 0.00 1.00
EarnSurprise 376,481 0.04 0.01 0.38 -0.03 0.05
U.S.-Only Measures
N Mean Median Std P25 P75
SEC_Total_Views 23348 22.11 9.00 41.56 2.00 22.00
SEC_Unique_Views 23348 12.30 6.00 19.69 2.00 14.00
IRS_Total_Views 23348 3.17 0.00 8.42 0.00 2.00
IRS_Unique_Views 23348 2.00 0.00 5.02 0.00 1.00
Restate 23348 0.09 0.00 0.29 0.00 0.00
Id_Vol 23348 2.57 1.88 2.20 1.00 3.73
IPO 23348 0.07 0.00 0.26 0.00 0.00
CF_Vol 23348 0.64 0.09 1.82 0.03 0.35
Table 1. Descriptive Statistics
Country N Proportion Country N Proportion Country N Proportion
Argentina 856 0.08 Hong Kong 10,931 0.02 Philippines 2,121 0.27
Australia 15,361 0.22 Hungary 267 0.07 Poland 1,763 0.08
Austria 1,233 0.04 India 12,824 0.19 Portugal 784 0.09
Belgium 1,772 0.02 Indonesia 3,456 0.23 Romania 557 0.33
Bermuda 318 0.00 Ireland 843 0.07 Russia 849 0.19
Brazil 3,111 0.12 Israel 3,405 0.09 Saudi Arabia 445 0.00
Bulgaria 545 0.78 Italy 3,325 0.00 Singapore 6,079 0.02
Canada 19,162 0.23 Japan 49,533 0.00 South Africa 3,978 0.10
Chile 2,233 0.03 Jordan 953 0.14 Spain 2,078 0.01
China 13,848 0.01 South Korea 13,259 0.01 Sri Lanka 886 0.60
Colombia 336 0.03 Kuwait 829 0.00 Sweden 3,803 0.05
Croatia 368 0.02 Luxembourg 354 0.02 Switzerland 3,133 0.01
Cyprus 384 0.53 Malaysia 10,439 0.10 Taiwan 12,601 0.00
Czech Republic 221 0.03 Mexico 1,700 0.03 Thailand 5,466 0.19
Denmark 2,315 0.08 Netherlands 3,004 0.02 Turkey 2,767 0.10
Egypt 588 0.01 New Zealand 1,028 0.07 United Arab Emirates 352 0.00
Finland 1,401 0.02 Norway 1,933 0.01 United Kingdom 25,424 0.08
France 11,124 0.02 Oman 451 0.26 United States 93,118 0.02
Germany 10,964 0.03 Pakistan 1,321 0.11 Venezuela 288 0.09
Greece 3,228 0.10 Peru 766 0.21 Overall 376,481 0.06
Panel B. The Proportion of TSTR Firms by Country
39
Industry N Proportion
Oil & Gas 13,499 0.031
Chemicals 13,518 0.052
Basic Resources (Forestry & Mining) 26,479 0.237 Construction & Materials 20,324 0.023 Industrial Goods & Services 67,397 0.038 Automobiles & Parts 7,792 0.041 Food & Beverage 18,741 0.053 Personal & Household Goods 27,082 0.108
Health Care 22,321 0.020
Retail 17,945 0.013
Media 10,284 0.036
Travel & Leisure 13,566 0.047 Telecommunications 4,225 0.021
Utilities 7,935 0.012
Banks 21,980 0.003
Insurance 5,310 0.039
Real Estate 18,688 0.040
Financial Services 22,503 0.196
Technology 36,892 0.041
Overall 376,481 0.062
40
(1) (2) (3) (4)
VARIABLES RegWords RegulatorNames RegWords RegulatorNames
TSTR -2.7800** -0.1490* -3.1720*** -0.5070***
(-2.496) (-1.849) (-3.207) (-6.734)
Num_Words 0.0083*** 0.0003*** 0.0082*** 0.0001**
(12.280) (6.124) (10.740) (1.967)
MedAge -0.0007 0.0526*** -0.156 0.0113
(-0.006) (7.533) (-0.912) (0.956)
lnSumMVE -0.598* -0.109*** -5.099*** -0.419***
(-1.790) (-4.814) (-8.695) (-9.660)
HHI 0.0002 -2.29e-05 8.91e-05 -5.14e-05*
(0.436) (-1.106) (0.223) (-1.898)
Cratio -0.0823** 0.0083*** 0.184*** 0.0196***
(-2.307) (3.601) (3.707) (5.350)
IFRS -10.84*** -2.578*** -12.41*** -2.616***
(-8.938) (-33.100) (-9.242) (-26.910)
US_GAAP 20.12*** 3.509*** -11.52** 0.925**
(4.231) (9.155) (-2.043) (2.060)
ADR 17.97** 2.034*** 12.59 1.549
(2.409) (4.828) (0.615) (1.573)
BigN -1.581* -0.182*** -1.204 -0.411***
(-1.749) (-2.959) (-1.164) (-5.188)
lnMVE -7.665*** -0.287*** -2.976*** -0.0729*
(-24.730) (-13.150) (-6.627) (-1.916)
BM_Ratio -1.887*** -0.0792*** -1.115*** -0.0105
(-5.644) (-3.517) (-3.242) (-0.410)
Leverage -17.91*** -0.807*** -1.240 0.362*
(-8.924) (-5.509) (-0.524) (1.835)
ROA 1.297* -0.143** -0.0797 -0.0691
(1.899) (-2.371) (-0.109) (-1.029)
Age -0.347*** -0.0141*** 3.242 1.087**
(-5.456) (-3.156) (0.500) (2.110)
Loss 1.958** 0.313*** 1.484** 0.0951
(2.526) (5.340) (2.081) (1.566)
Earn_Surprise -1.134** -0.0213 -0.763 -0.0188
(-1.993) (-0.499) (-1.577) (-0.457)
NumWords2 - NumWords5 Y Y Y Y
Country, Industry & Year FE Y Y
Firm & Year FE Y Y
Observations 94,722 94,184 94,738 94,200
Adjusted R-squared 0.856 0.551 0.934 0.763
Table 2. Effect of TSTR on Text-Based Regulatory Monitoring Measures
Robust t-statistics, clustered by firm, in parentheses
41
(1) (2) (3) (4)
VARIABLES SEC_TotalViews SEC_UniqueViews SEC_TotalViews SEC_UniqueViews
TSTR -12.290*** -7.432*** -6.414 -6.341**
(-2.774) (-3.500) (-1.333) (-2.234)
Restate 8.947*** 4.209*** 6.179*** 2.768***
(9.634) (11.020) (4.969) (5.239)
lag_Restate 5.231*** 2.177*** 3.149** 1.063**
(5.652) (6.964) (2.511) (2.289)
Id_Vol 0.469*** 0.0240 0.489** 0.190*
(2.593) (0.380) (2.242) (1.896)
IPO 1.672 0.409 3.454 2.310**
(1.572) (1.171) (1.314) (2.205)
CF_Vol 2.903*** 0.583*** 3.017*** -0.860*
(6.022) (4.271) (3.046) (-1.867)
Med_Age 7.671*** 5.252*** 3.640 1.240
(2.952) (3.937) (1.298) (0.864)
lnSumMVE -1.985* -0.708 -0.446 -0.212
(-1.780) (-1.379) (-0.624) (-0.578)
HHI 0.001 0.0007* 0.0005 0.0005
(1.478) (1.863) (0.729) (1.203)
Cratio -0.131* -0.100*** -0.0673 -0.0525
(-1.855) (-2.985) (-0.947) (-1.480)
BigN -3.996*** -2.019*** -7.630*** -6.300***
(-5.712) (-7.402) (-5.025) (-6.851)
lnMVE 4.861*** 2.434*** 3.224*** 1.619***
(13.590) (20.610) (4.101) (4.010)
BM_Ratio -2.683*** -1.287*** -1.520 -1.078
(-4.083) (-3.724) (-1.349) (-1.488)
Leverage 1.695 1.656*** 3.385 1.684**
(1.575) (4.250) (1.543) (2.309)
ROA -2.268*** -1.383*** 0.844 0.0512
(-2.974) (-4.139) (0.554) (0.107)
Age 3.608*** 1.795*** 35.44*** 35.72***
(5.985) (7.763) (6.001) (11.350)
Loss 3.430*** 2.048*** 1.925** 1.086**
(4.849) (7.721) (1.981) (2.543)
Earn_Surprise -1.469* -0.774** -1.988* -1.083**
(-1.700) (-2.059) (-1.888) (-2.312)
Industry & Year FE Y Y
Firm & Year FE Y Y
Observations 23,348 23,348 23,348 23,348
Adjusted R-squared 0.210 0.331 0.322 0.360
Panel A. Effect of TSTR on SEC Monitoring