* Corresponding author. E-mail: [email protected] Andrius BALTRUŠAITIS (ORCID ID 0000-0002-4144-8579)
Audrius VAITKUS (ORCID ID 0000-0001-5103-9747) Juris SMIRNOVS (ORCID ID 0000-0003-3709-7179)
Copyright © 2020 The Author(s). Published by RTU Press
This is an Open Access article distributed under the terms of the Creative Commons Attribution
ASPHALT LAYER DENSITY AND AIR VOIDS
CONTENT: GPR AND LABORATORY TESTING
DATA RELIANCE
ANDRIUS BALTRUŠAITIS1*, AUDRIUS VAITKUS2,
JURIS SMIRNOVS3
1Dept of Roads, Vilnius Gediminas Technical University, Vilnius, Lithuania
2Road Research Institute, Vilnius Gediminas Technical University, Vilnius, Lithuania
3Faculty of Civil Engineering, Riga Technical University, Riga, Latvia
Received 4 March 2020; accepted 3 June 2020
ENGINEERING 2020/1 5(3)
measurement results from asphalt base and binder layers of four test sections. GPR measurements were conducted immediately after the end of asphalt layer compaction process. Test points on each layer were selected and density, air void content were determined by drilling cores and testing them in the laboratory. To estimate asphalt layer density and air void content, GPR data were analysed using different existing mathematical models. To justify the reliability of the data measured by GPR, results were checked by comparing them with the results measured directly on cores taken from the asphalt pavement layers.
Keywords: air void content, asphalt pavement, bulk density, compaction, dielectric value, ground penetrating radar (GPR), non-destructive testing (NDT).
Introduction
The degree of compaction (may also refer to density ratio or the percent compaction) of asphalt pavement and air void content are currently two of the most important controlled quality parameters of paved and compacted asphalt pavement layers in Lithuania. These parameters define not only the quality of the asphalt mixture but also the quality of asphalt paving and compaction process and make up one of the main criteria of the durability of asphalt road pavement. The degree of compaction of the asphalt layer is calculated as the ratio from the field bulk density of the drilled core and the formed Marshall specimen bulk density (Vic Roads, 2010). The level of in-place density or air void content plays a major role in achieving satisfactory long-term performance of asphalt pavement. If the density is too high, it can make a pavement susceptible to rutting and shoving; too low density can be a reason of cracking, moisture damage, and raveling (Decker, 2017). The correct amount of air voids ensures the durability of the asphalt pavement and the accumulation of free bitumen in hot weather. According to the European standard, air void content is the volume of air voids in Marshall specimen or core, expressed as a percentage of the total volume of that specimen or core (CEN, 2018a). Core drilling is always required to determine these properties using standard methods. This method is expensive, time-consuming and destructive. Besides, compaction degree and air void content are determined over a small area, so the overall quality of asphalt layer compaction cannot be determined (Zhao & Al-Qadi, 2019). Although core drilling holes are usually filled with cold asphalt mix, here is still a big chance that potholes will eventually appear in the drilled areas. Besides, core drilling impairs the aesthetic appearance of the asphalt wearing layer. The driving comfort is also reduced.
Density and Air Voids Content: GPR and Laboratory Testing Data Reliance
These NDT methods measure the degree of compaction of the paved asphalt. Contractors use NDT devices such as nuclear gauge – Troxler or electromagnetic pavement quality indicator (PQI) – during and after the compaction process. The use of these technologies does not damage the asphalt pavement; tests are carried out fairly quickly and cheaply (Fauchard et al., 2013; Leng et al., 2018; Zhang, Z., Huang, & Zhang, K., 2017). However, quality is only determined at local points, and the degree of compaction of the entire section of the road is not specified. Ground-penetrating radar (GPR) technology can be advantageous in this case as it does not damage the asphalt pavement, measurements are done quickly, cheaply, and most importantly, the field bulk density and the air void content are determined across the entire length of the road (Kassem, Chowdhury, Scullion, & Masad, 2016). In order to apply this NDT method, studies have to be carried out, testing under current conditions and selecting the most appropriate mathematical model that would guarantee the accuracy and reliability of the measurements.
This study describes the field tests conducted in 2018 on four test sites in Lithuania. The experiments were performed on three different layers of asphalt mixtures. The bulk density of asphalt and the air void content were determined by standard methods and compared with the results determined with GPR.
1.
Determination of asphalt pavement layer density
and air void content using GPR
GPR is a geophysical technique that uses radio waves to probe the subsurface of lossy dielectric materials (Buynevich, Jol, & FitzGerald, 2009). This technology uses high and ultra-high frequency (10 MHz to 2.5 GHz) electromagnetic waves by transmitting and recording their reflection from different surfaces and deeper layers of the pavement. The propagation and reflection of the waves depend on the electrical properties of the materials, such as magnetic susceptibility, relative dielectric permittivity, and electrical conductivity (Saarenketo, 2006). Relative dielectric permittivity, usually called a dielectric value or constant, is the leading property used in GPR applications on road pavement surveys. The dielectric value is calculated according to Eq. (1) (Saarenketo & Scullion, 2000; Shangguan, Al-Qadi, Coenen, & Zhao, 2016).
AC m
m
A A
A A
1
1 2
ENGINEERING 2020/1 5(3)
where εAC – the dielectric value of the asphalt surface layer; A1 – the
amplitude of the reflection of GPR signal from the surface in volts; Am –
the amplitude of the reflection from a large metal plate in volts.
The dielectric value of the asphalt mixture depends on the volumetric and dielectric properties of its components (aggregates, bitumen, and air) and their proportions in the mix. During compaction, the change of the air volume will cause the change of dielectric value (Al-Qadi, Leng, Lahouar, & Baek, 2011). Air has a low dielectric value, so during the compaction process, the volumetric content of aggregates and bitumen, with higher dielectric value, increases proportionally in the mixture. Thus, the more the asphalt pavement is compacted, the higher its dielectric value (Saarenketo, 2013). For example, the dielectric value of air is equal to 1, water – 81, asphalt – from 2 to 5, bitumen – from 2 to 3, granite – from 5 to 6, sand – from 3 to 6, gravel – from 2 to 6 (Grégoire, Van der Wielen, Van Geem, & Drevet, 2016).
The GPR method for determining the air void content was proposed in Finland in 1998 by P. Roimela (1998). This method is described in the Finnish specification PANK-4122 (Scullion & Saarenketo, 2008). The air void content is calculated according to Eq. (2) (Saarenketo, 2012; Saarenketo & Scullion, 2000).
y272 93 1 3012k x
. e . , 1 < x < n, (2)
where y – air void content; k – a calibration coefficient; εx – a dielectric
value of the asphalt surface layer.
During studies, the relationship between dielectric value and air void content has shown excellent linear relationships (Saarenketo, 2006; Sebesta & Scullion, 2002). Based on the obtained results, GPR is now applied in Finland as a standard method for asphalt quality control (Maser & Carmichael, 2015). Still, the inappropriate choice of equipment can cause unreliable results (Lalagüe, 2014). Studies have shown that the best measurement results are obtained when the electromagnetic wavelength of a used frequency GPR antenna is ten times bigger than that of the largest particle of the mixture (Venkateswarlu & Tewari, 2014).
Density and Air Voids Content: GPR and Laboratory Testing Data Reliance G P G P G G mb AC b b b b
sb s mm
1
1 1 , (3)
G P G mb AC b AC b AC s b b AC b sb
3 1 1 2 2 1 1 1 2 1bAC Gmm
, (4)
where Gmb – bulk density of asphalt mixture, kg/m3; Gmm – maximum
density of asphalt mixture, kg/m3; P
b – binder content, %; Gb – density
of binder, kg/m3; G
sb – bulk density of aggregate, kg/m3; εAC – a dielectric
value of asphalt mixture; εb – a dielectric value of binder; εs – a dielectric
value of aggregate.
Aggregate density, maximum asphalt mixture density, and bitumen content are evaluated in the mix design. The dielectric value and density of bitumen are taken as constant. Bitumen density was determined to be 1.015 kg/m3 and bitumen dielectric value – 3 (Sebesta, Saarenketo,
& Scullion, 2012). The dielectric value of the aggregate needs to be back-calculated using information from field core data (Wang, Zhao, & Al-Qadi, 2018). Predetermined dielectric values of aggregates can be used to reduce or eliminate calibration cores, but studies have shown that improper selection of this value can strongly affect results. For example, the value of air voids, expressed from bulk density results, increases from 2.5% to 6.3% when a dielectric value of the aggregate changes from 6.5 to 7.0. The impact is so big because the aggregate represents approximately 80–85% of the asphalt mixture volume (Wang, Al-qadi, & Cao, 2020).
ENGINEERING 2020/1 5(3) Gmb AC b AC b b b AC s b s
3 2 3
1 1 2 3 2
2 3 . . . b AC b sb b
b AC mm
P G G
2 1 11 2 3 2
1
.
, (5)
where Gmb – bulk density of asphalt mixture, kg/m3; Gmm – maximum
density of asphalt mixture, kg/m3; P
b – binder content, %; Gb – density
of binder, kg/m3; G
sb – bulk density of aggregate, kg/m3; εAC – a dielectric
value of asphalt mixture; εb – a dielectric value of binder; εs – a dielectric
value of aggregate.
During the application of these methods, it has been revealed that not always the results obtained are reliable. The correlation of some GPR results with standard test methods was weak. Inaccurate results occurred mostly due to the inappropriate choice of equipment or an approach, a small number of calibration cores, external interference, or improper data processing (Lalagüe, 2014; Maser & Carmichael, 2015; Pellinen, Huuskonen-Snicker, Eskelinen, & Martinez, 2015; Sebesta et al., 2012; Sebesta, Wang, Scullion, & Liu, 2006).
2. Research data collection
In 2018, four test road sections were selected on two newly constructed or reconstructed roads. The 11.68 km long section of the
highway Kaunas-Marijampolė-Suvalkai (A5) from 45.15 km to 56.83 km
was reconstructed into the four-lane divided highway (Figure 1). The reconstructed section was redistributed by installing a second 7.5 m wide two-lane carriageway on the right. The newly constructed part of the road was paved with three layers of asphalt (base, intermediate and wearing). In this study, measurements were conducted on a 14 cm
Density and Air Voids Content: GPR and Laboratory Testing Data Reliance
thick base asphalt pavement layer of asphalt mixture AC 32 PS, asphalt concrete with maximum grain size of 32 mm and an intermediate 8 cm thick asphalt layer of AC 22 AS asphalt. Reconstructed road section
Šilalė–Žadeikiai (4105) from 6.14 km to 13.17 km (7.03 km in total)
included 6 cm single-layer asphalt base pavement from the mixture AC 16 PD on the former gravel road.
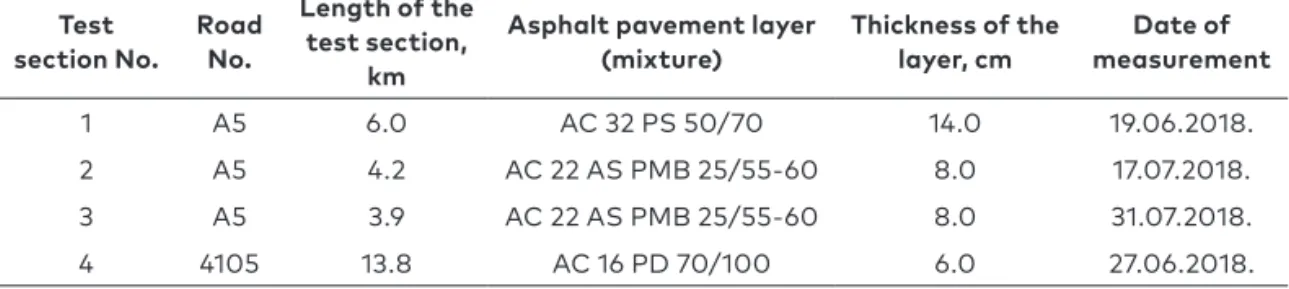
Detailed information for experimental sections is presented in Table 1.
Table 1. Test sites information
Test section No.
Road No.
Length of the test section,
km
Asphalt pavement layer (mixture)
Thickness of the layer, cm
Date of measurement
1 A5 6.0 AC 32 PS 50/70 14.0 19.06.2018. 2 A5 4.2 AC 22 AS PMB 25/55-60 8.0 17.07.2018. 3 A5 3.9 AC 22 AS PMB 25/55-60 8.0 31.07.2018. 4 4105 13.8 AC 16 PD 70/100 6.0 27.06.2018.
On test road sections No. 1, 2 and 3, the measurement locations were selected based on the number of measurement locations calculated
according to the ĮT ASFALTAS 08 norms, not less than 3 sites per
7000–9000 m2 (LRA, 2008). Three cores are usually drilled at one site.
The GPR test was carried out before the control core sampling from the installed asphalt pavement layer; therefore, the measurement locations, in the longitudinal direction, were selected based on the methodological guidelines for determining the thickness of road pavement construction layers MN SSN 15. Test site coordinates were determined using random number tables (LRA, 2015). The measurement points were marked with two parallel lines about 100 cm apart. Sampling points were measured using a 1 Hz GPR horn type antenna and following the guidelines (LRA, 2011) and the GPR equipment manufacturer’s manual. The GPR antenna was calibrated using a metal plate before and after the measurements.
ENGINEERING 2020/1 5(3)
2012). Each of the three test road sections consisted of three asphalt pavement lanes laid at different time so at least one calibration core was taken from each lane.
On test road section No. 4, the GPR test was performed before the determination of the asphalt pavement thicknesses by the GPR method; therefore, the measurement locations were selected according to the GPR method guidelines MN DP-GPR 11, when at least one drilled core was used for calibration purposes, for every kilometer of road (LRA, 2011).
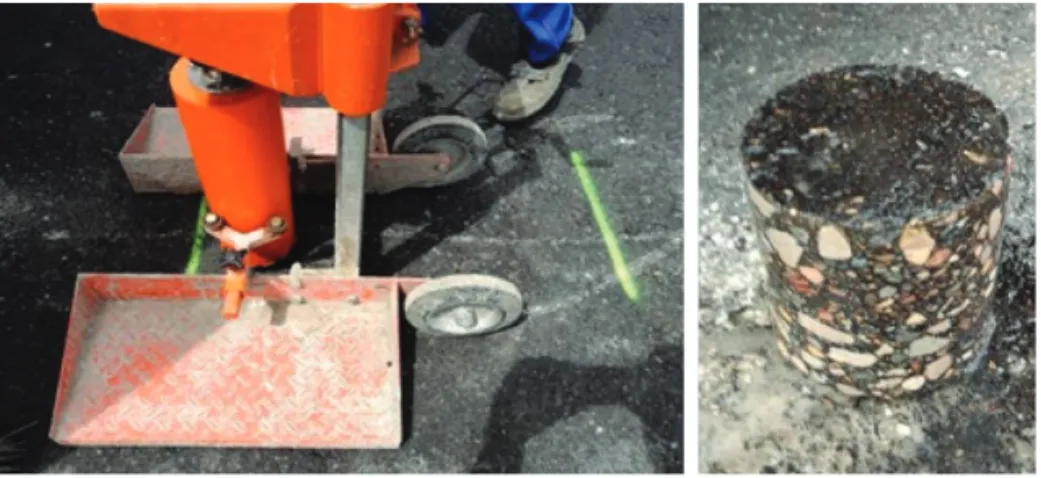
After GPR measurements, cores were taken at the specified measurement points according to the European standard of EN 12697-27 (CEN, 2017) (Figure 2). Core samples were tested for maximum density of asphalt mixture according to EN 12697-5 (CEN, 2018b). The asphalt mixture specimens were prepared with impact compactor, according to EN 12697-30 (CEN, 2018a). The bulk density of asphalt mixture specimens was determined according to EN 12697-6 using SSD method (CEN 2012b). The air void content of asphalt specimens was calculated according to EN 12697-8 (CEN, 2018c). The soluble binder content of the asphalt mixture was determined in accordance with EN 12697-1 (CEN, 2012a). Then the bulk density of cores was determined according to LST EN 12697-6 using SSD method (CEN, 2012b).
Using most common mathematical models of PANK-4122 (Saarenketo, 2012), CRIM (Leng et al., 2011) and ALL (Sebesta et al., 2012), the experimental air voids content and bulk density were calculated from the pavement dielectric value and other asphalt mixture and core data, applying Eqs. (3), (4) and (5). These results are compared with the standard core test results.
Density and Air Voids Content: GPR and Laboratory Testing Data Reliance
3. Research data analysis
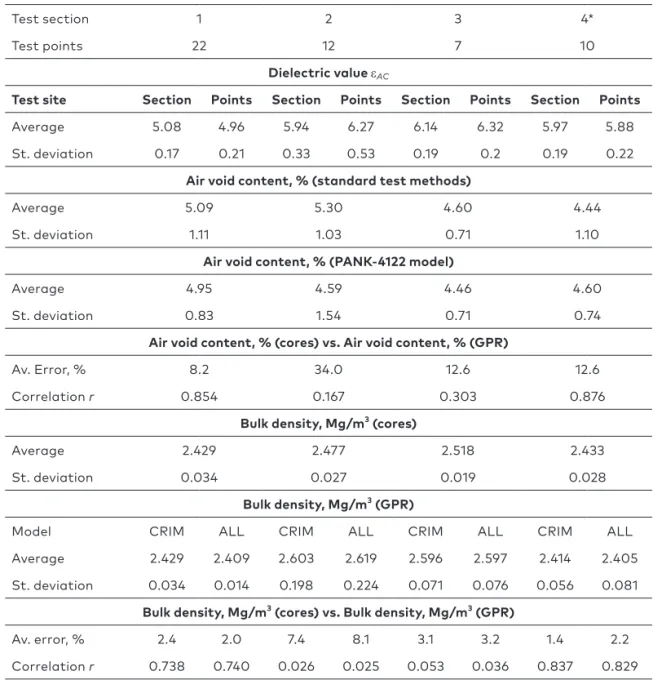
The results of air void content and bulk density, measured with the standard and GPR methods, and statistical analysis are presented in Table 2.
Table 2. Statistical analysis and test results
Test section 1 2 3 4*
Test points 22 12 7 10
Dielectric value εAC
Test site Section Points Section Points Section Points Section Points
Average 5.08 4.96 5.94 6.27 6.14 6.32 5.97 5.88
St. deviation 0.17 0.21 0.33 0.53 0.19 0.2 0.19 0.22
Air void content, % (standard test methods)
Average 5.09 5.30 4.60 4.44
St. deviation 1.11 1.03 0.71 1.10
Air void content, % (PANK-4122 model)
Average 4.95 4.59 4.46 4.60
St. deviation 0.83 1.54 0.71 0.74
Air void content, % (cores) vs. Air void content, % (GPR)
Av. Error, % 8.2 34.0 12.6 12.6
Correlation r 0.854 0.167 0.303 0.876
Bulk density, Mg/m3 (cores)
Average 2.429 2.477 2.518 2.433
St. deviation 0.034 0.027 0.019 0.028
Bulk density, Mg/m3 (GPR)
Model CRIM ALL CRIM ALL CRIM ALL CRIM ALL
Average 2.429 2.409 2.603 2.619 2.596 2.597 2.414 2.405
St. deviation 0.034 0.014 0.198 0.224 0.071 0.076 0.056 0.081
Bulk density, Mg/m3 (cores) vs. Bulk density, Mg/m3 (GPR)
Av. error, % 2.4 2.0 7.4 8.1 3.1 3.2 1.4 2.2
Correlation r 0.738 0.740 0.026 0.025 0.053 0.036 0.837 0.829
ENGINEERING 2020/1 5(3)
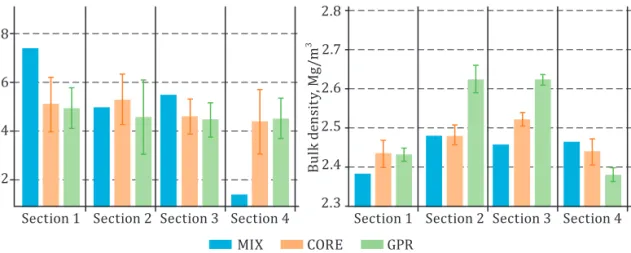
Figure 3. Comparison of the results and deviation
The dielectric value was measured along the entire length of each test road section, and it was recorded as an average value measured every half meter. The smallest standard deviation of the dielectric value was determined on road section No. 1 (0.17); on road section No. 2 it was almost twice as large (0.33). Larger deviation of the dielectric value may be due to the uneven asphalt paving and compaction or the uneven distribution of the properties of the mixture on the test road section. After having compared the results of the dielectric values at specific measuring points, the same tendency was observed on the whole test road section. The reason for this dispersion of the results from the average could be determined by evaluating the results of measurements of cores using standard methods. Judging by the standard deviation of air void content, determined from the core results, it was sufficiently alike on road sections No. 1 and 4 (1.1) and on road sections No. 2 and 3 it was even smaller (1.03 and 0.71, respectively). The situation was similar when measuring the bulk density, with the maximum standard deviation fixed on road section No.1 (0.034) and the minimum standard deviation fixed on road section No. 3 (0.019). These results can lead to the conclusion that higher dispersion of the dielectric value results from the average on road section No. 2 was mainly due to the uneven GPR measurements, since the standard deviation of the cores measured by standard methods did not show any unevenness in the asphalt paving, compaction or mix properties on different road sections.
In order to use PANK-4122, CRIM and ALL models for the determination of air void content and bulk density by the GPR method, information on some parameters of the asphalt mixture (bitumen content, maximum density) is required, and in order to reduce the number of calibration cores, the possibility of using asphalt mixture
Section 1 Section 2 Section 3 Section 4 Section 1 Section 2 Section 3 Section 4
Ai
r v
oi
ds c
on
te
nt
, %
Bu
lk d
en
si
ty
, M
g/
m
3
8
6
4
2
2.8
2.7
2.6
2.5
2.4
2.3
Density and Air Voids Content: GPR and Laboratory Testing Data Reliance
design data (air void content and bulk density) can be checked. For this purpose, the air void content and bulk density specified in the asphalt mixture design were compared with the core parameters determined by standard methods (Figure 3). After having compared the content of air voids as indicated in the asphalt mixture design, only on test road section No. 2 it was similar to the air void content of the cores, which was determined using standard test methods. On other road sections, the difference was even greater, especially on road section No. 4, where the content of air voids in the mixture was 3 times less than the average air void content determined from the cores. Comparing the difference in the bulk density between the mixture design and the cores, the difference was not as large as in the case of air voids, for example, on road section No. 2 it was even equal and on other road sections it did not exceed 3%. Similar or even greater differences were obtained by comparing the values of the mixture design and the values determined by the GPR method. Therefore, it can be concluded that, as an alternative, the parameters of asphalt mixture, sampled during asphalt paving process, could be used to reduce the number of calibration cores. However, this option was not applied and explored in this study. In order to evaluate the applicability of the results of asphalt mixtures, it is necessary to perform the research on GPR measurements and core drilling sites for the selected asphalt mixtures.
ENGINEERING 2020/1 5(3)
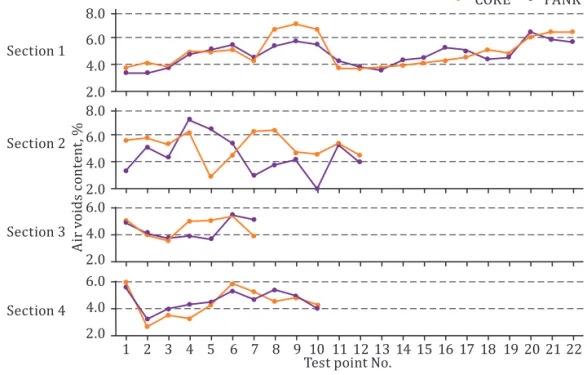
Figure 4. Graph of air void content achieved by coring and GPR
Figure 5. Graph of bulk densities achieved by coring and GPR
Section 3
Section 4
Section 4 Section 3
Test point No.
Test point No. Section 2
Section 1
Ai
r v
oi
ds c
on
te
nt
, %
Bu
lk d
en
si
ty
, M
g/
m
3
6.0 4.0 2.0 6.0 4.0 2.0 8.0 6.0 4.0 2.0 8.0 6.0 4.0 2.0
1 2 3 4 5 6 7 8 9 10 11 12 13 14 15 16 17 18 19 20 21 22
CORE PANK
CORE CRIM ALL
Section 1
2.65 2.55 2.45 2.35 2.22
Section 2
3.05
2.85
2.65
2.45
2.65 2.55 2.45 2.35 2.22
1 2 3 4 5 6 7 8 9 10 11 12 13 14 15 16 17 18 19 20 21 22 2.85
2.65
Density and Air Voids Content: GPR and Laboratory Testing Data Reliance
application of the ALL model. This may have been influenced by different values of bitumen content (road section No. 1 – 3.7%, road section No. 4 – 5.2%) and maximum density (road section No. 1 – 2.547 Mg/m3,
road section No. 4 – 2.495 Mg/m3) of these road sections. It can be
concluded that the result is more influenced by bitumen content with the application of the ALL model, and by maximum density with the application of the CRIM model. In order to find out which method is best suited for a particular asphalt layer; it is necessary to assess the degree of influence of these asphalt parameters on the final result.
After having evaluated the correlation between the core results and the GPR results, the situation was similar to the one with the average error. The results of road sections No. 1 and 4 correlated very well (the air void content r ≥ 0.85 (Figure 6), and the bulk density r ≥ 0.7 and 0.8,
respectively).
Having compared the results of road sections No. 2 and 3, the correlation between the cores measured by standard methods and the GPR results was weak or non-existent. The crucial thing that could have led to different results on these road sections was that on road sections No. 1 and 4 there was a base course of crushed dolomite or crushed gravel underneath the asphalt pavement, while on road sections No. 2 and 3 there was another type of asphalt pavement. Therefore, it can be stated that this may have affected the accuracy of measurements of dielectric value. Although the thickness of layer is considerable (8 cm) on road sections No. 2 and 3, it is still assumed that the dielectric
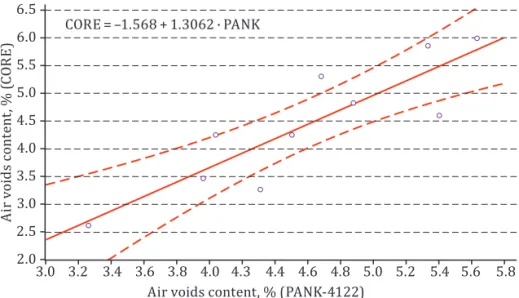
Figure 6. Correlation between the core results and the GPR air void content of road section No. 4
Ai
r v
oi
ds c
on
te
nt
, % (
CO
RE
)
Air voids content, % (PANK-4122) 6.5
6.0 5.5 5.0 4.5 4.0 3.5 3.0 2.5 2.0
ENGINEERING 2020/1 5(3)
value of the asphalt pavement (measured with a 1 GHz antenna) was incorrectly determined due to the influence of the asphalt course lying beneath the pavement. Inaccuracies in the results may have been caused by incorrect equipment selection or by too few calibration cores. In order to verify that GPR equipment was properly selected, it would be necessary to perform measurements of multi-layer pavements with a higher frequency (2 GHz) antenna and then compare the obtained measurement results with those of a 1 GHz antenna. Scientists state that namely the choice of the wrong frequency antenna can be the main cause of inaccurate measurements (Lalagüe, 2014; Maser & Carmichael, 2015; Sebesta et al., 2012; Sebesta et al., 2006).
Conclusions
The results of the dielectric value were uniform (standard deviation varied from 0.17 to 0.22) on all test sections except for test section No. 2 (standard deviation – 0.53). Higher dispersion of the dielectric value results from the average on test section No. 2 was mainly due to the uneven GPR measurements, since the standard deviation of the cores measured by standard methods did not show any unevenness in the asphalt paving, compaction or mix properties on different road sections. Inaccuracies in the results may have been caused by incorrect equipment selection or by too rear calibration cores.
The use of mix design data with the application of the GPR models could not be used to reduce the number of calibration cores because the differences of air void content and bulk density comparing with the core results were too great. Therefore, it is necessary to determine the accuracy of models when using parameters obtained from asphalt mixture taken during the asphalt paving process.
GPR method showed better correlation and fewer errors in the results when measurements were performed on single-layer asphalt pavements (test sections No. 1 and No. 4). Asphalt bulk density results were as follows: average error <3%, correlation r > 0.7. The results of air void content were less reliable (test section No 1: average error – 8.2%, correlation r – 0.85; No 4: average error – 12.6%, correlation r – 0.87).
Density and Air Voids Content: GPR and Laboratory Testing Data Reliance
could be achieved with higher frequency, for example, a 2 GHz GPR antenna.
No significant differences were observed with the application of the CRIM and ALL models except the fact that the results with the application of the ALL model were more affected by the bitumen content and the results with the application of the CRIM model were more affected by maximum density specified in the mix design. In order to define which method is most accurate, it is necessary to assess the degree of influence of these asphalt parameters for a particular asphalt type and layer.
REFERENCES
Al-Qadi, I. L., Leng, Z., Lahouar, S., & Baek, J. (2011). In-Place Hot-Mix Asphalt Density Estimation Using Ground-Penetrating Radar. Transportation Research Record: Journal of the Transportation Research Board, 2152(1), 19–27. https://doi.org/10.3141/2152-03
Ameri, M., Novin, M. K., & Yousefi, B. (2014). Comparison of the Field Measurements of Asphalt Concrete Densities Obtained by Ground-Penetrating Radar, Pavement Quality Indicator and the Borehole Coring Methods. Road Materials and Pavement Design, 15(4), 759–773. https://doi.org/10.1080/14680629.2014.909874
Buynevich, I. V., Jol, M. H., & FitzGerald, M. D. (2009). Coastal Environments. In H. M. Jol (Ed.), Ground Penetrating Radar Theory and Applications (pp. 299–322). https://doi.org/10.1016/B978-0-444-53348-7.00010-7
CEN. European Committee for Standardization. (2012a). EN 12697-1:2012: Bituminous Mixtures – Test Methods for Hot Mix Asphalt – Part 1: Soluble Binder Content.
CEN. European Committee for Standardization. (2012b). EN 12697-6:2012: Bituminous Mixtures – Test Methods for Hot Mix Asphalt – Part 6: Determination of Bulk Density of Bituminous Specimens.
CEN. European Committee for Standardization. (2017). EN 12697-27:2017: Bituminous Mixtures – Test Methods – Part 27: Sampling.
CEN. European Committee for Standardization. (2018a). EN 12697-30:2018: Bituminous Mixtures – Test Methods – Part 30: Specimen Preparation by Impact Compactor.
CEN. European Committee for Standardization. (2018b). EN 12697-5:2018: Bituminous Mixtures – Test Methods – Part 5: Determination of the Maximum Density.
CEN. European Committee for Standardization. (2018c). EN 12697-8:2018: Bituminous Mixtures – Test Methods – Part 8: Determination of Void Characteristics of Bituminous Specimens.
ENGINEERING 2020/1 5(3)
and Medicine, The National Academies Press. 57 p. https://doi.org/10.17226/24870
Fauchard, C., Li, B., Laguerre, L., Héritier, B., Benjelloun, N., & Kadi, M. (2013). Determination of the Compaction of Hot Mix Asphalt Using High-Frequency Electromagnetic Methods. NDT & E International, 60, 40–51.
https://doi.org/10.1016/j.ndteint.2013.07.004
Grégoire, C., Van der Wielen, A., Van Geem, C., & Drevet, J. P. (2016). Methodologies for the Use of Ground-Penetrating Radar in Pavement Condition Surveys. Belgian Road Research Centre. BRRC Method of Measurement – ME 91/16.
Kassem, E., Chowdhury, A., Scullion, T., & Masad, E. (2016). Application of Ground-Penetrating Radar in Measuring the Density of Asphalt Pavements and Its Relationship to Mechanical Properties. International Journal of Pavement Engineering, 17(6), 503–516.
https://doi.org/10.1080/10298436.2015.1007225
Lalagüe, A. (2014). Use of Ground Penetrating Radar in Quality Assurance of New Asphalt Pavements. Norwegian University of Science and Technology. Retrieved from https://pdfs.semanticscholar.org/fba8/31e85555de26c311b 3ce47c86e1f9d22ca43.pdf
Leng, Z., Al-Qadi, L. I. & Lahouar, S. (2011). Development and Validation for in Situ Asphalt Mixture Density Prediction Models. NDT & E International, 44(4), 369–375. https://doi.org/10.1016/j.ndteint.2011.03.002
Leng, Z., Zhang, Z., Zhang, Y., Wang, Y., Yu, H., & Ling, T. (2018). Laboratory Evaluation of Electromagnetic Density Gauges for Hot-Mix Asphalt Mixture Density Measurement. Construction and Building Materials, 158, 1055–1064. https://doi.org/10.1016/j.conbuildmat.2017.09.186
LRA. Lithuanian Road Administration under the Ministry of Transport and Communications. (2008). ĮT ASFALTAS 08 Automobilių kelių dangos konstrukcijos asfalto sluoksnių įrengimo taisyklės [Rules for Installation of Asphalt Layers of Road Pavement Structures].
LRA. Lithuanian Road Administration under the Ministry of Transport and Communications. (2011). MN DP-GPR 11Darbų priėmimo panaudojant GPR metodą metodiniai nurodymai [Guidance on Acceptance of Works Using the GPR
Method].
LRA. Lithuanian Road Administration under the Ministry of Transport and Communications. (2015). MN SSN 15 Automobilių kelių dangos konstrukcijos sluoksnių storio nustatymo metodiniai nurodymai [Methodological Guidelines
for Determining the Thickness of Road Pavement Construction Layers].
Maser, K., & Carmichael, A. (2015). Ground Penetrating Radar Evaluation of New Pavement Density. Paving Project – SR 539 in Lynden, WA. Washington State Department of Transportation Research Report. Retrieved from
https://www.wsdot.wa.gov/research/reports/fullreports/839.1.pdf
Density and Air Voids Content: GPR and Laboratory Testing Data Reliance
Roimela, P. (1998). Ground Penetrating Radar Surveys in Pavement Quality Control 1996-1997. Tielaitoksen selvityksia 4, 55 p. Rovaniemi, Finland.
Saarenketo, T. (2006). Electrical Properties of Road Materials and Subgrade Soils and the Use of Ground Penetrating Radar in Traffic Infrastructure Surveys (Academic dissertation. University of Oulu). Retrieved from
http://herkules.oulu.fi/isbn9514282221
Saarenketo, T. (2012). Recommendations for Guidelines for the Use of GPR in Asphalt Air Voids Content Measurement. Mara Nord Project. Retrieved from https://www.vegvesen.no
Saarenketo, T. (2013). Measuring Electromagnetic Properties of Asphalt for Pavement Quality Control and Defect Mapping. Roadscanners. Retrieved from https://pdfs.semanticscholar.org/2363/c3cea7a5deee6ebf8af305e-6a056c59d6861.pdf
Saarenketo, T., & Scullion, T. (2000). Road Evaluation With Ground Penetrating Radar. Journal of Applied Geophysics, 43(2–4), 119–138.
https://doi.org/10.1016/S0926-9851(99)00052-X
Scullion, T, & Saarenketo, T. (2008). Asfalttipäällysteen Tyhjätila, Päällystetutkamenetelmä. PANK RY association. Retrieved from
http://pank.fi/file/416/348_pank4122.pdf
Sebesta, S., & Scullion, T. (2002). Using Infrared Imaging and Ground-Penetrating Radar to Detect Segregation in Hot-Mix Overlays. Texas Transportation Institute. Report 4126-1. Research Project Title: Development of Infrared Photography and GPR Procedures for Identifying Mixture Segregation. Sebesta, S., Saarenketo, T. & Scullion, T. (2012). Using Infrared and High-Speed
Ground-Penetrating Radar for Uniformity Measurements on New HMA Layers. Washington, DC: National Academies of Sciences, Engineering, and Medicine. 80 p. https://doi.org/10.17226/22769
Sebesta, S., Wang, F., Scullion, T., & Liu, W. (2006). New Infrared and Radar Systems for Detecting Segregation in Hot-Mix Asphalt Construction. Texas Department of Transportation, research project 0-4577, Further Development of NDT Devices to Identify Segregation in HMAC. Technical Report. Retrieved from http://tti.tamu.edu/documents/0-4577-2.pdf
Shangguan, P., Al-Qadi, I., Coenen, A., & Zhao, S. (2016). Algorithm Development for the Application of Ground-Penetrating Radar on Asphalt Pavement Compaction Monitoring. International Journal of Pavement Engineering, 17(3), 189–200. https://doi.org/10.1080/10298436.2014.973027
Sihvola, A. H. (1989). Self-Consistency Aspects of Dielectric Mixing Theories. IEEE Transactions on Geoscience and Remote Sensing, 27(4), 403–415.
https://doi.org/10.1109/36.29560
Venkateswarlu, B., & Tewari, V., C. (2014). Geotechnical Applications of Ground Penetrating Radar (GPR).Journal Indian Geological Congress, Roorkee, India, 6(1), 35–46.
ENGINEERING 2020/1 5(3)
Wang, S., Al-qadi, I. L., & Cao, Q. (2020). Factors Impacting Monitoring Asphalt Pavement Density by Ground Penetrating Radar. NDT and E International, 102296. https://doi.org/10.1016/j.ndteint.2020.102296
Wang, S., Zhao, S., & Al-Qadi, I. L. (2018). Continuous Real-Time Monitoring of Flexible Pavement Layer Density and Thickness Using Ground Penetrating Radar. NDT & E International, 100, 48–54.
https://doi.org/10.1016/j.ndteint.2018.08.005
Zhang, Z., Huang, S., & Zhang, K. (2017). Accurate Detection Method for Compaction Uniformity of Asphalt Pavement. Construction and Building Materials, 145, 88–97. https://doi.org/10.1016/j.conbuildmat.2017.03.227 Zhao, S., & Al-Qadi, I. L. (2019). Algorithm Development for Real-Time Thin
Asphalt Concrete Overlay Compaction Monitoring Using Ground-Penetrating Radar. NDT and E International, 104, 114–123.