Safety of Dynamic Intravenous Iron Administration
Strategies in Hemodialysis Patients
Xiaojuan Li ,1,2,3Stephen R. Cole,1Abhijit V. Kshirsagar,2Jason P. Fine,4Til Stu¨rmer,1and M. Alan Brookhart1
Abstract
Background and objectivesIntravenous iron therapy for chronic anemia management is largely driven by dosing protocols that differ in intensity with respect to dosing approach (i.e., dose, frequency, and duration). Little is known about the safety of these protocols.
Design, setting, participants, & measurementsUsing clinical data from a large United States dialysis provider linked to health care utilization data from Medicare, we constructed a cohort of patients with ESKD aged$65 years who initiated and continued center-based hemodialysis for$90 days between 2009 and 2012, and initiated at least one of thefive common intravenous iron administration strategies; ranked by intensity (the amount of iron given at moderate-to-high iron indices), the order of strategies was 3 (least intensive), 2 (less intensive), 1 (reference), 4 (more intensive), and 5 (most intensive). We estimated the effect of continuous exposure to these strategies on cumulative risks of mortality and infection-related events with dynamic Cox marginal structural models.
ResultsOf 13,249 eligible patients, 1320 (10%) died and 1627 (12%) had one or more infection-related events during the 4-month follow-up. The most and least commonly initiated strategy was strategy 2 and 5, respectively. Compared with the reference strategy 1, more intensive strategies (4 and 5) demonstrated a higher risk of all-cause mortality (e.g., most intensive strategy 5: 60-day risk difference: 1.3%; 95% confidence interval [95% CI], 0.8% to 2.1%; 120-day risk difference: 3.1%; 95% CI, 1.0% to 5.6%). Similarly, higher risks were observed for infection-related morbidity and mortality among more intensive strategies (e.g., strategy 5: 60-day risk difference: 1.8%; 95% CI, 1.2% to 2.6%; 120-day risk difference: 4.3%; 95% CI, 2.2% to 6.8%). Less intensive strategies (2 and 3) demonstrated lower risks of all-cause mortality and infection-related events.
ConclusionsAmong dialysis patients surviving 90 days, subsequent intravenous iron administration strategies promoting more intensive iron treatment at moderate-to-high iron indices levels are associated with higher risks of mortality and infection-related events.
Clin J Am Soc Nephrol14: 728–737, 2019. doi: https://doi.org/10.2215/CJN.03970318
Introduction
Intravenous (IV) iron is either providedvialarge doses over consecutive hemodialysis sessions (often termed“bolus dosing”) orviasmall doses provided every 1–2 weeks (often termed “maintenance dos-ing”) for anemia management in contemporary clin-ical practice. Decisions about the exact sequence of iron administration are typically guided by iron indices levels—serum ferritin and transferrin satura-tion (TSAT)—and hemoglobin (1,2). On the basis of these tests, providers make recommendations about the dosing approach (i.e., bolus dosing, maintenance dosing, or another variation) for the next treatment course.
Currently, dialysis clinics rely on dosing protocols that prescribe dosing approaches for IV iron admin-istration. These protocols factor in a patient’s iron indices levels and evolving clinical characteristics to provide treatment recommendations with the primary goal of achieving a target hemoglobin level while not exceeding the upper limits of ferritin and TSAT.
Consequently, the treatment dose, frequency, and duration (dosing approach) are repeatedly adjusted when updated iron indices and clinical characteristics become available. These dosing protocols are known as dynamic administration strategies (3–5).
Surprising variation exists in protocols used in clinical practice, perhaps reflective of the lack of consensus among expert guidelines (1,2,6–9). These protocols differ in intensity with respect to target levels of iron indices and dosing approach recommendations (10–12). For example, one protocol may specify 100 mg of iron administered over ten consecutive dialysis sessions for TSAT,30% and ferritin,1200 ng/ml, whereas another protocol would hold iron for any ferritin.500 ng/ml regardless of TSAT level.
Although previous studies have examined the safety of IV iron, none have formally assessed dosing protocols (13,14). Existing observational studies (15–17) have largely focused on the effect of cumula-tive iron exposure over a long period that may over-simplify patients’ heterogenous IV iron treatment
1Department of
Epidemiology,
2University of North
Carolina Kidney Center, Division of Nephrology and Hypertension, and
4Department of
Biostatistics, University of North Carolina at Chapel Hill, Chapel Hill, North Carolina;
3Department of
Population Medicine, Harvard Medical School and Harvard Pilgrim Health Care Institute, Boston, Massachusetts
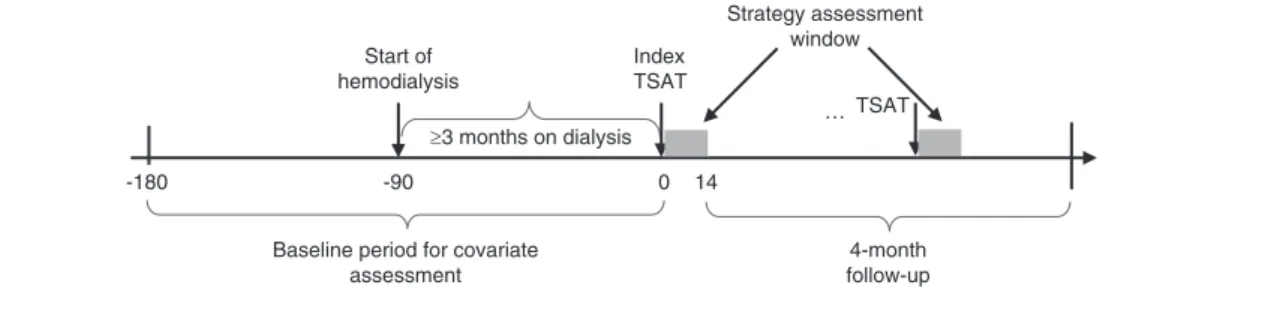
IV iron administration strategy in the index treatment interval anchored by the index TSAT and its subsequent TSAT. We defined the baseline period as the period starting 90 days before dialysis initiation and ending on the day before the index date. Eligible patients were followed for outcomes of interest in a 4-month follow-up period, starting on day 15 (the day after the index strategy assessment window) (Figure 1).
Our study population comprised outpatients who initi-ated in-center hemodialysis between January 1, 2009 and September 16, 2012 and survived 90 days after initiation (Supplemental Figure 1). We excluded patients who (1) were aged,65 years at initiation (to ensure the collection of their comprehensive clinical history for confounding control), (2) did not have Medicare as primary insurer, (3) did not continue hemodialysis for $90 days, (4) had incomplete baseline covariates information (24), or (5) had fewer than nine dialysis sessions in the month pre-ceding the index date to ensure they were receiving regular hemodialysis and anemia management. We also excluded patients with polycystic kidney disease because their iron administration strategies could differ because of their heterogeneous need for erythropoiesis stimulating agents.
IV Iron Administration Strategies
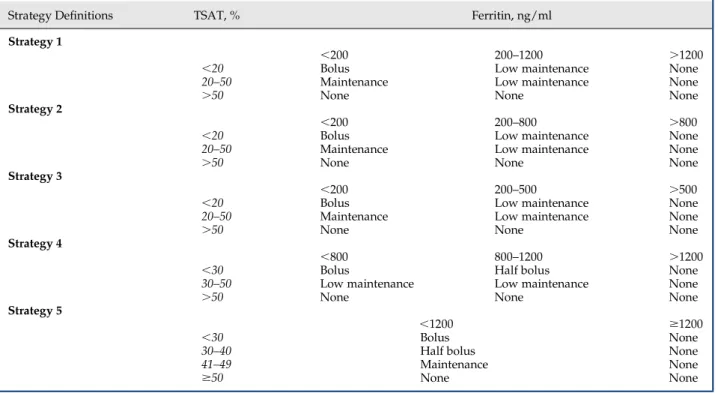
We considered five dynamic IV iron administration strategies that were adapted from existing protocols used by several dialysis organizations in contemporary routine practice. Each strategy consisted of a set of decision rules that specified a range of acceptable iron therapy values during a treatment course given a patient’s current iron indices (Tables 1 and 2). Ranked by intensity of iron treatment, the amount of iron given at moderate-to-high iron indices, the order of strategies was 3 (least intensive), 2 (less intensive), 1 (reference), 4 (more intensive), and 5 (most intensive).
We identified the IV iron administration strategies initiated by eligible patients in the index treatment interval by matching a patient’s treatment pattern in the 14-day assessment window and current iron indices values with candidate strategies by concordance (23). The length of assessment window was chosen to maximize the representativeness of treatment experience in the assessment window for the treatment experience during the entire treatment course as well as minimizing the days required for assessment to maximize follow-up time for outcomes (Supplemental Figure 2). Patients were
≥3 months on dialysis Start of
hemodialysis
Index TSAT
-180 -90 0 14
Baseline period for covariate assessment
4-month follow-up … TSAT Strategy assessment
window
Figure 1.|Study design for assessing the effect of initiating and staying on a particular dynamic IV iron administration strategy.Patients are followed starting on the end of the first 14-day iron strategy assessment window (the gray block) for all-cause mortality or infection-related events. Those deviated from their index strategy are censored at the end of current assessment window.
trajectories (18). Cumulative iron exposures may also not alignwellwiththetreatmentdecisionsthatprovidersmake regardingironadministrationin clinicalpractice(19). Ran-domized,clinicaltrialsassessing multipledosingprotocols arelacking.Assuch,therisksofinfectiouscomplicationsand mortalityareuncleargivenconflictingconclusionsofexisting studies (12–17,20,21) and the insufficiency of the current literatureonsafetyofdosingprotocols.
GiventhehighprevalenceofIViron(22),weconducteda studytoexaminetheeffectofcontinuestreatmentwithfive commonlyuseddynamicIVironadministrationstrategieson risksofall-causemortalityandinfection-relatedeventsina contemporarycohortofpatientsonhemodialysis.
MaterialsandMethods DataSources
Weconstructedalargehemodialysispatientcohortusing deidentified datasets derived from the electronic health recordsofalargedialysisorganizationintheUnitedStates, linkedwiththeUSRenalDataSystem(USRDS).Weobtained detailedclinicalinformationregardingpatients’dialysis treat-ments,vascularaccess,laboratorytestdata,IVmedications, andanemiamanagementusingtheclinicaldatabasefromthe dialysis organization. We obtained information regarding their demographics, comorbidities, health care system en-counters, and outcomes from the USRDS. The study was approvedbytheInstitutionalReviewBoardatUniversityof North Carolina at Chapel Hill (approval no. 15–1991).
StudyDesignandStudyPopulation
excluded from the main analyses if their treatment patterns in the assessment window were incompatible with all candidate strategies.
Effect Measure of Interest
We estimated the 120-day cumulative risks of all-cause mortality and infection-related events under continuous treatment with each IV iron administration strategy. We focused on this per-protocol effect of these administration strategies—the effect that would have been observed if patients had adhered to their assigned strategy throughout the 120-day follow-up—because the typical intention-to-treat effect may be suboptimal for assessment of
comparative safety, particularly in the presence of non-adherence to the strategy (25,26).
Outcomes
Two safety outcomes examined were all-cause mortality and a composite outcome of infection-related hospitaliza-tion (sepsis, vascular access infechospitaliza-tion, or pneumonia) or death in the 4 months after initiation of IV iron adminis-tration strategy. These events were identified using claims-based definitions (Supplemental Table 1).
Patients were censored by death attributed to reasons other than infection (for the infection-related events outcome), receipt of kidney transplantation, time of switching modality, loss to follow-up, disenrollment from the dialysis provider, loss of Medicare coverage, or the administrative end of follow-up (December 31, 2012). For both analyses, patients were also censored by deviation from index strategy when they received treatment in a way inconsistent with their index strategy (Supplemental Material, Supplemental Figure 3).
Covariates
Covariates (defined in Supplemental Table 2) in the analyses included demographic characteristics (e.g., age, sex, race, year of strategy initiation), clinical characteristics (e.g., cause of ESKD, body mass index), baseline anemia treatment history (IV iron and epoetin dose), facility-related factors (geographical region of dialysis clinic, vascular access type), parameters reflective of anemia management (e.g., TSAT, ferritin, epoetin dose, hemoglobin, receipt of blood transfusion), parameters reflective of inflammation (albumin, creatinine, systolic BP, postdialysis body weight), health care system encounters (e.g., number of dialysis sessions, days of hospitalization), and a list of comorbidities. Table 1. Definitions of dynamic intravenous iron administration strategies
Strategy Definitions TSAT, % Ferritin, ng/ml
Strategy 1
,200 200–1200 .1200
,20 Bolus Low maintenance None
20–50 Maintenance Low maintenance None
.50 None None None
Strategy 2
,200 200–800 .800
,20 Bolus Low maintenance None
20–50 Maintenance Low maintenance None
.50 None None None
Strategy 3
,200 200–500 .500
,20 Bolus Low maintenance None
20–50 Maintenance Low maintenance None
.50 None None None
Strategy 4
,800 800–1200 .1200
,30 Bolus Half bolus None
30–50 Low maintenance Low maintenance None
.50 None None None
Strategy 5
,1200 $1200
,30 Bolus None
30–40 Half bolus None
41–49 Maintenance None
$50 None None
Table 2. Dosing approach definition
Dosing Approach
Iron Dosage Level
2-wk Monthly Equivalencea
Bolus .500 100 mg3ten consecutive
sessions
Half bolus 201–500 100 mg3five consecutive
sessions
Maintenance 101–200 100 mg weekly
Low maintenance 1–100 25 or 50 mg weekly
None 0 0 mg
a
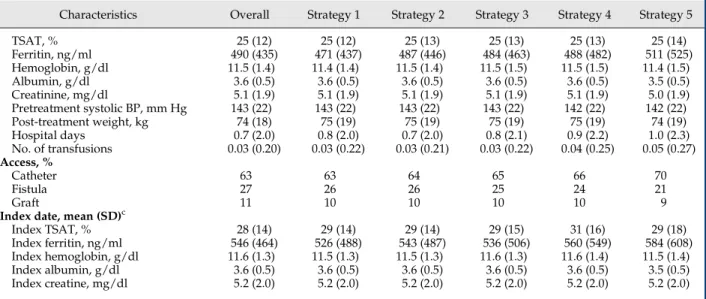
catheter. Recent history of infections and comorbidities were more common among the most intensive strategy 5 initiators, who were also more likely to have had a gastrointestinal bleed or received blood transfusion. Dur-ing the last baseline month, they received higher doses of epoetin and IV iron and spent more days in the hospital. Their index TSAT and ferritin levels were also higher.
During follow-up, patients deviated from their index strategy quickly, especially among initiators of more in-tensive strategies 4 and 5 (Supplemental Figure 4). The median time to deviation was shortest among strategy 5 and longest in strategy 2 (49 versus 131 days). By the end of 4 months, 40%–80% of patients had deviated from their index strategies. Factors that increased the probability of deviation included vascular access-related infection in the last baseline month, use of a catheter, higher albumin level, fewer dialysis sessions, and higher epoetin doses in the previous treatment interval. In contrast, having blood trans-fusions and longer hospital stays in the previous treatment interval reduced the probability of deviation.
During the first 4 months of follow-up, 1320 (10%) patients died and 1627 (12%) patients had at least one infection-related events. The unadjusted RDs of all-cause mortality and infection-related risks comparing each strat-egy with referent stratstrat-egy 1 during the 4-month follow-up are shown in Supplemental Figures 5 and 6.
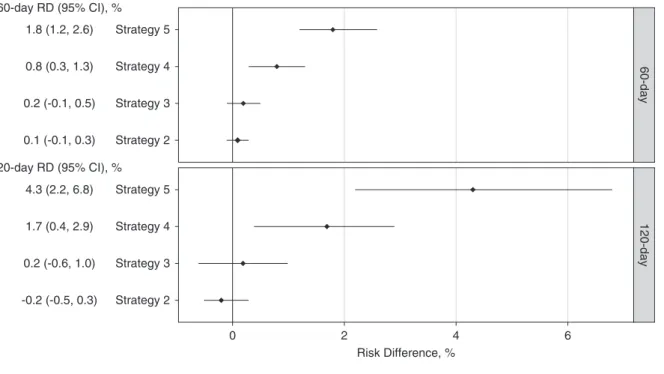
Figure 2 presents the estimated cumulative RDs of all-cause mortality among strategy groups in the first 4 months, adjusted for baseline confounding and strategy deviation in the follow-up. Compared with strategy 1, initiators of less intensive strategies (2 and 3) had lower but nonstatistically significant mortality risks; initiators of more intensive strat-egy 4 had higher risks, and the adjusted RDs and 95% CIs at 2 and 4 months were 0.6% (95% CI, 0.3% to 1.1%) and 1.5% (95% CI, 0.1% to 3.1%), respectively. The crude estimates were 1.0% and 1.7%, respectively. The highest risks were among initiators of the most intensive strategy 5, and RDs at 2 and 4 months were 1.3% (95% CI, 0.8% to 2.1%) and 3.1% (95% CI, 1.0% to 5.6%), respectively. Their respective crude estimates were 2.5% and 3.4%.
A similar trend was observed for the composite outcome of infection-related events in the 4 months (Figure 3). Compared with strategy 1, initiators of more intensive strategies (4 and 5) had higher risks, whereas those of less intensive strategies (2 and 3) had little difference. At 2 months, RDs for more intensive strategies (4 and 5) were 0.8% (95% CI, 0.3% to 1.3%) and 1.8% (95% CI, 1.2% to 2.6%), respectively. At 4 months, their respective RDs increased to 1.7% (95% CI, 0.4% to 2.9%) and 4.3 (95% CI, 2.2% to 6.8%).
We conducted sensitivity analyses varying the definition for strategy deviation, and our results were robust to such changes. We also examined censoring models with differ-ent sets of covariates to adjust for strategy deviation, and the results were robust to the variations in the models. Little difference was seen among the estimates except for the intercept-only model with no covariate (Supplemental Figures 7 and 8).
Discussion
In a large cohort of older patients on hemodialysis, we assessed the effect of continuous use offive common StatisticalAnalyses
Wecompared IV ironadministration strategies with re-spect to risks of all-cause mortality and infection-related eventsusinginverseprobabilityweightedestimationofCox marginalstructuralmodels(27,28).Wechosestrategy1asthe reference because ofits frequent useand ranked intensity amongthefivestrategies (Table1).Standardized mortality ratioweighting(29)wasusedtoadjustforpotentialbaseline confounding. As a multivariable standardization method, this weightingmethoduses the treatedstudy participants (i.e.,thepatientswhoinitiatedstrategy1inthisanalysis)as thestandardpopulationand estimatesthetreatmenteffect inapopulationwhosedistributionofriskfactorsisequalto thatofthetreatedstudyparticipants.Inverseprobabilityof censoring weighting (30) was used to adjust for potential selectionbiasintroducedbycensoringpatientswhodeviated from index strategies in the follow-up. The model for censoringweightsincludedtime-dependentfactorsforboth outcomesandstrategydeviation(includinglengthofhospital stay,totalepoetindoses,numberofdialysissessions,vascular accesstype,andcurrentironindicesinthetreatmentcourse beforedeviation),and time-independentfactors (including sex, cause of ESKD, and comorbidities). We estimated cumulative risk differences (RDs) for both mortality and infection-related outcomes comparing each strategy with the referent strategy 1 during follow-up, and their 95% confidence intervals (95% CIs) using a nonparametric bootstrapprocedurewith200repetitions(31).
We conducted sensitivityanalyses using different co-variates for censoring weights estimation and various definitions for strategy deviation. We also conducted additionalanalysesto estimate differenteffectsof strat-egy exposure. These analyses were described more completelyinSupplementalMaterial.Allstatistical anal-yses were performed using R 3.3.1 (R Foundation for StatisticalComputing,Vienna,Austria)andSAS9.4(SAS InstituteInc.,Cary,NC).
Results
Between2009 and2012,18,697 patients metourstudy entry criteria (Supplemental Figure 1), and 15,518 (83%) patientswerematchedwith atleastoneIViron adminis-trationstrategyunderconsideration.Amongthem,13,249 (71%) patients initiated one of the five most commonly used strategies and were included in the analyses. At strategyinitiation,theaverageagewas76years.Abouthalf ofthecohortwerewomen,and23%wereblack.Themost andleastcommonlyinitiatedstrategywasstrategy2and5, respectively. More intensive strategies 4 and 5 recom-mendedmoreaggressiveirontherapyinbroaderrangesof TSATandferritin.Forexample,strategy5recommended bolusdosingifTSAT,30%andferritin ,1200ng/ml,half bolus dosing if TSAT was between 30% and 40%, and maintenancedosingif TSATwasbetween40%and50%. Definitions of the strategies and dosing approaches are listedinTables1and2.
Table 3. Baseline characteristics of patients on hemodialysis by initiated IV iron administration strategy, 2009–2012
Characteristics Overall Strategy 1 Strategy 2 Strategy 3 Strategy 4 Strategy 5
N 13,249 10,882 11,293 10,397 8089 6305
Age, mean (SD) 76 (7) 76 (7) 76 (7) 76 (7) 76 (7) 76 (7)
Women, % 49 49 50 49 49 49
Race, %
Black 23 22 23 22 22 22
White 72 73 72 73 73 73
Other 5 5 5 5 5 5
Medicaid, % 29 29 29 29 29 30
Lower income subsidy, % 34 34 34 34 35 35
Region, %
Midwest 23 23 23 23 23 23
Northeast 14 14 14 14 14 14
Other 0.0 0.0 0.0 0.0 0.0 0.0
South 42 41 42 42 43 43
West 21 21 21 21 20 20
Cause of ESKD, %
Diabetes 45 45 45 45 45 44
GN 5 5 5 5 5 5
Hypertension 36 36 36 36 36 36
Other 13 14 14 14 14 15
Missing 0.3 0.4 0.4 0.4 0.4 0.4
Index year, %
2009 25 23 24 25 27 29
2010 25 23 23 25 26 28
2011 25 27 27 26 24 22
2012 25 27 26 23 23 21
Comorbidities, %
Vascular access infectiona 1 1 1 1 2 2
Pneumoniaa 2 2 2 2 3 3
Sepsisa 2 3 2 3 3 4
Infection (ADR definition)a 4 4 4 4 5 6
Antibiotic usea 20 21 21 21 24 28
IV antibiotics (dialysis center)a 11 12 12 12 14 17
Infection (broad definition)a 24 26 26 26 29 34
Diabetes 69 70 69 70 69 70
Hypertensive disease 96 95 95 96 96 97
Congestive heart failure 62 62 63 63 64 66
Myocardial infarction, acute 10 10 10 10 10 10
Angina 7 7 7 7 7 7
Coronary artery
disease/atherosclerosis
56 56 56 57 58 59
Ischemic stroke 8 8 8 8 8 9
Intracerebral hemorrhage 0.3 0.3 0.3 0.3 0.3 0.3
Subarachnoid hemorrhage 0.1 0.1 0.1 0.1 0.1 0.1
Hemorrhagic stroke 0.7 0.7 0.7 0.7 0.8 0.8
Cerebrovascular disease 24 24 24 24 24 25
Chronic obstructive pulmonary disease and asthma
33 33 33 34 34 36
Hyperlipidemia 61 60 60 61 60 60
Cancer 21 22 22 22 22 23
Liver disease 4 4 4 4 4 5
Gastrointestinal bleeding and ulcer 3 3 3 3 3 3
Blood transfusion 36 36 36 37 38 41
Blood loss anemia 5 5 5 5 6 6
Peripheral vascular disease 26 27 27 27 27 28
Rheumatic heart disease 6 6 6 6 6 7
Psychiatric disorder 6 6 6 6 6 7
Substance abuse 6 6 6 7 7 7
Autoimmune disorder 5 5 5 5 5 5
Other neurologic disorders 14 14 14 14 15 16
Hyperparathyroidism 4 4 4 4 4 4
Chronic heart disease procedures 6 5 6 6 5 6
Rheumatoid arthritis 3 3 3 3 3 3
Neuropathy 21 21 21 21 21 22
Osteoarthritis 20 20 20 20 20 21
Osteoporosis 5 5 5 5 5 5
History of fall 5 6 5 5 6 6
Last month of baseline period, mean (SD)b
Total EPO dose, 1000 units/mo 68 (73) 68 (73) 68 (73) 71 (75) 73 (79) 83 (83)
IV iron administration strategies for chronic anemia management on risks of mortality and infection-related events. Higher risks were observed among users of strategies that adopted more intensive dosing approaches (4 and 5) at higher levels of iron indices. Compared with strategy 1, the most intensive strategy 5 may result in an
additional 13 deaths (95% CI, 8 to 21) or 18 infection-related events (95% CI, 12 to 26) per 2 months per 1000 patients treated. Higher risks were also observed with more intensive strategy 4 but with a smaller magnitude.
Although previous studies, included in a recently published meta-analysis (13), have examined safety of Table 3. (Continued)
Characteristics Overall Strategy 1 Strategy 2 Strategy 3 Strategy 4 Strategy 5
TSAT, % 25 (12) 25 (12) 25 (13) 25 (13) 25 (13) 25 (14)
Ferritin, ng/ml 490 (435) 471 (437) 487 (446) 484 (463) 488 (482) 511 (525)
Hemoglobin, g/dl 11.5 (1.4) 11.4 (1.4) 11.5 (1.4) 11.5 (1.5) 11.5 (1.5) 11.4 (1.5)
Albumin, g/dl 3.6 (0.5) 3.6 (0.5) 3.6 (0.5) 3.6 (0.5) 3.6 (0.5) 3.5 (0.5)
Creatinine, mg/dl 5.1 (1.9) 5.1 (1.9) 5.1 (1.9) 5.1 (1.9) 5.1 (1.9) 5.0 (1.9)
Pretreatment systolic BP, mm Hg 143 (22) 143 (22) 143 (22) 143 (22) 142 (22) 142 (22)
Post-treatment weight, kg 74 (18) 75 (19) 75 (19) 75 (19) 75 (19) 74 (19)
Hospital days 0.7 (2.0) 0.8 (2.0) 0.7 (2.0) 0.8 (2.1) 0.9 (2.2) 1.0 (2.3)
No. of transfusions 0.03 (0.20) 0.03 (0.22) 0.03 (0.21) 0.03 (0.22) 0.04 (0.25) 0.05 (0.27)
Access, %
Catheter 63 63 64 65 66 70
Fistula 27 26 26 25 24 21
Graft 11 10 10 10 10 9
Index date, mean (SD)c
Index TSAT, % 28 (14) 29 (14) 29 (14) 29 (15) 31 (16) 29 (18)
Index ferritin, ng/ml 546 (464) 526 (488) 543 (487) 536 (506) 560 (549) 584 (608)
Index hemoglobin, g/dl 11.6 (1.3) 11.5 (1.3) 11.5 (1.3) 11.6 (1.3) 11.6 (1.4) 11.5 (1.4)
Index albumin, g/dl 3.6 (0.5) 3.6 (0.5) 3.6 (0.5) 3.6 (0.5) 3.6 (0.5) 3.5 (0.5)
Index creatine, mg/dl 5.2 (2.0) 5.2 (2.0) 5.2 (2.0) 5.2 (2.0) 5.2 (2.0) 5.2 (2.0)
IV, intravenous; ADR, annual data report; EPO, epoetin; TSAT, transferrin saturation.
aPrevalence during the last month of baseline period. b
If a laboratory test in the last month of baseline was missing, the previous test value was used.
cIf a laboratory test was missing on the index date, the last nonmissing test value was used.
1.3 (0.8, 2.1) Strategy 5
Strategy 4
Strategy 3
Strategy 2
Strategy 5
Strategy 4
Strategy 3
Strategy 2
0 2
Risk Difference, %
120-day
60-day
4 0.6 (0.3, 1.1)
-0.1 (-0.4, 0.2)
-0.2 (-0.4, 0.0)
3.1 (1.0, 5.6)
1.5 (0.1, 3.1)
-0.6 (-1.6, 0.7)
-0.7 (-1.2, 0.0) 120-day RD (95% CI), %
60-day RD (95% CI), %
cumulative doses of IV iron, to our knowledge, this study is
thefirst to assess the safety profile of IV iron administration
strategies reflective of clinical practice among patients on hemodialysis. To approximate the dynamic treatment de-cision process, we aligned exposure assessment with points of treatment decisions (19) and compared the multidimen-sional strategies adapted from complex protocols actually used by dialysis organizations in contemporary clinical practice.
Ideally, we could answer questions about the comparative safety and efficacy of different strategies with randomized, clinical trials. However, trials assessing multiple strate-gies are currently lacking and may be infeasible in many cases because of cost, time, and ethical constraints. The recent published Proactive IV irOn Therapy in haemodiALysis Patients (PIVOTAL) trial examined two strategies that were less intensive than allfive strategies in this study: a proactive regimen administering 400 mg of iron sucrose monthly (equivalent of maintenance dosing) to ferritin#700 ng/ml or TSAT,40%, and a reactive regimen administering a monthly dose of 0–400 mg of iron sucrose to maintain ferritin at 200 ng/ml and TSAT at 20% (32). By examiningfive commonly used strategies in the United States at the same time, our study could augment the trial with information on safety of more intensive IV iron dosing strategies.
Ourfindings that intensive strategies had higher
infec-tion risks seemingly contrast with the PIVOTAL trial that found no difference in infection risks between the proactive and reactive regimens (32). The difference might be explained by the different intensity of iron therapy among the strategies examined in the trial and this study. Patients in the proactive regimen in the trial received a median
monthly dose of 264 mg (and a maximum of 400 mg), which is lower than the median amount received by patients of all five strategies in this study and also the current practice patterns for bolus or“half-bolus”dosing. Additionally, the trial included incident patients on hemo-dialysis who may have a different safety profile from patients with longer dialysis vintage and more complex comorbid-ities included in this study.
Our findings confirm and complement findings from
prior observational studies. One cohort study observed higher risk of infection-related events with bolus dosing approach compared with maintenance dosing (21). Yet the magnitude of current results was larger, which might be attributable to the difference in strategy definition and age of study population. Another cohort study also showed higher mortality risk associated with nonmaintenance over maintenance strategies (12). They defined mainte-nance strategy as having IV iron in a regular schedule and nonmaintenance strategy as having any other adminis-tration practices, which included patients that had spo-radic or no use. Hence, no direct comparisons could be drawn because of the substantially different strategy def-initions.
Among these strategies in our study, the main difference was the ferritin level at which iron treatment should be withheld. Thefindings suggest that aggressive iron treat-ment with moderate-to-high ferritin level could contribute to increased risks. Compared with strategy 1 that stopped iron at ferritin of 1200 ng/ml, less intensive strategies 2 and 3 that had same TSAT levels indicating a particular dosing approach but lower stopping ferritin levels (800 and 500 ng/ml, respectively) had modestly lower all-cause mortality risks, although not statistically significant. 1.8 (1.2, 2.6)
0.8 (0.3, 1.3)
0.2 (-0.1, 0.5)
0.1 (-0.1, 0.3)
4.3 (2.2, 6.8)
1.7 (0.4, 2.9)
0.2 (-0.6, 1.0)
-0.2 (-0.5, 0.3) 120-day RD (95% CI), %
60-day RD (95% CI), %
Strategy 5
Strategy 4
Strategy 3
Strategy 2
Strategy 5
Strategy 4
Strategy 3
Strategy 2
0 2
Risk Difference, %
120-day
60-day
4 6
strategy deviation and outcomes of interest, adjustment of which would potentially attenuate the effect. How-ever, we adjusted for an extensive list of clinical, laboratory, treatment, and demographic variables and achieved good balance in the distribution of these covariates after weighting. Sensitivity analyses examin-ing different sets of covariates for the censorexamin-ing model showed the results were robust to changes in the models, suggesting the possibility that the association between strategy deviation and the outcomes under study might not be strongly confounded by the measured covariates. We may have missed or misclassified comorbidities because they were ascertained only if coded claims are available in the USRDS. Furthermore, we only included limited facility-specific variables, which may not fully account for facility effect associated with iron use and outcomes of interest.
In conclusion, there remains variation in the guidelines for IV iron administration among patients on hemodial-ysis. We found that strategies recommending relatively aggressive IV iron supplementation, especially at the moderate-to-high levels of ferritin and TSAT, were associated with higher risks of all-cause mortality and infection-related events. Ourfindings suggest caution for intense IV iron administration among older patients with elevated ferritin levels.
Acknowledgments
The authors thank DaVita Clinical Research and the US Renal Data System (USRDS) for providing data for this study.
Dr. Li reports support from National Institutes of Health, National Institute of Diabetes and Digestive and Kidney Disease Ruth L. Kirschstein National Research Service Award institutional research training grant (5T32DK007750; Principal Investigator R.J. Falk) during the conduct of the study. Dr. Cole has received investigator-initiated research funding from the US National Institute of Allergy and In-fectious Diseases at the National Institutes of Health (R01 AI100654). Dr. Stürmer receives investigator-initiated research funding and support as Principal Investigator (R01 AG056479) from the Na-tional Institute on Aging, and as Co-Investigator (R01 HL118255, R01MD011680) from the National Institutes of Health. He received support from a generous contribution from Dr. Nancy A. Dreyer to the Department of Epidemiology, University of North Carolina at Chapel Hill.
Results of this study were presented as an abstract at the 2017 International Conference of Pharmacoepidemiology and Thera-peutic Risk Management in Montreal, Canada, August 30, 2017.
The content is solely the responsibility of the authors and does not necessarily represent the official views of the National Insti-tutes of Health or the USRDS. DaVita Clinical Research had no role in the design or implementation of this study or the decision to publish.
Disclosures
Dr. Brookhart reports grants and personal fees from Amgen and AbbVie, grants from AstraZeneca, personal fees from Genetech, Fibrogen, and TargetPharma, and owns equity in NoviSci, LLC, outside the submitted work. Dr. Kshirsagar was on an Akebia Therapeutics advisory board in 2017 outside the submitted work. Dr. Stürmer reports grants from Amgen, grants from AstraZeneca, and grants from Novo Nordisk; he also receives salary support as Director of Comparative Effectiveness Research (CER), NC TraCS
Comparedwithstrategy1, strategies4and5thatmade moreintensivetreatmentrecommendationsat moderate-to-highlevelsofironindiceshadhigherrisksofadverse events. The higherrisks could potentially be explained by iron overload with persistent administration of IV iron in the setting of relatively high ferritin levels and wereconsistentwithpreviousstudies(22,33,34)andthe anticipatedadverseeffectsofexcessiveuseofIVironin this vulnerable population (35). These results suggest thattheroleandcutoffvaluesofferritinlevelshouldbe thoroughlyexamined indetermining IVirondosing.
Wefocusedontheper-protocoleffectofthesedynamic administrationstrategies usinga“cloningandcensoring” approach(27).Withthisapproach,multiplestrategiescould beassignedtoasinglepatientifthetreatmentpatternswere consistent. This approach has been widely used for the estimationofper-protocoleffect(36–39).However,withthis approach,anintention-to-treatanalysis, i.e.,comparingthe initialstrategy,wouldnotbeinformative,especiallywhen consideringdynamictreatmentstrategiesthathaveoverlapping regionsandmanypatientsmayhavebeenassignedtomanyor evenallstrategies(26).
The results of our study may not be generalizable to otherpatientpopulationsdifferentfromthoseincludedin theanalysis,whowereaged65orolderatdialysisinitiation andhavesurvivedthefirst 90 days of dialysis. Compared withthegeneraldialysispopulation,ourstudypopulation wasolderand hadhigherproportionofmale andwhite patients. Updated analyses are needed toevaluate more recentdosingprotocolsbecauseanemiamanagementmay havechanged, especiallywiththerecent policychanges including the capitated reimbursement program. Also, exposuremisclassification might occur inthe classifica-tionofstrategiesusingtreatmentexperienceina14-day assessmentwindow.However,sensitivityanalyses vary-ingthelengthofassessmentwindowshowedthe14-day window was the most representative of the treatment experienceintheentiretreatmentcoursewhile maximiz-ing time for follow-up (Supplemental Figure 2). Addi-tionally, we applied this identification approach in patients on hemodialysis in a longer time period and found the prevalence of match between strategies and treatmentexperienceincreasedsharply,startingin2010to 91%in 2012 (23). The increasing trendofmatches across time was consistent with the fact that the installation of administration strategies in dialysis clinics occurred in recent years. Moreover, we used ranges of iron dose to classify dosing approach, assuming identical treatment effect acrossthe range forasingledosingapproach.This assumption might be violated if treatment effect varies substantiallyacrossarange,whichisunlikelyastheranges werenarrow.Furthermore,wedidnotevaluatethesafety profilebyironformulation.
1. KDIGO: KDIGO clinical practice guideline for anemia in chronic kidney disease.Kidney Int Suppl2: 279–335, 2012
2. Kliger AS, Foley RN, Goldfarb DS, Goldstein SL, Johansen K, Singh A, Szczech L: KDOQI US commentary on the 2012 KDIGO clinical practice guideline for anemia in CKD.Am J Kidney Dis62: 849–859, 2013
3. Robins JM: The analysis of randomized and nonrandomized AIDS treatment trials using a new approach to causal inference in longitudinal studies. In:Health Service Research Methodology: A Focus on AIDS, edited by Sechrest L, Freeman H, Mulley A, Washington, DC, NCHSR, US Public Health Service, 1989, pp 113–159
4. Lavori PW, Dawson R: Introduction to dynamic treatment strategies and sequential multiple assignment randomization. Clin Trials11: 393–399, 2014
5. Li X, Young JG, Toh S: Estimating effects of dynamic treatment strategies in pharmacoepidemiologic studies with time-varying confounding: A primer.Curr Epidemiol Rep4: 288–297, 2017 6. Moist LM, Troyanov S, White CT, Wazny LD, Wilson JA,
McFarlane P, Harwood L, Sood MM, Soroka SD, Bass A, Manns BJ: Canadian Society of Nephrology commentary on the 2012 KDIGO Clinical Practice Guideline for Anemia in CKD.Am J Kidney Dis62: 860–873, 2013
7. Locatelli F, Ba´ra´ny P, Covic A, De Francisco A, Del Vecchio L, Goldsmith D, Ho¨rl W, London G, Vanholder R, Van Biesen W; ERA-EDTA ERBP Advisory Board: Kidney Disease: Improving Global Outcomes guidelines on anaemia management in chronic kidney disease: A European Renal Best Practice position state-ment.Nephrol Dial Transplant28: 1346–1359, 2013 8. National Institute of Health and Care Excellence (NICE):
Chronic Kidney Disease: Managing Anaemia, 2015. Available
at: https://www.nice.org.uk/guidance/ng8. Accessed October 1, 2016
9. Macdougall IC, Bircher AJ, Eckardt KU, Obrador GT, Pollock CA, Stenvinkel P, Swinkels DW, Wanner C, Weiss G, Chertow GM; Conference Participants: Iron management in chronic kidney disease: Conclusions from a “Kidney Disease: Improving Global Outcomes” (KDIGO) Controversies Conference.Kidney Int89: 28–39, 2016
10. Krishnan M, Weldon J, Wilson S, Goyhkman I, Van Wyck D: Effect of maintenance iron protocols on ESA dosing and anemia outcomes.Am J Kidney Dis57: A55, 2011
11. Schiller B: Implementing an IV Iron Administration Protocol within a Dialysis Organization, 2014. Available at: http:// www.nephrologynews.com/implementing-an-iv-iron-administration-protocol-within-a-dialysis-organization/. Assessed March 22, 2016
12. Michels WM, Jaar BG, Ephraim PL, Liu Y, Miskulin DC, Tangri N, Crews DC, Scialla JJ, Shafi T, Sozio SM, Bandeen-Roche K, Cook CJ, Meyer KB, Boulware LE; DEcIDE Network Patient Outcomes in End Stage Renal Disease Study Investigators: Intravenous
iron administration strategies and anemia management in hemodi-alysis patients.Nephrol Dial Transplant32: 173–181, 2017 13. Hougen I, Collister D, Bourrier M, Ferguson T, Hochheim L,
Komenda P, Rigatto C, Tangri N: Safety of intravenous iron in dialysis: A systematic review and meta-analysis.Clin J Am Soc Nephrol13: 457–467, 2018
14. Li X, Kshirsagar AV, Brookhart MA: Safety of intravenous iron in hemodialysis patients.Hemodial Int21[Suppl 1]: S93–S103, 2017 15. Miskulin DC, Tangri N, Bandeen-Roche K, Zhou J, McDermott A, Meyer KB, Ephraim PL, Michels WM, Jaar BG, Crews DC, Scialla JJ, Sozio SM, Shafi T, Wu AW, Cook C, Boulware LE; Develop-ing Evidence to Inform Decisions about Effectiveness (DEcIDE) network patient outcomes in end stage renal disease study in-vestigators: Intravenous iron exposure and mortality in patients on hemodialysis.Clin J Am Soc Nephrol9: 1930–1939, 2014 16. Tangri N, Miskulin DC, Zhou J, Bandeen-Roche K, Michels WM,
Ephraim PL, McDermott A, Crews DC, Scialla JJ, Sozio SM, Shafi T, Jaar BG, Meyer K, Boulware LE; DEcIDE Network Patient Outcomes in End-Stage Renal Disease Study Investigators: Effect of intravenous iron use on hospitalizations in patients un-dergoing hemodialysis: A comparative effectiveness analysis from the DEcIDE-ESRD study.Nephrol Dial Transplant30: 667–675, 2015
17. Bailie GR, Larkina M, Goodkin DA, Li Y, Pisoni RL, Bieber B, Mason N, Tong L, Locatelli F, Marshall MR, Inaba M, Robinson BM: Data from the Dialysis Outcomes and Practice Patterns Study validate an association between high intravenous iron doses and mortality.Kidney Int87: 162–168, 2015
18. Li X, Kshirsagar AV: Rest easy with intravenous iron for dialysis patients? High dose IV iron safety.Clin J Am Soc Nephrol13: 363–365, 2018
19. Brookhart MA: Counterpoint: The treatment decision design.Am J Epidemiol182: 840–845, 2015
20. Freburger JK, Ellis AR, Kshirsagar AV, Wang L, Brookhart MA: Comparative short-term safety of bolus versus maintenance iron dosing in hemodialysis patients: A replication study.BMC Nephrol15: 154, 2014
21. Brookhart MA, Freburger JK, Ellis AR, Wang L, Winkelmayer WC, Kshirsagar AV: Infection risk with bolus versus maintenance iron supplementation in hemodialysis patients.J Am Soc Nephrol 24: 1151–1158, 2013
22. Fishbane S, Mathew AT, Wanchoo R: Intravenous iron exposure and outcomes in patients on hemodialysis.Clin J Am Soc Nephrol 9: 1837–1839, 2014
23. Li X: Comparative effectiveness of intravenous iron treatment protocols in hemodialysis patients: Causal inference with dy-namic treatment regimes [dissertation]. Chapel Hill, NC, Uni-versity of North Carolina at Chapel Hill, 2017
24. Krishnan M, Weinhandl ED, Jackson S, Gilbertson DT, Lacson E Jr.: Comorbidity ascertainment from the ESRD Medical Evidence Report and Medicare claims around dialysis initiation: A comparison using US Renal Data System data.Am J Kidney Dis66: 802–812, 2015 25. Herna´n MA, Herna´ndez-Dı´az S: Beyond the intention-to-treat in
comparative effectiveness research.Clin Trials9: 48–55, 2012
Institute, UNC Clinical and Translational Science Award
(UL1TR002489), the Center for Pharmacoepidemiology (current members:GlaxoSmithKline,UCBBioSciences,Merck,Shire,and
Takeda), andfrom pharmaceutical companies (GSK, Amgen,
AstraZeneca,NovoNordisk).Dr.StürmerownsstockinNovartis, Roche,BASF,AstraZeneca,andNovoNordisk.Dr.Cole,Dr.Fine,and Dr.Lihavenothingtodisclose.
SupplementalMaterial
Thisarticlecontainsthefollowingsupplementalmaterialonlineat http://cjasn.asnjournals.org/lookup/suppl/doi:10.2215/CJN.03970318/-/ DCSupplemental.
Detailedmethods.
Supplemental Table 1. Claims-based definitions for study outcomes.
Supplemental Table 2. Claims-based definitions for study covariates.
SupplementalFigure1.Flowchartshowinghowpatientswere selectedintothecohort.
SupplementalFigure2.Schematicillustrationoftheprocessto determinethelengthofassessmentwindow.
SupplementalFigure3.Schematicillustrationoftheprocessto assesspatientadherencetotheirintravenousironadministration strategyduringfollow-up.
SupplementalFigure4.Cumulativeriskofdeviationfromtheir indexstrategyforinitiatorsofthefivedynamicintravenousiron strategiesduringthe120-dayfollow-up.
SupplementalFigure5.Cumulativeriskdifferencecurvesfor all-causemortalityvaryingmodelsforeffectestimation.
Supplemental Figure6. Cumulativerisk differencecurves for infection-relatedeventsvaryingmodelsforeffectestimation.
SupplementalFigure7.Cumulativeriskdifferencecurvesfor all-causemortalityvaryingmodelsforstrategydeviation.
Supplemental Figure8. Cumulativerisk differencecurves for infection-relatedeventsvaryingmodelsforstrategydeviation.
26. Herna´n MA, Robins JM: Using big data to emulate a target trial when a randomized trial is not available.Am J Epidemiol183: 758–764, 2016
27. Cotton CA, Heagerty PJ: Evaluating epoetin dosing strategies using observational longitudinal data.Ann Appl Stat8: 2356–2377, 2014 28. Satten GA, Datta S: The Kaplan-Meier estimator as an
inverse-probability-of-censoring weighted average.Am Stat55: 207–210, 2001
29. Sato T, Matsuyama Y: Marginal structural models as a tool for standardization.Epidemiology14: 680–686, 2003
30. Robins JM: Correction for non-compliance in equivalence trials. Stat Med17: 269–302; discussion 387–389, 1998
31. Efron B, Taibshirani R: Confidence intervals based on bootstrap percentiles. In:An Introduction to the Bootstrap, New York, Chapman & Hall, 1993, pp 168–177
32. Macdougall IC, White C, Anker SD, Bhandari S, Farrington K, Kalra PA, McMurray JJV, Murray H, Tomson CRV, Wheeler DC, Winearls CG, Ford I; PIVOTAL Investigators and Committees: Intravenous iron in patients undergoing maintenance hemodialysis.N Engl J Med380: 447–458, 2019
33. Rostoker G, Griuncelli M, Loridon C, Magna T, Machado G, Drahi G, Dahan H, Janklewicz P, Cohen Y: Reassessment of iron bio-markers for prediction of dialysis iron overload: An MRI Study. PLoS One10: e0132006, 2015
34. Rostoker G, Vaziri ND, Fishbane S: Iatrogenic iron overload in dialysis patients at the beginning of the 21st century.Drugs76: 741–757, 2016
35. Vaziri ND: Understanding iron: Promoting its safe use in patients with chronic kidney failure treated by hemodialysis.Am J Kidney Dis61: 992–1000, 2013
36. Cain LE, Robins JM, Lanoy E, Logan R, Costagliola D, Herna´n MA: When to start treatment? A systematic approach to the comparison of dynamic regimes using observational data.Int J Biostat6: 18, 2010 37. Orellana L, Rotnitzky A, Robins JM: Dynamic regime marginal
structural mean models for estimation of optimal dynamic treatment regimes, Part II: Proofs of results.Int J Biostat6: 9, 2010 38. Orellana L, Rotnitzky A, Robins JM: Dynamic regime
marginal structural mean models for estimation of optimal dynamic treatment regimes, Part I: Main content.Int J Biostat6: 8, 2010
39. van der Laan MJ, Petersen ML: Causal effect models for realis-tic individualized treatment and intention to treat rules.Int J Biostat3: 3, 2007
Received:March 28, 2018Accepted:March 6, 2019