Application Performance Index – Apdex
Final Technical Specification
Peter Sevcik, NetForecast, Inc.
Published by the Apdex Alliance
September 22, 2005
1. Introduction
The Apdex Alliance is a group of companies collaborating to promote an application performance metric called Application Performance Index (Apdex). Apdex is a numerical measure of user satisfaction with the performance of enterprise applications, intended to reflect the effectiveness of IT investments in contributing to business objectives. The Apdex metric may be used by any organization seeking insight into their IT investments. This specification defines Apdex, which is a method for calculating and reporting a metric of transactional application response time in the form of an index with a value of 0 to 1.
1.1 Status of This Document
This specification document is the cornerstone of the Apdex Alliance. It was developed and ratified by the current Alliance member companies through a consensus process. The voting members of the Apdex Alliance at the time that this document was formally adopted are: Industry Members Akamai Technologies Compuware Coradiant Expand Networks FineGround Juniper Networks Keynote Systems NetForecast Netli NetQoS Network Physics Packeteer Swan Labs Symphoniq WildPackets
Advisory Board Members Kerry Field
Senior Specialist
3M IT System & Performance Management Services Michael Kennedy
Vice President, Performance Engineering JP Morgan Chase
Doug McClure
Sr. Manager, Service & Technology Monitoring EarthLink
Peter Christy
Co-Founder and Principal Analyst Internet Research Group
Mike Pennacchi President
Network Protocol Specialists LLC Jeffrey Sult
Business Technologies Optimization Practice International Network Services (INS)
Members of the Alliance have made a commitment to implement tools or services that adhere to this specification. The Alliance is also committed to supporting an ongoing process of inquiry into the relationship between application responsiveness and user satisfaction. This specification may be updated over time based upon feedback from practical experience with Apdex, or to reflect new insights into application performance and its impact on business.
1.2 Relationship of this Document to Other Documents
The Apdex Alliance plans to develop and maintain additional documents and educational material to help enterprises understand the Apdex metric and put it to productive use within their
organizations. The Apdex Technical Guide will provide detailed information on defining Apdex parameters within an enterprise. Most recent information about the Alliance and Apdex
documents will be made available at the Alliance web site at www.apdex.org.
2. Index Overview
There are many aspects of performance relating to the delivery and management of information technology. One critical performance factor is the responsiveness of the human-computer interface from the perspective of the human user. This responsiveness is a core quality of a transactional application. The speed by which an application reacts to the needs of the user directly affects the user’s productivity and satisfaction with the application experience. It is a critical metric of application performance that has direct implications for business revenue, customer retention, and user productivity.
Therefore, measuring and tracking application response time is important to an enterprise that values the opinion and productivity of its users’ experiences. However, measuring is a necessary but insufficient step in proper management of the user experience. Meaningful reporting of the measurements is equally important. The Application Performance Index (“Apdex”) defines a methodology for reporting the responsiveness of human-application transactions, in terms of its effect on user productivity.
2.1 Index Objectives
The fundamental objective of Apdex is to simplify the reporting of application response time measurements by making it possible to represent any such measurement using a common metric. Response time data can describe a wide range of targets, and its magnitude can vary widely. The index is designed to normalize for this variability of time (wide range of seconds) and
measurement requirements (many distinct targets), producing a single metric that always has the same meaning. The goals of this metric are:
• To provide a useful summary of an application’s responsiveness
• To make it easy to understand the significance of values produced by the index • To work for all transactional applications
• To operate within a fixed rage (0-to1) and be unit-neutral
• To indicate application performance directly so that 0 is the worst performance and 1 is the best performance
• To operate in such a way that specific values of the index (e.g., 0.5) report the same user experience across any application, user group, or enterprise
• To operate in such a way that equivalent user experiences observed by different measurement and reporting tools will report the same value
The purpose of this document is to provide a standard by which many vendors of measurement and reporting tools can achieve these seven objectives.
2.2 Terms in This Document
This document makes a clear distinction between the user of an application that is being measured and the user of the tool that is performing the measurement and generating index values. The latter is called the technician. Other unique terms are defined in the glossary at the end of this document.
2.3 User-Application Interaction Model
In order for the index to properly report on users’ perceptions of application responsiveness, the measurements that are used as input must measure the actual time that a user is waiting for the application to respond. Transactional applications are characterized by a query-response
interaction process. A user types, clicks, or makes some entry followed by a period of time when the system (network, computers, databases, etc.) processes the entry and generates a response. This period is typically called “user wait time.” The critical factor regarding the duration of this time is that the user is typically incapable – even prevented from – proceeding with the
application until the response is delivered. The user will then read, react, or in some way process the response that will then lead him or her to make the next entry. This period of time where the system is waiting for the user to make the next entry is typically called “user think time.” This enter-wait-think cycle repeats many times during the user’s session with the application. The user’s perception of the application’s responsiveness or speed is formed by an accumulated number of views regarding the lengths of wait times or response times. There are many
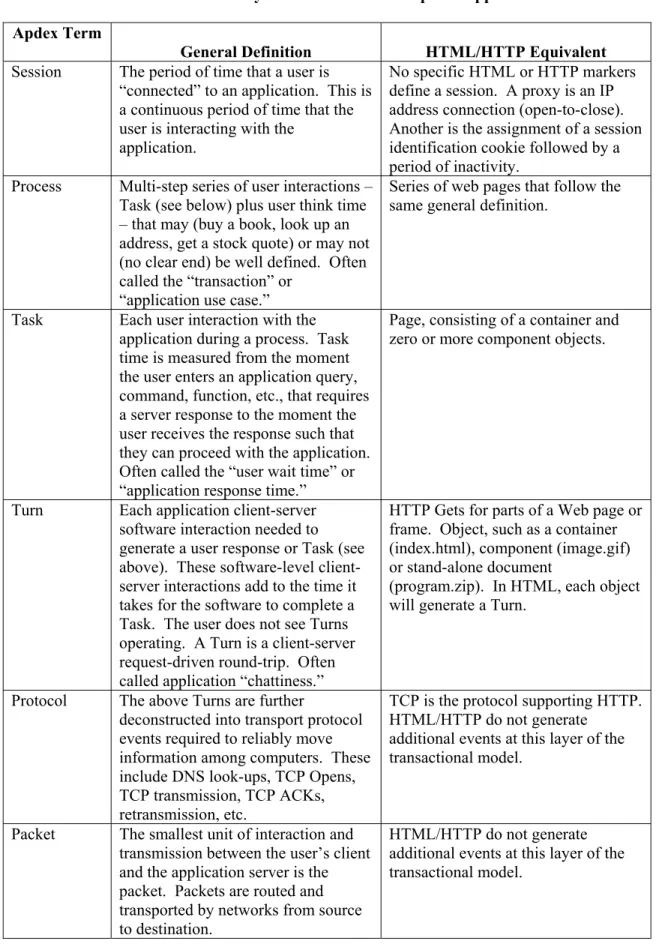
components of a client-server interaction that make up response time. Transactional applications have complex behaviors that operate at many levels. It is important to deconstruct the layers of interaction within the taxonomy described in Table 1. For purposes of clarity the table shows examples for HTTP and HTML (web-based) applications. Transactional applications based upon other protocols or proprietary schema follow the same taxonomy and may therefore be measured and reported by tools using Apdex.
Within the above taxonomy, the layer where the human user is most aware of the responsiveness or speed of the application delivery system is the Task. Specifically, the application response time is the task wait time. Therefore, application response time is herein defined as the elapsed time from when a user completes a task entry to when the system responds with all the
information needed in order for the user to proceed to the next task.
Apdex is a context-based reporting and analysis method. This specification defines the method for reporting Apdex based upon Tasks. The Apdex Alliance may expand the scope of the Apdex method to other layers of the above transactional taxonomy. Specifically, there may be an Apdex for an application process. However, such a method will require its own context setting that would be described in a separate specification document.
Table 1 – Taxonomy of Transactional Computer Applications Apdex Term
General Definition HTML/HTTP Equivalent Session The period of time that a user is
“connected” to an application. This is a continuous period of time that the user is interacting with the
application.
No specific HTML or HTTP markers define a session. A proxy is an IP address connection (open-to-close). Another is the assignment of a session identification cookie followed by a period of inactivity.
Process Multi-step series of user interactions – Task (see below) plus user think time – that may (buy a book, look up an address, get a stock quote) or may not (no clear end) be well defined. Often called the “transaction” or
“application use case.”
Series of web pages that follow the same general definition.
Task Each user interaction with the application during a process. Task time is measured from the moment the user enters an application query, command, function, etc., that requires a server response to the moment the user receives the response such that they can proceed with the application. Often called the “user wait time” or “application response time.”
Page, consisting of a container and zero or more component objects.
Turn Each application client-server software interaction needed to generate a user response or Task (see above). These software-level client-server interactions add to the time it takes for the software to complete a Task. The user does not see Turns operating. A Turn is a client-server request-driven round-trip. Often called application “chattiness.”
HTTP Gets for parts of a Web page or frame. Object, such as a container (index.html), component (image.gif) or stand-alone document
(program.zip). In HTML, each object will generate a Turn.
Protocol The above Turns are further
deconstructed into transport protocol events required to reliably move information among computers. These include DNS look-ups, TCP Opens, TCP transmission, TCP ACKs, retransmission, etc.
TCP is the protocol supporting HTTP. HTML/HTTP do not generate
additional events at this layer of the transactional model.
Packet The smallest unit of interaction and transmission between the user’s client and the application server is the packet. Packets are routed and transported by networks from source to destination.
HTML/HTTP do not generate additional events at this layer of the transactional model.
2.4 How Users Interpret Task Response Time
Users have a finite set of reactions or views by which they characterize application response time. Each such group of time durations is called a performance zone. Performance zones are defined by two thresholds – times where the zone begins and ends. Apdex defines three such
performance zones:
Satisfied Response times that are fast enough to satisfy the user, who is therefore able to concentrate fully on the task at hand, with minimal negative impact on his/her process.
Tolerating Responses in the tolerating zone are longer than those of the satisfied zone, exceeding the threshold at which the user notices how long it takes to interact with the system, and potentially impairing the user’s
productivity. Application responses in this zone are less than ideal but don’t by themselves threaten the usability of the application.
Frustrated As response times increase, at some threshold the user becomes unhappy with slow performance entering the frustrated zone. With response times in the frustrated zone, a casual user is likely to abandon a process and a production user is likely to stop working on a task.
The three zones are defined by two thresholds: T and F, in seconds, as follows. Satisfied Zone = zero to T.
Tolerating Zone = T to F. Frustrated Zone = F to infinity.
The value of F is four times the value T. For example, if users perceive response time as tolerable beginning at 4 seconds then they will be frustrated at greater than 16 seconds. The research that supports this model is described in Reference 1. Further background information is available in References 2-4.
2.5 How the Index Works
The Apdex method converts response time (seconds) into an index (unitless) by counting the number of samples in each performance zone relative to all samples. The result is a ratio that is therefore within the range of 0-to-1. An index of zero means that all of the samples were within the frustrated zone. An index of 1 means that all of the samples were within the satisfied zone. An index that is greater than zero and less than one means that the samples were from a mix of the performance zones. The higher the index value, the more satisfied the user population was for that group of application performance response samples.
3. Apdex Calculation Inputs
A wide variety of tools and methods may be used to gather the necessary information for an Apdex calculation and report. The following are the minimal requirements for such a tool. Each tool vendor may add features and capabilities above these minimal requirements.
3.1 Response Time Measurements
Tool vendors must identify which applications their tool is capable of interpreting at the task level. For example, having the ability to mark the start and end of a Web page by interpreting the
HTTP and HTML protocols is sufficient for Web-based applications. The tool must clearly identify the application by protocol (e.g., HTTP/HTML), or by software maker and product name (e.g., Microsoft Exchange), that it is capable of properly interpreting tasks and measuring
response times.
Implementation of the Task measurement will vary. However, Task measurements must be a reasonable approximation of response time measurements that could be performed by the user with a stopwatch.
Implementations of Apdex-based Task reporting may vary, provided that individual Task
measurements are assigned to a performance zone that is factored into an Apdex
calculation and reported as further defined in this specification.
3.2 Defining a Report Group
The report group is a specified set of individual measurement samples that will form the foundation for an Apdex calculation. A report group’s set of measurement samples may be unique or may have overlapping measurement samples with other report groups. Report groups can be defined in many ways, but the following are required:
Application An application as selected by the technician. At a minimum, this is the application that the tool can interpret to the task level (see above). User Group The technician must be able to define various user groups of an
application (e.g., geography, organization).
Time Period The technician must be able to define time of day periods for which the index will be calculated.
The report group is one of the fundamental controls available to a technician. The report group may be defined as broadly as all of the samples for an application, or as narrowly as a single sample. Single samples are useful for diagnostic purposes.
3.3 Threshold Settings
The technician (operator of the tool) must be able to set the target threshold, T (satisfied-tolerating boundary) and no other Apdex threshold for each application. This threshold is a positive decimal value in seconds, having no more than two significant digits of granularity.
This means that the following types of values are permitted:
0<T<10 Greater than 0 seconds and below 10 seconds can be defined to a tenth of a second.
Examples: 0.5, 1.2, 5.8, 9.9
10<T<100 Equal to or greater than 10 seconds but below 100 seconds can be defined to one second.
Examples: 10, 19, 56, 85, 99
100<T<1,000 Equal to or greater than 100 seconds but below 1000 seconds can be defined to 10 seconds.
T>1,000 Values equal to or greater than 1,000 seconds follow the same two significant digits restriction.
The threshold must be consistent for all samples of a report group.
All tools will ship with a default setting of T that will be selected by the tool vendor. The default enables the tool to begin supplying information with minimal set-up by the technician. It is recommended that the default target threshold value, T, be set to 4 seconds. Technicians have the ability to change this default setting as defined above.
3.4 Number of Measurement Samples
There must be at least one sample in the report group in order to calculate an Apdex value. Single sample Apdex results are permitted but discouraged. The primary reason to have a small sample size is to cover low traffic periods or provide data for diagnostic reasons. These are not considered good indicators of application performance.
The minimum sample size for normal reporting of the index is 100 samples within a report group. Special handling is required for smaller report groups; Section 5.2 specifies the method for reporting an Apdex result for a report group of fewer than 100 samples.
4. Calculating the Index
The Apdex does not entail new measurements – rather it is a new way to represent existing measurements, calculated by counting the measurement samples in each of the performance zones.
4.1 The Apdex Formula
The Apdex is calculated for each report group using the following equation: Given,
A report group that defines a set of measurement samples, and
a target threshold T (seconds) between the satisfied-tolerating zones of performance
Where,
F defines the threshold between the tolerating-frustrated zones of performance, and
F = 4T Such that,
There are counts of response time measurement samples within the above defined performance zones of:
Satisfied count = number of satisfied response time samples, Tolerating count = number of tolerating response time samples, Total samples = number of all samples in the report group Then,
Tolerating count ApdexT=
Total samples
Satisfied count+ 2
Note that measurements in the frustrated zone are counted in the number of total user samples in the denominator. To achieve the optimal Apdex value of 1.00, all users must experience
satisfactory performance. If some users see tolerating or frustrating performance, then the index rapidly dips below 1.00. For example, if 80% of users are satisfied and 10% are tolerating, while the remaining 10% are frustrated, the index is 0.85.
4.2 Dealing with Exceptions
User aborts are factored into the above equation. A user abort occurs when a user enters a new inquiry before the system responds with the original inquiry. A user-generated abort stops the timing of the Task. Therefore, user aborts can fall into any of the satisfied, tolerating, frustrated zones. If a tool can detect a clear server-generated abort, then it is handled differently. Server aborts (e.g., TCP closes within a Task) are counted as a frustrated sample regardless of the Task time measurement.
Some tools may have the optional capability to interpret the application to a greater level of detail than the minimal task boundary. For example, they may be able to detect user relevant
information at the layer of the application logic. If the tool can detect task errors, then these application errors (e.g. Web page 404 replies) are counted as frustrated samples.
5. Reporting the Index
The index is a decimal value between 0 and 1. The Apdex representation on all reports (screen, print, or otherwise) must adhere to the following rules.
5.1 Displaying the Apdex Value
The index always starts with a 0, followed by a decimal point, followed by the fractional value for the calculation to two decimals, and the value of T is clearly associated with the index presentation as defined below. There is a special case of the value 1.00 that starts with the digit of 1. A 1.00 is presented when the formula produces a result that can be rounded arithmetically to 1.00 (results equal to or greater than 0.995 round to 1.00).
Apdex may not be reported in granularity smaller than one one-hundredth. Decimal values of 3 or more digits are not permitted.
Tools in a computer screen or in printed reports always identify it as an Apdex value. When there are many values of the index presented in tabular form representing many reporting groups, then the Apdex label should appear with the appropriate column or row.
All Apdex values are calculated with a particular target threshold, T. The value of T must be clearly displayed in association with the Apdex score. Furthermore, in order to facilitate
exporting Apdex values from a tool and then importing them to other analysis tools, all tools must support at least one uniform output as shown below.
Uniform Output (Mandatory)
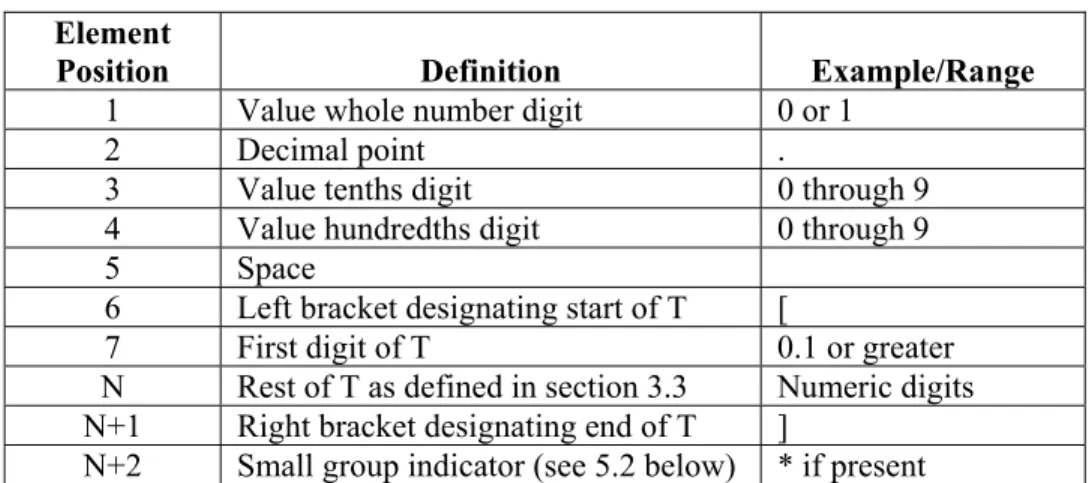
The tool shall display, print, and export to an ASCII file each Apdex value with the following fixed format.
Table 2 – Uniform Output Definition Element
Position Definition Example/Range
1 Value whole number digit 0 or 1
2 Decimal point .
3 Value tenths digit 0 through 9
4 Value hundredths digit 0 through 9 5 Space
6 Left bracket designating start of T [
7 First digit of T 0.1 or greater
N Rest of T as defined in section 3.3 Numeric digits N+1 Right bracket designating end of T ]
N+2 Small group indicator (see 5.2 below) * if present
Examples of the uniform output are: 0.85 [5.5], 1.00 [8.0]*, 0.90 [4.0], and 0.77 [450]. Subscripted Output (Optional)
Tools may display Apdex values with a T shown as a mathematical subscript. For example, an Apdex value of 0.75 that is based upon a T of 4 seconds is shown as 0.754.
When T has a decimal component, as defined in section 3.3, then the exact value of T must be shown (example: 0.754.5). In order to make the index easy to read, tools may drop the decimal portion of T if it is zero (example: 0.754.0 becomes 0.754).
5.2 Indicating Sample Size
Apdex values are calculated based upon a set of measurements (samples) in the report group. If there are a small number of samples, the tool must still present a result. However, a result for such a small report group must be clearly marked. A small report group is defined as any number of samples between 0 and 99. Apdex tools will clearly indicate that the result is based upon one of the following scenarios:
No Samples The Apdex calculation could not be performed because there were no samples (NS) within the report group. Where the calculated Apdex value would normally appear, the tool will show an output of NS. Examples: NS [4.0],NS4
Small Group When an Apdex value is the output of a small group (1 to 99) calculation, an asterisk (*) must be appended to that value. Examples: 0.80 [4.0]*, 0.804*.
5.3 When T is a General Case
General Apdex value discussions that reflect any target of T are written with “T” as shown in the following examples.
Uniform Output: “Everyone should understand that 0.90 [T] is a better value than 0.80 [T].”
5.4 Additional Reporting Rules
Some tool vendors may wish to add graphical aids to report the Apdex value. This is an optional feature, but, if implemented, it must follow these guidelines. Two forms of alternative
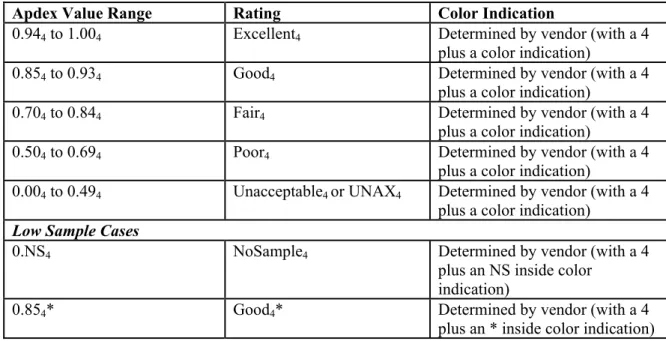
representations are permitted: the rating (a word), and a color indication. The following table shows the fixed set of alternative modes of representing the Apdex. The table shows examples where the target threshold (T) is 4 seconds.The color of the patch can be determined by the vendor in line with their existing product set, however a legend must clearly indicate which color represents each Apdex rating.
Table 3 – Apdex Qualitative Reporting Rules (Examples where T=4)
Apdex Value Range Rating Color Indication
0.944 to 1.004 Excellent4 Determined by vendor (with a 4 plus a color indication)
0.854 to 0.934 Good4 Determined by vendor (with a 4
plus a color indication)
0.704 to 0.844 Fair4 Determined by vendor (with a 4
plus a color indication)
0.504 to 0.694 Poor4 Determined by vendor (with a 4
plus a color indication)
0.004 to 0.494 Unacceptable4 or UNAX4 Determined by vendor (with a 4 plus a color indication)
Low Sample Cases
0.NS4 NoSample4 Determined by vendor (with a 4
plus an NS inside color indication)
0.854* Good4* Determined by vendor (with a 4
plus an * inside color indication)
6. References
1 "Defining The Application Performance Index," by Peter Sevcik, Business
Communications Review, March 2005. This is a comprehensive overview of Apdex and the
formation of the Apdex Alliance.
2 “Understanding How Users View Application Performance,” by Peter Sevcik, Business
Communications Review, July 2002. Describes the three zones of performance.
3 “This Is Your Father’s Performance After All!,” by Peter Christy, published in Business
Communications Review, November 2002. This is a rebuttal from Peter Christy on
reference 2.
4 “How Fast is Fast Enough?,” by Peter Sevcik, Business Communications Review, March 2003. This article continues the discussion in references 2 and 3 above of user perception of application response time.
7. Glossary
Frustrated Zone Any application response time above F in which the user is very negatively affected by response time.
Performance Zone A range of time (between two time values) that a user waits for an application to respond during which his/her perception of the application’s responsiveness does not change.
Report Group The parameters that define a set of measurement samples that are used in an Apdex calculation. These parameters are meaningful to the user and typically relate to the way the user’s enterprise is managing performance. Response Time The elapsed time beginning when a user completes a task entry and
ending when the system responds with all the information needed in order for the user to proceed to the next task.
Sample One unique user Task response time measurement.
Satisfied Zone The range of application response times between 0 and T in which the user is not affected by the response time.
Task Each user-application interface interaction that requires a user entry and an application response.
T The target threshold which defines the boundary between satisfied and tolerating performance zones.
Technician The person who controls the measurement and reporting tool. This person also reads and interprets the index. Typically, this is a member of an enterprise application, data center, or network staff.
F The threshold which defines the boundary between tolerating and frustrated performance zones.
Threshold The response time value that defines a boundary between performance zones.
Tolerating Zone The range of application response times between T and F in which the user is negatively affected by response time.
Tool The measurement and reporting system (devices, software, etc.) that generates Apdex values.
User The human user of an enterprise transactional application. The human may be accessing the application through “client” software in a client-server application architecture or he/she may be using a much simpler termination device.
Zone See Performance Zone, Satisfied Zone, Tolerating Zone, Frustrated Zone.