Accessing the Ticket System
Logging On /Off
1.
Logging On - Enter your network username ( 3 characters ) and password
2.
Check that you have logged on successfully in the top right of the screen. It should show your
school email address used for ticket correspondence. You can edit your profile here if you wish.
Submitting a Request
2.
If the request is successful, you will get a confirmation screen and a comments box to submit any
further information / requests if necessary.
Back End Processing - What Happens to your Ticket ?
2.
Once the technician has been assigned your ticket he is able to send you regular status updates.
3.
Although the ticket is normally closed by the user, the Operations Manager can also close the
ticket if he is satisfied the technician has completed the job successfully.
Checking Open Ticket Status
2.
Selecting any ticket will allow you to see the current completion status of the ticket and allow
you to communicate directly with the technician if necessary.
Closing a Ticket
1.
When the job is completed to your satisfaction you can close the ticket using the link on the right
hand side of the ticket screen
2.
You will be asked for confirmation that the job has been completed successfully. Confirmation
will also be sent via email along with the ticket history
Checking Service History / Re-Opening a Ticket
1.
Selecting the “Closed Service Request” tab will give you a current list of all closed tickets that you
have submitted.
2.
If you have a repeat occurrence of the same problem, you can re-open the ticket by clicking on
the link on the right hand side of the screen;
Enter Ticket System online at http://ticket.bis.or.id START Ticket created by user Ticket assigned by Operations Manager Ticket accepted by Technician ? Re-assign Ticket No
Ticket status communicated by Technician Completion accepted by user ? Yes Ticket Closed Ticket completed by Technician User Communication Ops Manager Communication Yes 48 Hours Elapsed? No Yes No FINISH
Service Ticket
Life Cycle
Service Charter
1. Teacher/user to open their own ticket
2. Priority is self-assigned which relies on a honesty system on the user's part
3. Guaranteed response times as follows to enable contingency planning by the user;
Emergency ::: 0 to 30 mins
High ::: 30 mins – 3 hours
Medium ::: 3 hours – 5 hours
Low ::: 1 to 3 days
4. Wherever possible, response will be face-to-face unless the problem can be resolved remotely
5. Ticket progress trail to be regularly updated by EdTechs so that users can track the current status
6. Users and IT Admin *only* can close a ticket
7. Tickets closed automatically after 48 hours if job considered done by EdTech and no response from
user
8. ALL requests to be ticketed. Phone calls, drop-in's, or Email will still be ticketed and not result in
faster service
The Value of IT Support - Insights from BECTA TCO Projects
Below is a brief extract from the BECTA "Managing IT Costs" report. Although the research dates back to
2002-2005, the findings are still relevant in terms of the the value of IT Support.
For Primary Schools, IT Support costs constituted 58% of total IT expenditure. In Secondary, this was even
higher at 62% or 153 GBP per student from the Total Cost of Ownership (TCO) of 246 GBP per student.
The cost of user self-support was also factored into these calculations. Staff not employed in technical support
roles in both primary and secondary schools spent around 30 minutes per week on installing IT, fixing
problems and carrying out related administrative tasks (for example, loading paper in printers, backing up data
or clearing disk space).
The cost of IT Support at BIS is significantly lower than the BECTA model, releasing more funds for training,
hardware, software, etc. However, the *value* of support is still high and a quality, reliable service needed to
support the many IT systems at the school.
Please help fellow users and IT staff by using the ticket system as a first point of contact with IT Support, in
accordance with the standards laid out in the Service Charter.
Paul Martindale
IT Manager
The projects in context
Between 2002 and 2005, Becta worked with schools and LEAs
on a series of projects to identify the best method for schools
to measure their own TCO of ICT. The projects involved schools
in both England and Wales, work with the latter being funded
by the Welsh Assembly Government. Becta worked with 22
primary and 11 secondary schools in England, and with seven
primary and three secondary schools in Wales. One Welsh and
two English LEAs provided support for their project schools,
and other English LEAs shared feedback with schools and
with Becta.
The aim of the projects was to find a method for identifying and presenting TCO information which would be suitable in a range of schools and environments. It was not necessary to choose a statistically representative set of schools, but it was important to get a wide range of school types. The project schools included primary, secondary and special schools in a variety of settings from rural to inner city. They also included both large and small schools, and varied in their level of ICT provision.
The project schools therefore gave a broad range of school situations in which to test the measurement of TCO, but the study made no attempt to infer the frequency of these situations nationally.
The project schools were given a TCO tool developed using commercial best practice. The data required included three years of recorded costs for hardware, software, network, consumables user training and formal support. The TCO tool also included a staff survey to record the views of teaching and non-teaching staff on such issues as their ICT confidence, training, available software and ICT support arrangements. Both sets of information were designed to produce results which gave school leaders a clear overview of how their school performed, for example in terms of staff ICT skills, relative age of equipment, and so on.
The TCO tool enabled school leaders to:
• audit current infrastructure
• identify staff ICT skills, confidence and satisfaction • value current assets
• track ICT running costs.
With these results, school leaders could benchmark financial performance against the school's own previous figures and use the information gathered to inform budget-allocation decisions for ICT support, training and infrastructure.
Insights from the Becta TCO projects
24%
24%
User self-suppor t Har dwar e5%
Sof tw are5%
Net wo rk Consumables4%
User tr aining4%
34%
Formal suppor tFigure 2: Average percentage expenditure on ICT in project primary schools
Sof tw are
5%
Netw ork Consum ables User tr aining27%
User self-suppor t22%
Har dware7%
3%
35%
Formal suppor tFigure 3: Average percentage expenditure on ICT in project secondary schools
Findings
The combined findings from the projects fell into three main areas: general TCO costs, support and management issues.
General TCO Costs
A number of important facts emerged concerning school TCO figures in general (Table 1) :
• The annual TCO of ICT (including hidden costs) averaged around £50,000 for project primary schools and around £270,000 for project secondary schools. • The average annual TCO per PC was around £1,200 in the primary schools
and around £1,000 in the secondary schools.
• The annual average TCO per pupil was around £195 in the primary schools and £246 in the secondary schools
• The total costs per PC and the cost of individual elements varied greatly between schools.
The TCO of ICT in the project schools was substantial (Tables 2 and 3, page 8), with both the TCO and the numbers of PCs reflecting the growing importance of ICT in recent years.
The way the TCO was shared out across different kinds of costs was similar for the primary and secondary groups of schools (Figures 2 and 3).
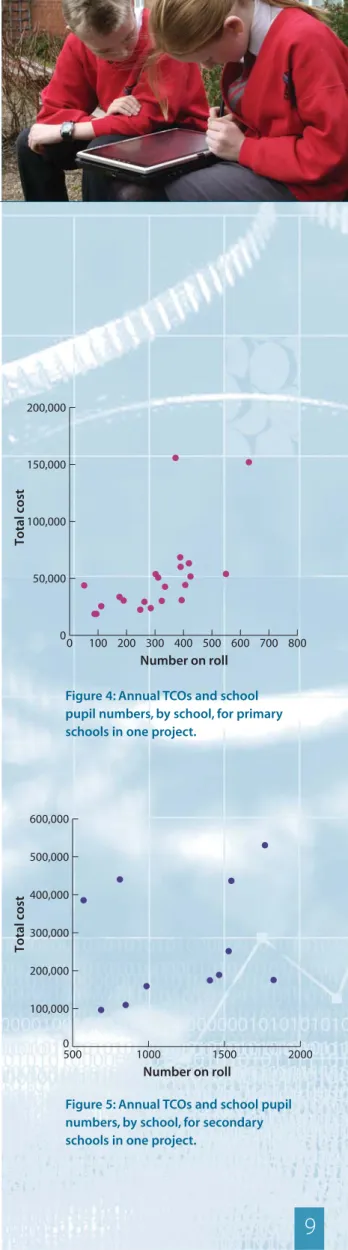
The average proportional costs shown conceal differences between schools, as schools with similar numbers of pupils could have widely different TCO totals (Figures 4 and 5, page 9). This was true for both the primary and
secondary groups.
The difference in TCO between apparently similar schools was partly due to different levels of ICT provision, but differences remained even when this was accommodated by measuring the TCO per PC. For example, project primary schools in a single LEA had TCOs per PC
ranging from £850 to £1,700. Such differences may be caused by variations in the levels of supplementary equipment purchased, in how much previous experience there was in managing ICT resources and support, or in the level of technical expertise available to the school. Examples of ICT development, support and comparative costs in schools using open source software has already been documented (Becta 2005c).
Variations also appeared in other areas of the schools' responses. For example, within a single LEA, the percentage of staff within each primary school rating their educational software as good or very good ranged from around 20% in one school to over 80% in
another. This variation may indicate differences in staff training and expectations of software, and/or variability in the educational quality, range and general suitability of the software available.
7
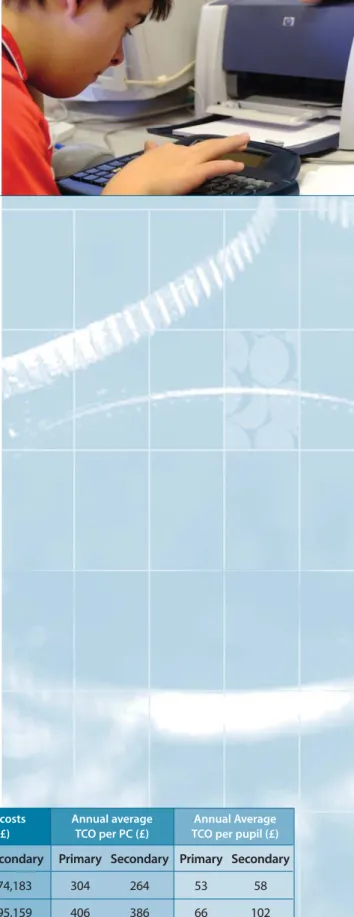
Table 1: Average annual ICT costs in project schools shown in full, per PC and per pupil
Average ICT costs Annual average Annual Average
per year (£) TCO per PC (£) TCO per pupil (£)
Cost category Primary Secondary Primary Secondary Primary Secondary
User self-support 112,116 74,183 304 264 53 58 Formal support 16,784 95,159 406 386 66 102 Training 2,113 2,769 53 12 7 2 Consumables 2,197 6,867 53 28 8 6 Network 2,668 14,168 67 57 10 13 Software 2,652 18,310 64 67 9 15 Hardware 12,415 59,828 281 222 42 50 Total 50,945 271,284 1,228 1,036 195 246
Support
This formed a major topic in the analysis. It was found that:
• Support was by far the largest cost element in ICT budgets.
• Hidden staffing costs for user self-support (from teachers, headteachers, administrative staff and classroom assistants) were a significant factor.
• Staff not employed in technical support roles in both primary and secondary schools spent around 30 minutes per week on installing IT, fixing problems and carrying out related administrative tasks (for example, loading paper in printers, backing up data or clearing disk space).
• Schools used various types (often a combination) of in-house and external technical support.
• No single method of providing technical support (for example in-house assistance or external provision) was clearly more cost-effective than others in every situation.
The most striking feature of the findings from the projects was that formal and user self-support made up an average 58% of the cost of ICT in primary schools, and nearly 62% of the cost in secondary schools. Hardware was the next highest ICT cost, followed by training, consumables, network and internet, and software, which made up much smaller proportions of the TCO (Figures 2 and 3, page 6) . There were big differences in how technical support was provided and by whom.The results from one Becta project showed that it was difficult to draw conclusions about the effectiveness of different approaches, because cost and user satisfaction varied so widely.
This does not mean that any model of support will work well in any school, as a particular approach to support might be cost-effective in one school but not in another due to its circumstances. In other words, a school’s approach to technical support needs to be part of a coherent and considered strategy, which also takes a wide range of factors into account – for example the success of earlier training, staff confidence, whether new kinds of technology are being introduced – before making decisions.
Management issues
A number of management issues emerged in the project schools: • Schools valued the opportunity to compare their costs with those of
other schools.
• Schools found many ways of using the TCO results (for example to improve decision making and raise awareness), but no school identified all the possible uses picked out by the schools as a whole.
8
Insights from the Becta TCO projects
Number of pupils 306
Number of staff (all categories, in full-time equivalents) 27
Number of dedicated technical staff 0.27
Number of PCs 31
Annual TCO of ICT £50,945
Table 2: Average numbers of pupils, staff and PCs, and annual TCO of ICT in project primary schools
Number of pupils 1,232
Number of staff (all categories, in full-time equivalents) 144
Number of dedicated technical staff 2.42
Number of PCs 224
Annual TCO of ICT £271,284
Table 3: Average numbers of pupils, staff and PCs, and annual TCO for ICT in project secondary schools
• There were organisational obstacles to carrying out a TCO analysis in some schools.
• The TCO tool was welcomed but needed simplification.
• External support was generally seen as an important factor in helping the schools assess their TCO.
School leaders were eager to compare their TCO findings with those from other schools, while recognising that differences between schools made exact comparisons unhelpful.
The diversity of situations in project schools also led school leaders to exploit the TCO findings in different ways. They used their TCO results to:
• improve forward planning • identify unexpected costs • carry out ‘what if’ analyses
• raise awareness of costs and investment levels • justify existing policies (for example to governors) • contribute to the public presentation of the school.
However, no school identified all of these possibilities. For all schools there were more possible benefits to be gained from the analysis than they had initially identified.
The TCO tool developed during the trials was clearly usable in schools differing in terms of age, ICT use, equipment provision, software, hardware and technical infrastructure. Importantly, the tool was also sufficiently flexible to fit into a number of different approaches to planning and management, and every school saw at least one use for the results it generated.
Many schools found it hard to bring together the information required for the TCO analysis. In some cases this stimulated the reorganisation of how existing information was collected and stored. This in turn created the possibility of wider management benefits by revealing gaps in the information schools required to complete their TCO models.
One project report noted that the actual process of finding the data revealed to schools where that data was kept, in what form, and who had access to it. This was vital information (both for the TCO analysis and for wider school planning), which had not been available previously.
Schools found it challenging to input three years of reliable ICT cost information into the tool, and appreciated external support. So although both the tool and the staff questionnaire were welcomed, the former clearly needed
simplification.
The support and input from Becta and LEA advisers was important in helping the project schools understand and exploit the results of the TCO analysis. Some project schools found input from the LEA particularly valuable where the LEA provided transparent cost figures for central services, such as technical support. Using lessons learned during the projects, a tool to support ICT investment planning decisions was developed in 2005 through collaboration with the London Learning through ICT project. Becta continues to provide schools with support and tools to plan and measure their ICT investments effectively.
9
Figure 4: Annual TCOs and school pupil numbers, by school, for primary schools in one project.
Figure 5: Annual TCOs and school pupil numbers, by school, for secondary schools in one project.
0 100 200 300 400 500 600 700 800 0 50,000 100,000 150,000 200,000 Number on roll Total cost 500 1000 1500 2000 0 100,000 200,000 300,000 400,000 500,000 600,000 Number on roll Total cost