Higher Education
Liezl van DykUniversity of Stellenbosch, South Africa [email protected]
Abstract: An abundance of research, by educational researchers and scholars of teaching and learning alike, can be found on the use of ICT to plan design and deliver learning activities and assessment activities. The first steps of the instructional design process are covered quite thoroughly by this. However, the use of ICT and quantitative methods to close the instructional design cycle by supporting sustainable decision making with respect to the evaluation of the effectiveness of teaching processes hold much unleashed potential. In this paper a business intelligence approach is followed in an attempt to take advantage ICT to enable the evaluation of the effectiveness of the process of facilitating learning. The focus is on micro-level decision support based on data drawn from the Learning Management System (LMS). Three quantifiable measures of online behaviour and three quantifiable measures of teaching effectiveness are identified from literature to arrive at a 3x3 matrix according to which 9 measures of e-teaching effectiveness can be derived by means of pair-wise correlation. The value and significance of information are increased within context of other information. In this paper it is shown how the value of LMS tracking data increases within context of data from other modules or others years and that useful information is created when this tracking data is correlated with measures of teaching effectives such as results, learning styles and student satisfaction. This information context can only be created when a deliberate business intelligence approach if followed. In this paper a data warehouse model is proposed to accomplish exactly this.
Keywords: learning management system, data warehouse, student tracking, decision support, student feedback, learning styles
1. Introduction
In a paper, commissioned by the EDUCAUSE Centre for Applied Research, Goldstein & Katz (2005) coined the terminology Academic Analytics to refer to Business Intelligence within an Educational setting. They argue that Business Intelligence “rang hollow to our delicately trained academic ears”. Business Intelligence
entails the gathering of data from internal and external data sources, as well as the storing and analysis thereof to make it measurable, so as to assist and sustain more efficient and longitudinal decision-making (Kimball, 2002 and Imnon et al., 2001).
An abundance of research, by educational researchers and scholars of teaching and learning alike, can be found on the use of ICT to plan design and deliver learning activities and assessment activities. The first steps of the instructional design process are covered quite thoroughly by this. However, the use of ICT and quantitative methods to close the instructional design cycle by supporting sustainable decision making with respect to the evaluation of the effectiveness of teaching processes hold much unleashed potential.
Each time a lecturer or student logs into a Learning Management System (LMS), participates in an online discussion, completes an electronic quiz or reads an electronic document, an electronic transaction is performed. With each transaction performed, data are captured by the LMS. As a result loads of data are created, which are most often only archived for record keeping purposes and not used to support decision making. In this paper a business intelligence approach is followed in an attempt to take advantage ICT to enable the use of such data to evaluate the effectiveness of the process of facilitating learning.
1.1 Scope
Strategic, tactical and operational (micro-level) decisions are made throughout any organisation. On all three of these levels, examples can be found of data that are appropriately transformed into information to become valuable decision support tools. The teaching process is one of the primary micro-level business processes of a Higher Education Institution (HEI). The focus of this study is specifically on this micro-level and considers the intelligent use of data to support the lecturer and programme co-ordinator in making decisions concerning the teaching process.
In its broadest sense, e-learning can be defined as the facilitation of any type of learning by means of any type of information and communication technology (ICT). In line with the learning-centered approach towards teaching the purpose of the lecturer is to facilitate the learning process, rather to simply deliver knowledge. Within this context the terminology e-teaching is used in this paper to refer to the facilitation of learning by
means of ICT. This discrimination is made intentionally, since the focus of this paper is not the cognitive learning processes (what is going inside the head of the learner), but rather on online behavior (what can be seen on the outside) and the correlation thereof with measures of teaching effectiveness. Furthermore, in terms of ICT, the focus of this study is on Learning Management Systems (LMSs).
1.2 Framework and methodology
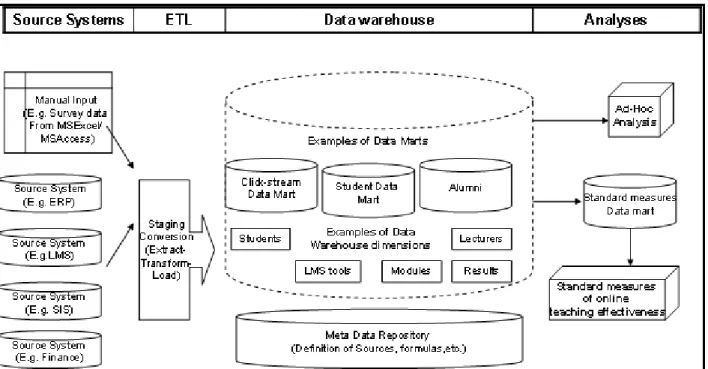
A business intelligence framework within context of an HEI is show in Figure 1. This framework is adapted for the purposes of this paper from Kimball’s (2002) generic business intelligence framework. Sources of data (left-hand side of framework) are extracted, transformed and loaded into a data warehouse, consisting of a number of data marts (middle of framework). Data from this warehouse is then organized in such a way to allow either ad hoc analyses or standard business measurement (right-hand side of framework). This paper report on literature pertaining each of the elements of this framework, specifically measures of e-teaching effectiveness. These measures are then consolidated in an attempt to provide a set of standard measures. The use of these measures to support longitudinal and contextualized decision making is then demonstrated by means of a case study.
Figure 1: The business intelligence framework
2. An overview of business intelligence practices followed at HEIs
EDUCAUSE maintains a directory of data warehouses in higher education as part of the activities of the EDUCAUSE decision support and data warehousing constituent group (Heise, 2007). Since the first contribution was made to this directory on 16 November 2000, the number of participating HEIs has grown to about 100 institutions, primarily from the United States but also from Europe. This is not an exhaustive directory of data warehouses in higher education, but it is sufficient to guide the following overview of the typical source systems, technology to extract, transform and load (ETL) data, data warehouse architecture and business areas addressed within Higher Education:
The EDUCAUSE HE data warehouse directory contains data marts such as alumni, prospective students, modules and facilities. Most analyses drawn from these data marts are designed to support decision-making on strategic level. Some operational and micro-level decision support is provided in the form of customer (student) relationship management (CRM) type of queries to enable marketing and communication targeted specifically at potential students or donors.
3. A business intelligence approach towards the evaluation of the effectiveness of
e-teaching
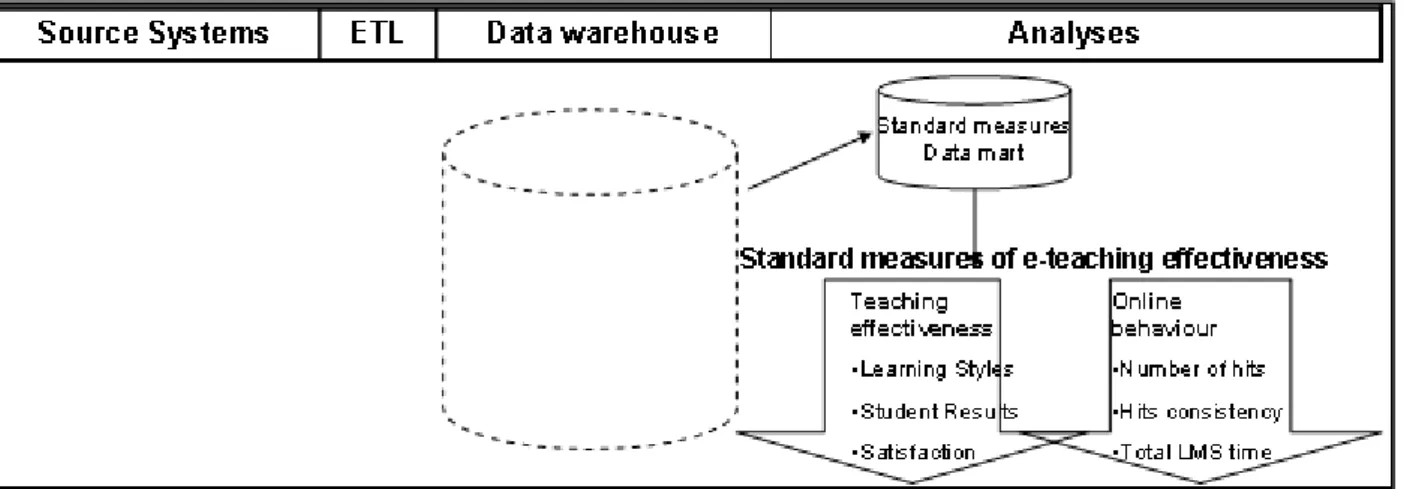
The business intelligence framework is now approached from the right hand side, starting measures of e-teaching effectiveness (Figure 2). No evidence is found in the EDUCAUSE HE data warehouse directory (Heise,2007) of micro-level decision support towards the evaluation of e-teaching. Hence, evidence from other literacy sources are brought together to arrive at a set of measures of e-teaching effectiveness. Measures of teaching effectiveness are considered in the first instance (3.1) and secondly measures of the online behaviour (3.2).
Figure 2: Measures of e-Teaching effectiveness
3.1 Measures of e-teaching effectiveness
Alavi (1994) and Lu et al. (2003) explain that teaching effectiveness can be measured in terms of a student's
results or satisfaction. Felder and Brent (2005) add a third measurement for teaching effectiveness when they made the statement that consistent proof exists that teaching is more effective if learning styles are taken into account.
3.1.1 Learning styles
A large number of standardized, validated learning styles assessment instruments are available. These instruments typically enable the quantitative measurement of student learning styles against certain dimensions. Examples of studies that compare learning styles indices with online behaviour are listed in the first column of Table 1. The specific learning styles instrument and the number of students involved are listed in columns two and three respectively. Conclusions concerning the correlation found between learning styles and online behaviour (as measured by total number of hits), are reported in the last column.
Table 1: Correlation between learning styles and LMS tracking information
Study Learning styles
instrument used
N Conclusion (Hutchens, 2002) Delta
State University
Eysenck Personality Inventory (EPI)
93 No correlation between LMS activity and learning style. (Hoskins and Hooff, 2005)
University of Portsmouth
Study inventory 110 No correlation between LMS activity and learning style. (Johnson, 2005) Grant
MacEwan College
Alienation subscale of the classroom life instrument
53 According to the author some significant correlation was found, but no details are provided.
University of Houston Group embedded figures test (GEFT)
96 “Field-dependent” students hit much less often on “teaching notes” and other class resources than any other learning style group did.
(Zywno, 2003a) Ryerson University
Felder index of learning styles
338 The active-reflective dimension yielded a positive correlation with LMS activities.
(Simpson and Yunfei, 2006) University of North Texas
Kolb’s Learning-Style Inventory
169 Learning styles statistically impact student participation terms of hits.
3.1.2 Student results
Student results (e.g. examination marks) are used in most studies as measure of teaching effectiveness. Authors such as Hutchens (2002), Lernihan (2002), Alstete and Beutell (2004), Kofoed (2004) and Green et al. (2006) reported a significant positive correlation between the total number of online hits (mouse clicks) logged per student and the final result per student. Baugher et al. (2003) and Biktimirov and Klassen (2006) are the only authors that report the rejection of the null hypothesis that there is a positive correlation between number of hits per student and final result per student. Biktimirov and Klassen (2006) did, however, find a significant positive correlation between the hits on homework solutions and final results per student.
3.1.3 Satisfaction
Sly et al. (2005) developed a survey specifically for their study. A likert scale of 1 (strongly agree) to 5 (strongly disagree) was used to measure the effectiveness of the WebCT component in terms of satisfaction. Stoel and Lee (2003) collected data about how frequently students use WebCT as measured in hours. Although this type of information can be derived from access logs, it is not available through summarized reports. Hence, Stoel and Lee (2003) assumed - as most other action researchers do - that this data is not available.
Additional data need to be gathered if information is needed concerning previous experience with WebCT, perceived ease of use, perceived usefulness, attitude and intention of use. Wharrad et al. (2005) used a survey to gather data concerning students’ experience using WebCT. Zywno (2003b) specifically designed a survey to measure indicators of student attitudes towards hypermedia-enhanced instruction. Green et al. (2006) also consulted results from the Southampton University module evaluation questionnaire. Shu-Sheng Liaw (2007) investigates learner’s satisfaction and behavioral intentions to arrive at the conclusion that self-efficacy is a critical factor that influences learners’ satisfaction.
3.2 Measures of online behaviour
By far the majority of studies that attempt to measure the effectiveness of e-learning use the aggregate data provided by the student tracking report of the LMS. This report only typically provides data concerning the
3.3 Measuring method
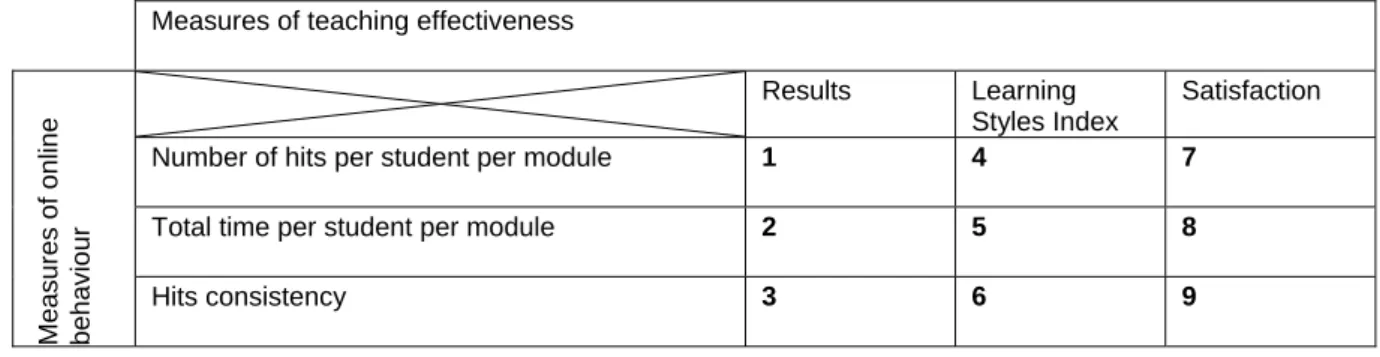
Statistical regression analysis refers to a family of quantitative methods for determining the correlation between a dependent variable and one or more independent variables. All of the previously discussed measures are quantifiable, which make it ideal for regression analysis. Given these two sets of measures, nine (3 x 3) correlation coefficients can be determined statistically, as shown in Table 2.
Table 2: Correlation between teaching effectiveness and online behaviour
Measures of teaching effectiveness
Measur
es of onlin
e
beh
avio
ur
Results Learning
Styles Index
Satisfaction
Number of hits per student per module 1 4 7
Total time per student per module 2 5 8
Hits consistency 3 6 9
4. Case study
In the third part of this paper a case study is described to evaluate the usefulness of following a business intelligence approach. This case study is based on data from one specific faculty from the University of Pretoria (2005 and 2006). The University of Pretoria has nine faculties, in which more than 500 programmes are offered. It is the largest residential university in South Africa and provides training for approximately 50 000 students, of which about 30 000 are residential students. In 1997 the University Council approved telematic education as a mainstream activity of the University and the Department of Telematic Education was established (Lazenby, 2002). WebCT was installed for the first time at the University of Pretoria in 1998. The electronic tracking data for purposes of this study was drawn during 2005 and 2006, during which time period WebCT Campus Edition 6 was used.
Within this faculty, undergraduate as well as postgraduate programmes are presented. The undergraduate programme is presented through full time, residential courses in a blended learning mode. During 2005 nine out of eleven first year contact courses within this faculty had a WebCT presence. In 2001 the first WebCT learning environment was created for a second year course. From 2002 it was expanded to second year students, until all undergraduate and postgraduate courses in this faculty had some form of WebCT presence in 2005. The extent to which each of these are used depend very much on the way in which individual lecturers facilitate the learning process. By 2003 a WebCT presence was created for all third year courses in the undergraduate programme. The extent to which this presence was utilized depends greatly on the attitude of individual lecturers towards the use of ICT to facilitate learning. Since 2004 a WebCT presence existed for all undergraduate and post graduate courses in the department. This case study is based on 2005 (both terms) and 2006 (first term) WebCT tracking data.
4.1 Data marts
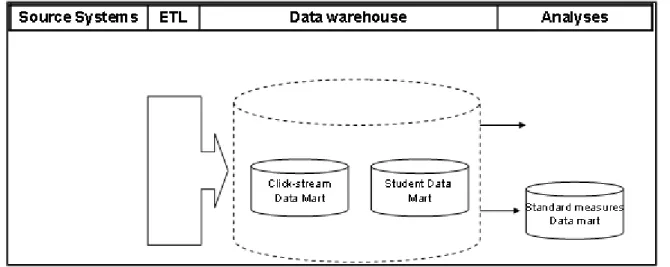
To ensure standardization and longitudinal studies, these measures are stored in standard measures data marts. Data for the three measures of teaching effectiveness are contained in the student data mart, while data for the three measures for online behaviour are contained in the click-stream data mart. Together, these data marts form the data warehouse, as shown in Figure 3.
Figure 3: Data Marts
4.1.1 Student data mart
The student data mart contains all of the attributes per student, including predicate results (progress marks/term marks), examination results and final results, as well as the Felder Learning Styles Indices for each student. Unfortunately, the student satisfaction data could not be included, since this data was gathered anonymously. Hence, the satisfaction indices can not be associated with specific students and subsequently it is impossible to perform any statistical regression analysis with respect to this data.
4.1.2 Click-stream data mart
The click-stream data mart contains the measures of online behaviour. The tracks left behind by a student as he click his way through an LMS is called the click-stream. The click-stream data mart is an aggregate of this click-stream. This data mart contains one row for each seat on the LMS (student per module). In each of these rows the three measures of online behaviour are indicated:
Total number of hits per student per module; Total time per student per module;
Hits consistency per student per module. 4.2 Data sources
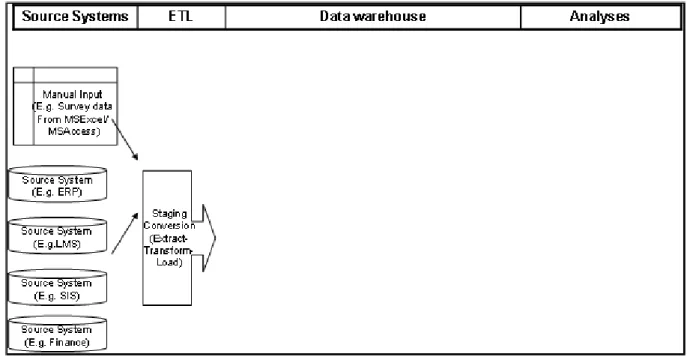
The content of the data warehouse is extracted from existing information systems (Figure 4). The click-stream data is captured by the learning management system (LMS), in this case WebCT campus edition 6. The format of this data is flat files (.csv). Several data cleaning and data integration processes were followed before this data could be loaded into the data mart. The student results were extracted from the student information system (SIS) before it was transformed and loaded into the data mart.
Data with respect to student learning styles: Felder’s (2005) instrument for the measurement of learning styles was used to measure the learning styles of students. Felder’s (2005) questionnaire was administered during 2005 by means of a WebCT quiz to all undergraduate Industrial Engineering students and the University of Pretoria. Participation was voluntary. This data was extracted from WebCT before it was transformed in such a way so as to allow statistical regression, and loaded into the student data mart.
Figure 4: Data sources
4.3 Case study outputs and conclusion
The purpose of this case study is to demonstrate the usefulness of LMS tracking data to support decision making. To accomplish this, the student tracking data are quantified in terms of hits frequency, hits consistency and average time per hit. These indicators are correlated with performance per student per module as well as learning style index (Felder ILS).
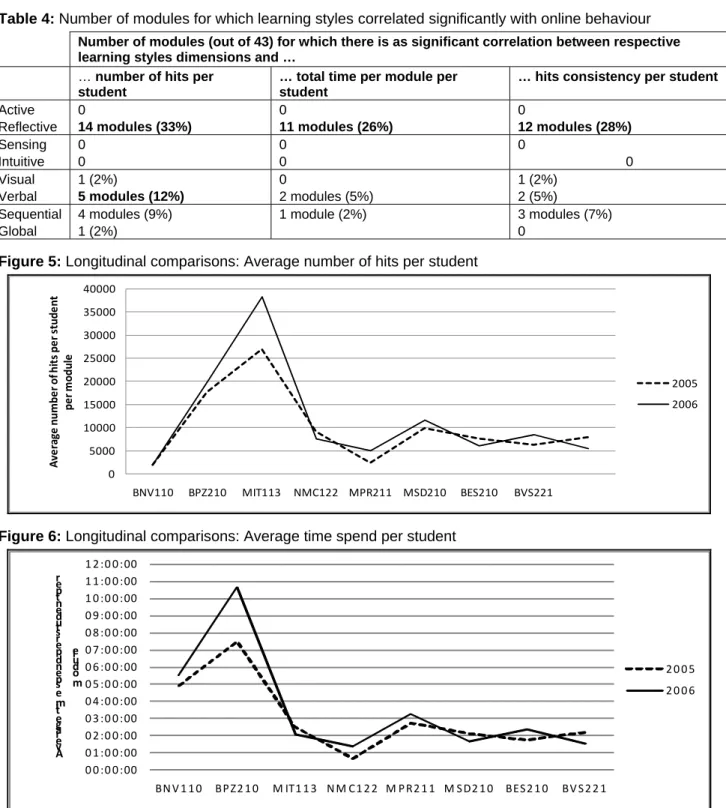
The number of modules for which online behavior (number of hits per student; total time per module per student; hits consistency) correlates significantly with measures of teaching effectiveness (results and learning styles) are shown Table 3 and Table 4 respectively. For this study two sets of data are assumed to correlate significantly when p<0.05, which means that there is a 5% chance that the assumption is wrong. Hence, in Table 4 the grey results are considered to be co-incidental.
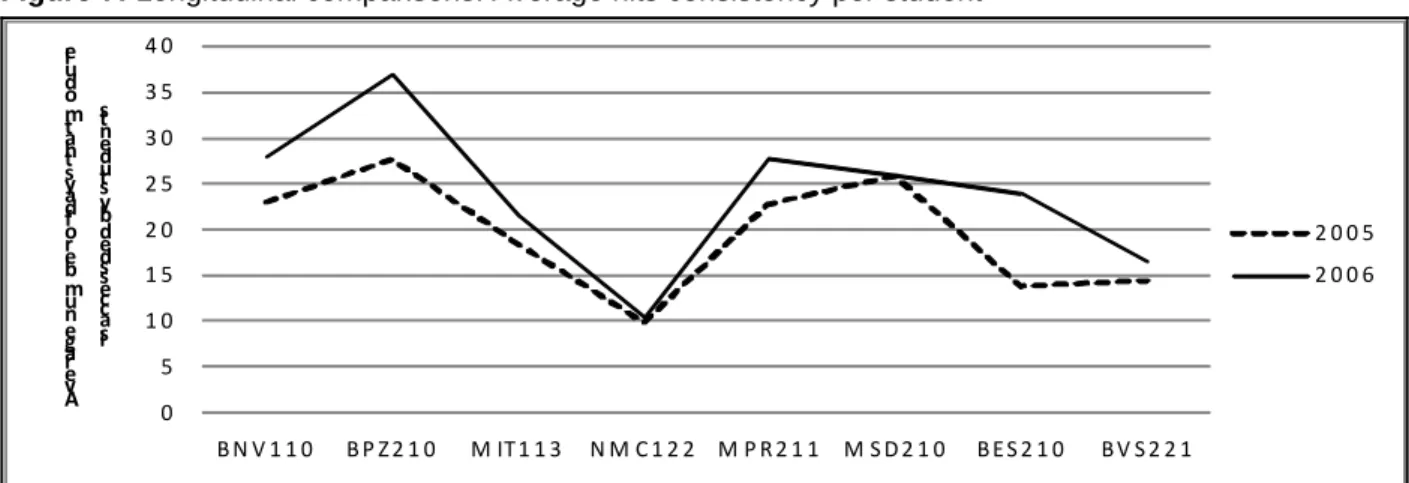
The online behavior data for the first term modules for which data are available for 2005 as well as 2006 are shown in Figure 5, Figure 6 and Figure 7 respectively, to allow longitudinal conclusions concerning the three measures of online behavior. Mazza and Dimitrova (2007) as well as Christobal et. al. (2008) illustrated, within context of Learning Management Systems, the value of presenting tracking data visually. Hence, these figures are presented as graphs, rather than a tables of data.
Table 3: Number of modules for which results correlated significantly with online behaviour
Number of modules (out of 38) for which there is as significant correlation between respective results and …
… number of hits per student
… total time per module per student
… hits consistency per student
Term mark 6 modules (16%) 14 modules (37%) 11 modules (29%)
Examination mark
Table 4: Number of modules for which learning styles correlated significantly with online behaviour
Number of modules (out of 43) for which there is as significant correlation between respective learning styles dimensions and …
… number of hits per student
… total time per module per student
… hits consistency per student Active
Reflective 0
14 modules (33%)
0
11 modules (26%)
0
12 modules (28%) Sensing Intuitive 0 0 0 0 0 0 Visual Verbal 1 (2%)
5 modules (12%)
0
2 modules (5%)
1 (2%) 2 (5%) Sequential
Global
4 modules (9%) 1 (2%)
1 module (2%) 3 modules (7%)
0
Figure 5: Longitudinal comparisons: Average number of hits per student
0 5000 10000 15000 20000 25000 30000 35000 40000
BNV110 BPZ210 MIT113 NMC122 MPR211 MSD210 BES210 BVS221
Av e rag e nu m b e r of hi ts pe r st ude nt pe r mo d u le 2005 2006
Figure 6: Longitudinal comparisons: Average time spend per student
0 0 :0 0 :00 0 1 :0 0 :00 0 2 :0 0 :00 0 3 :0 0 :00 0 4 :0 0 :00 0 5 :0 0 :00 0 6 :0 0 :00 0 7 :0 0 :00 0 8 :0 0 :00 0 9 :0 0 :00 1 0 :0 0 :00 1 1 :0 0 :00 1 2 :0 0 :00
BN V 1 1 0 BP Z2 1 0 M IT1 1 3 N M C1 2 2 M P R2 1 1 M S D2 1 0 BES2 1 0 BV S 2 2 1
A ve ra ge ti m e sp e n d p e r st u d e n t p e r m o d u le
2 0 0 5 2 0 0 6
Figure 7: Longitudinal comparisons: Average hits consistency per student 0 5 1 0 1 5 2 0 2 5 3 0 3 5 4 0
B N V 1 1 0 B P Z 2 1 0 M IT 1 1 3 N M C 1 2 2 M P R 2 1 1 M S D 2 1 0 B E S 2 1 0 B V S 2 2 1
A ve ra ge n u m b e r o f d ay s th at m o d u le is ac ce ss d e d b y st u d e n ts
2 0 0 5 2 0 0 6
Although is it not shown in this paper, the measures and correlation indices per module are made available to learning facilitators by means of a teaching effectiveness dashboard per module. The results of this dashboard should be considered within context of the entire module. For example, in cases where no significant correlation was found between online behavior and results, the lecturer did not use the LMS for anything more than publishing the module framework. In all instances where number of hits correlated significantly with the Sequential Learning Style the calendar tool was used.
When looking at the bigger picture presented by Table 3, Table 4, Figure 5, Figure 6 and Figure 7 some interesting observations are be made:
Students who tend to lean towards reflective, verbal and sequential learning styles generally are more active online.
From 2005 to 2006 online activities increased amongst students in this department with respect to all there measures of online behaviour. This can be due to an increased availability of the LMS, an increase in utilization of the LMS by the learning facilitator or even an increase in the number of digital natives entering our HE system.
In the case of two modules (NMC122 and BES210) different persons were responsible for these
modules in 2006 and 2005 respectively. In these two cases there is more that average increase in online behaviour, which indicates that it is not the ICT itself that influence the effectiveness of teaching, but rather the way in which it is used.
BNV110 and BPZ210 are the two modules with the highest indices of online behavior (number of hits,
time online as well as hits consistency). These modules are presented by the same lecturer. Only this lecturer reflected critically as scholar of teaching and learning and acted upon the 2005 indices. Keeping in mind that the other modules draw upon the same student population, the conclusion is made from the graphs that the attempts of the BNV110/BPZ210-lecturer paid off in 2006.
5. Wider implications and future work
"Despite the availability of powerful computers, advanced network and communication infrastructures, and sophisticated software applications, university decision makers, still lack access to the critical information necessary for informed decision making" Guan et.al. (2002).
Business intelligence entails the gathering of data from internal and external data sources, as well as the storing and analysis thereof to make it measurable, so as to assist and sustain more efficient and longitudinal decision-making (Kimball, 2002 and Imnon et al., 2001). Considerable amounts of information and data are available and used to evaluate the effectiveness of teaching processes. However, this information very seldom contributes in a sustainable way to the intelligence of the business (HEI). In this paper a business intelligence approach was followed to arrive at measures of online behaviour (number of hits, time online and hits consistency) that can be used in a standardized way to allow decision support towards the improvement of teaching process in a sustainable way.
The value and significance of information are often increased within context of other information. In this paper it was showed how the value of LMS tracking data increases within context of data from other modules or others years and that useful information is created when this tracking data is correlated with measures of teaching effectives such as results and learning styles. This information context can only be created when a
deliberate business intelligence approach if followed. Even more context can be created for example when student feedback (satisfaction) data are gathered in way to allow correlation with online behaviour.
In many respects this paper leaves us with more questions than answers. However, a framework and approach are now defined and proved in concept, according to which LMS tracking data can be transformed into useful information in a efficient, sustainable and replicable way to allow information to support micro-level decision making for HEIs.
References
Alavi, M. (1994). “Computer-mediated collaborative learning: An emperical evaluation.” MIS Quaterly, 22(2):159-174. Alstete, J.W. and Beutell, N.J. (2004). “Performance indicators in online distance learning courses: A study of
management education.” Quality Assurance in Education, 12(1):6-14..
Baugher, D., Varanelli, A. and Weisbord, E. (2003). “Student hits in an internet-supported course: How can instructors use them and what do they mean?” Decision Sciences Journal of Innovative Education, 1(2):159-179.
Biktimirov, E.N. and Klassen, K.J. (2006). “Relationship between the use of online support materials and performance in the introductory finance course.” FMA Meeting. Salt Lake City, Uta.
Christobal, R., Ventura, S. and Garcia, E., (2008). “Data mining in course management systems: Moodle case study and tutorial.” Computers & Education, 51:268-384.
Engelbrecht, J. and Harding, A. (2001). “WWW Mathematics at the University of Pretoria: The trial run.” South African Journal of Science, 97.
Felder, R. and Brent, R. (2005). “Understanding student differences.” Journal of Engineering Education, 94(1):57-72. Goldstein, P.J., and Katz, R.N. (2005) “Academic Analytics: The Uses of Management Information and Technology in
Higher Education”. EDUCAUSE Centre for Applied Research. 2005.
Guan, J., Nunez, W., and Welsh, J. F. (2002). Institutional strategy and information support: the role of data warehousing in higher education. Campus-Wide Information Systems, 19(5):168-174.
Heise, D. (2007). EDUCAUSE Decision Support Data Warehouse Constituent Group. Downloaded from dheise.andrews.edu/dw/DWData.html on [26 March,2007].
Hoskins, S.L. and Hooff, J.C.V. (2005). “Motivation and ability: which students use online learning and what influence does it have on their achievement?” British Journal of Educational Technology, 36(2):177-192.
Hutchens, S. A. (2002). “Success in technology-assisted courses: An investigation of the e®ects of student personality traits.” Proceedings of the International Conference on Computers in Education. 0-7695-1509-06/02.
Imnon, W. H., Imhoff, C., and Sousa, C. (2001). Corporate Information Factory. John Wiley and Sons, Inc. Canada, 2nd edition.
Johnson, G. M. (2005). “Student alienation, academic achievement, and WebCT use.” Educational Technology and Society, 8(5):179-189.
Kimball, R. and Ross, M. (2002). The data warehouse toolkit. John Wiley and Sons, 2nd edition. ISBN 0-471-20042-7. Kofoed, J. (2004). “Can students improve performance by clicking more? Engaging students through online delivery?”
Studies in Learning, Evaluation Innovation and Development, 1(2).
Lazenby, K. (2002). “Technology and education innovation: A case study of the virtual campus of the University of Pretoria.” PhD thesis, Department of Teaching and Training studies of the Faculty of Education, University of Pretoria.
Lernihan, O. (2002). “An investigation into the potential of the use of multimedia development webct to enhance the understanding of information technology for students, within a traditional 3rd level lecturing environment.” Master's thesis, Science in Computer Applications for Education, Dublin City University.
Liaw, S., (2008). “Investigation students’ perceived satisfaction, behavioural intention, and effectiveness of e-learning: A case study of the Blackboard system.” Computers and Education, 51:864-873.
Lu, J., Yu, C. S., and Lui, C. (2003). “Learning style, learning patterns, and learning performance in a WebCT-based mis course.” Information and Management, 40(6).
Lundy, J., Harris, K., Igou, B., and Zastrocky, M. (2002). Gartner's e-learning glossary. Research Note M-14-9025, Gartner Research.
Mazza, R. and Dimitrova, R., (2007). “CourseVis: A graphical student monitoring tool for supporting instructors in web-based distance courses.” International Journal of Human-Computer Studies, 51(2):125-139.