SPECTROPHOTOMETRIC DETERMINATION OF
CINNARIZINE THROUGH CHARGE-TRANSFER COMPLEX
FORMATION WITH POLYNITRO COMPOUNDS
Y. M. Issa
[a], A. F. A. Youssef
[a], W. F. El-Hawary
[a,b]*, E. A. Abdel-Ghaffar
[c]Keywords: Spectrophotometric determination, Cinnarizine, Charge-transfer complexes, Polynitrobenzene π-acceptors
Spectrophotometric studies were carried out to investigate the charge-transfer reaction between cinnarizine and dipicrylamine (DPA) or 2,6-dinitrophenol (DNP). Simple and rapid spectrophotometric methods were suggested for the determination of cinnarizine (CN) in pure and in its pharmaceutical dosage forms. The colored products are quantified spectrophotometrically at 430 and 440 nm for cinnarizine complexes with DPA in a mixture of 15% dioxane in dichloroethane (I) and 15% ethyl acetate in chloroform (II), respectively. On the other hand, cinnarizine complexes formed with DNP in acetonitrile (III) and in a mixture of 30% dichloroethane in ethyl alcohol (IV) were quantified at 460 and 430 nm, respectively. The proposed procedures were successfully utilized for the determination of the drug in its pharmaceutical formulation using standard addition and calibration curve methods. Beer's law was obeyed in the concentration ranges 1.00-22.00, 1.50-36.80, 1.50-36.80 and 3.60-36.80 µg mL-1 cinnarizine with molar absorpitivities of 1.64×10⁴, 1.43×10⁴, 5.16×10⁴ and 3.60×10⁴ (L mol-1 cm-1), for CN-DPA in mixture (I), CN-DPA in mixture (II), CN-DNP in acetonitrile (III) and CN-DNP in mixture (IV), respectively. The relative standard deviations are less than 1.02%. The results of analysis of commercial tablets (Cinnarizine-25) showed that there is no interference from any excipient. Statistical comparison of the results was performed with regard to accuracy and precision using student's t-test and F-ratio at 95% confidence level.
* Corresponding Authors
E-Mail: [email protected]
[a] Chemistry Department, Faculty of Science, Cairo University, Giza, Egypt
[b] Chemistry Department, Faculty of Science, Taif University, Taif, Saudi Arabia
[c] National Organization for Drug Control and Research, Giza, Egypt
Introduction
Cinnarizine (CN), 1-(diphenylmethyl)-4-(3-phenyl-2-propenyl) piperazine (Fig. 1), is a piperazine derivative with antihistaminic, sedative, and calcium channel blocking activity. It is used for the symptomatic treatment of nausea and vertigo caused by Menier’s disease and other vestibular disorders. It is also used for the prevention and treatment of motion sickness.1,2 Several
analytical methods have been reported for the determination of CN, either in pure form or in pharmaceutical preparations and biological fluids. These methods include non-aqueous titration,3
spectrophotometry,4–8 electrometry,9,10 high-performance
liquid chromatography (HPLC),11–14 gas chromatography
(GC),15 titrimetry16 and capillary electrophoresis.17
The molecular interactions between electron donors and acceptors are generally associated with the formation of intense colored charge-transfer complexes, which absorb radiation in the visible region. The photometric methods based on these interactions are usually simple and convenient because of the rapid formation of the complexes.
Figure 1. The structural formula of cinnarizine (CN).
The present article deals with the spectrophotometric determination of cinnarizine (CN) in pure form and in pharmaceutical preparations using dipicrylamine and 2,6-dintirophenol as electron acceptors.
Experimental
Materials and reagents
All reagents and chemicals used were of analytical grade, and the solvents were of spectroscopic grade. Dipicrylamine and 2,6-dinitrophenol chemicals were provided by BDH chemical company. Cinnarizine standard powder was kindly provided by Edwic Chemical Company, Egypt and used as received and cinnarizine-25 tablets (1 mg/tablet) produced by Adco Drug Company were obtained from local market.
Stock solution of dipicrylamine, 10-2 mol L-1, was
ethyl acetate in chloroform, mixture (II). For 2,6-dinitrophenol reagent, a 10-2 mol L-1 solution was
prepared by dissolving 0.1841 mg in 100 mL acetonitrile (III) and in 30% dichloroethane in ethyl alcohol mixture (IV). These solutions are stable for 2 weeks. 10-2 mol L-1
cinnarizine stock solutions were prepared by dissolving 0.3685 mg in a 100 mL of mixture (I), mixture (II), acetonitrile (III) and mixture (IV). These solutions are stable for 2 weeks.
Preparation of solid complexes
A solution contains 1 mmol CN was prepared in solvent mixture (I), (II) or (IV) and pure acetoitrile (III), while the DPA solutions contain 1.0 and 0.5 mmol were prepared in solvent mixtures (I) and (II), respectively. For DNP, solutions contain 1.0 and 2.0 mmol were prepared in pure acetonitrile (III) and solvent mixture (IV), respectively. The reagent solutions were added individually with constant stirring and left until solvent evaporated and then washed by petroleum ether.
Apparatus
The spectral measurements were carried out using a single beam spectrophotometer model 22 Spectro Labomed, with quartz cells of 1-cm optical path length. Elemental analysis of the resulting reaction products was carried out by atomic CHN analyzer (Perkin Elmer model 2400) in the Micro analytical Center, Faculty of Science, Cairo University, Giza, Egypt.
General recommended procedures
Using dipicrylamine (DPA)
Aliquots of CN solution containing 1.0-36.8 µg were transferred into 10 mL measuring flasks. To each flask, 0.1 mL of DPA in mixture of 15% dioxane in dichloroethane or in mixture of 15% ethyl acetate in chloroform was added. The reaction mixture was mixed well and the volume was completed to 10 mL with the same solvent. The absorbance was measured against a blank solution, containing all additives except the drug, at 430 and 440 nm, in mixture (I) and mixture (II) respectively.
Using 2,6-dinitrophenol (DNP)
Different aliquots of the working standard solution containing 3.6-36.8 µg were transferred into 10 mL measuring flasks. To each flask, 0.2 mL of DNP in pure acetonitrile or in 30% dichloroethane in ethyl alcohol was added. The reaction mixture was completed to 10 mL with the same solvent. The absorbance was measured against a blank, containing all additives except the drug, at 460 and 430 nm, in acetonitrile (III) and mixture (IV) respectively.
Pharmaceutical analysis
20 tablets were weighed and finely ground, then a weight equivalent to one tablet was dissolved in 15% dioxane in dichloroethane or in pure acetonitrile and
transferred into a 25 mL measuring flask. The solution was shacked and filtered to remove any undissolved excipients substances. The resulting solution was subjected to analysis as described in the general procedures.
Determination of the stoichiometric ratio of the complexes
The stoichiometry of the charge-transfer complexes formed between cinnarizine and both PDA and DNP were studied by the aid of continuous variation method,18
molar ratio method19 and elemental analysis.
For the Job’s method of continuous variation, master equimolar (2 × 10⁻⁴ mol L-1) aqueous solutions of CN and
DPA or DNP were prepared. Series of 10 mL portions of the master solutions of CN and DPA or DNP were made up comprising different complementary proportions (0:10, 1:9, . . ., 9:1, 10:0) in 10 mL calibrated flasks. For the molar ratio method, the concentration of CN was kept constant by adding 0.2 mL of 2×10⁻⁴ mol L-1 of CN while
the concentration of the acceptors (DPA or DNP) was changed over a wide range. All solutions were further manipulated as described under the general recommended procedures. The solid charge-transfer complexes were subjected to elemental analysis and the results are presented in Table 1.
Table 1. Elemental analysis of the formed DPA and CN-DNP charge-transfer complexes.
a15% Dioxane in dichloroethane; b15% Ethyl acetate in chloroform; cAcetonitrile; d30% Dichloroethane in ethyl alcohol.
Results and discussion
The charge-transfer complex formation reactions are based on the π-acceptors that react with the basic nitrogenous compounds as donors to form charge-transfer complexes or radical anions according to the polarity of the solvent used.
Absorption spectra
The absorption spectra of CN-DPA and CN-DNP complexes were scanned in different solvents (acetonitrile, 1,4-dioxane, ethyl acetate 1,2-dichloroethane, and their mixtures with ethyl alcohol and chloroform). The results showed that a mixture of 15% (v/v) 1,4-dioxane in 1,2-dichloroethane and 15% ethyl acetate in chloroform are
Formed complex Molar ratio
(Found)% Calculated%
C H N
CN-DPA(a) 1:1 (55.10)
56.40
(3.78) 3.83
(14.22) 15.59
CN-DPA(b) 2:1 (65.91)
65.29
(5.95) 5.18
(11.81) 13.09
CN-DNP(c) 1:1 (69.99)
69.48
(5.95) 5.60
(10.04) 10.13
CN-DNP(d) 1:2 (56.50)
61.80
(3.75) 4.62
the most suitable solvents for CN-DPA while pure acetonitrile and 30% dichloroethane in ethyl alcohol are the most suitable solvents for CN-DNP complexes. High molar absorptivity values (1.64×10⁴, 5.16×10³ L mol-1
cm-1) for CN-DPA in mixture (I) and CN-DNP in
acetonitrile have been obtained. The reaction between CN and DPA or DNP was performed and the absorption spectra of the products were recorded against reagent blank (Figs. 2 and 3). It was found that intense yellow-colored complexes, exhibiting max at 430 and 460 nm have been obtained for CN-DPA and CN-DNP in mixture (I) and acetonitrile (III), respectively.
Spectral characteristics of the CT complex
The oscillator strength (f), which is a dimensionless quantity used to express the transition probability of the CT band,20 and the transition dipole moment (μ
EN) of the
CT complexes21 were calculated from the following
expressions: where
∆ν1/2 is the band width at half absorbance and
εmax and νmax are the molar absorptivity and wave
number at the absorption maximum of the complex, respectively.
In these equations, νmax has been expressed in cm−1. The
relative low values of f indicate a weak interaction between the donors–acceptor pairs.22 The R
N is the
resonance energy of the complex in the ground state,
which is obviously a contributing factor to the stability constant of the complex (a ground state property), can be determined by the following equation23:
where
νCT represents the frequency at maximum
absorbance of the CT band.
Resonance energies for the CT complexes of CN with different electron acceptors, Table. 2, indicate that the probability and dipole moment of transition in case of CN-DPA in mixtures (I) and (II) are higher than those of CN-DNP in acetonitrile (III) and mixture (IV).
The probability of transition is the lowest for CN-DNP in mixture (IV), also values of resonance energy show that the stability of CN-DPA complexes in both mixtures (I) and (II) are higher than the stability of CN-DNP complexes in acetonitrile (III) and mixture (IV), and the CN-DNP complexes prepared in mixture (IV) exhibit the lowest stability.
Optimization of reaction variables
The spectrophotometric properties of the colored species as well as the different parameters affecting the color development were extensively studied to determine the optimum conditions for the analytical determination of the drug. The reactions were studied as a function of the volume of the reagents, nature of the solvents, effect of temperature and effect of time on the formation of the complex. Stability of colors and the molar ratio were also studied.
Wavelength (nm)
300 350 400 450 500 550 600
A
bs
o
rba
nce
0.0 0.2 0.4 0.6 0.8 1.0
[1] [2]
[3] [4] [5]
Figure 2. Absorption spectra for CN-DPA complexes in different solvents, [CN] =5x10⁻⁵ mol L-1; at room temperature. (1) 15% (v/v) Dioxane in ethyl alcohol, (2) Dioxane, (3) Ethyl acetate, (4) 15% (v/v) Ethyl acetate in chloroform, and (5) 15% (v/v) Dioxane in dichloroethane.
9
4, 32 10 max 1/ 2 (1)
max 1/ 2
0, 0958 (2)
EN max
f
4 7.7 10
(3) max
/ 3.5
h CT RN
wavelength (nm)
300 350 400 450 500 550 600
Absorbance
0.0 0.1 0.2 0.3 0.4 0.5
[1]
[2] [3]
[4] [5]
[6]
Table 2. Spectral properties obtained for CN-DPA and CN-DNP charge-transfer complexes.
λCT - absorption maxima, εmax -molar absorptivity, RN - the resonance energy of the complex in the ground stat stoichiometry, f - the
oscillator strength, μEN - the transition dipole moment. I-15% dioxane :dichloroethane; II-15% ethyl acetate :chloroform; III-Acetonitrile; IV-30% dichloroethane: ethyl alc.
Effect of diluting solvent
Upon diluting the reaction solution with water, turbid solution with low color intensity was obtained indicating the incomplete solubility of CN-DPA or CN-DNP complexes in water. Therefore, water could not be used for dilution. In order to select the most appropriate solvent for diluting the reaction solution, different solvents were tested e.g. 1,4-dioxane, ethyl acetate, chloroform, acetone, acetonitrile, and mixture of these solvents with different proportions. The highest absorbance values were obtained when mixture of 15% dioxane in dichloroethane and pure acetonitrile were used as diluting solvents for CN-DPA and CN-DNP, respectively, Figs. 2 and 3.
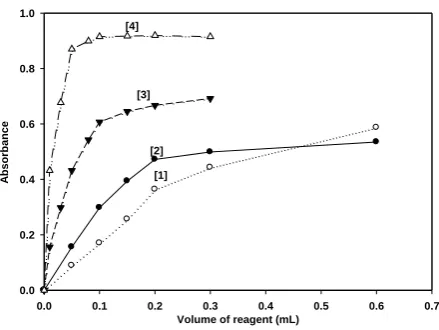
Effect of reagent concentration
The effect of the reagents concentration on the intensity of the color production was studied by adding various amounts of the reagents to a fixed concentration of CN (1.0×10⁻⁴ mol L-1). The results showed that, in case of
using DPA in both mixtures (I) and (II), maximum and constant absorbance values were obtained using reagent concentration at least three times that of CN. While, in using DNP in acetonitrile (III) and mixture (IV), the maximum reproducible absorbances were obtained by using reagent concentration at least six times that of CN, Fig. 4.
Effect of temperature
The effect of temperature on the reaction was studied by carrying out the reaction at temperatures between 25-70 °C. The results revealed that complete color development is obtained at room temperature up to 30 °C and absorbance values decrease with increasing the temperature of the reaction medium. The decrease in the absorbance values may be attributed to the instability of the reaction product at high temperature.
Figure 4. The effect of reagent concentration on the formation of the complexes. [CN] = 0.1×10⁻³ mol L-1, (1) DNP in 30% (v/v) dichloroethane in ethyl alcohol, 430 nm, (2) DNP in acetonitrile, 460 nm, (3) DPA in 15% (v/v) ethyl acetate inchloroform, 430 nm, and (4) DPA in 15% (v/v) dioxane in dichloroethane, 440 nm.
Effect of time
Under the above mentioned optimum conditions, the reaction between CN and DPA or DNP was completed immediately at 25±5 °C, and the absorbance no longer changes for standing up to 24 hours. The effect of time on the stability of the product was studied by following the absorbance intensity of the reaction solution (after dilution) at different time intervals. It was found that the absorbance of the product remains stable for at least 24 hours. This allows the processing of a large number of samples, and their comfortable measurements with convenience.
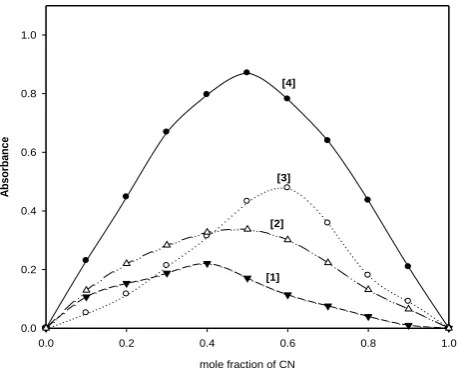
Stoichiometry of the reaction
Under the optimum conditions, the stoichiometry of the formed complexes was investigated using Job’s continuous variation and molar ratio methods.
Parameter Method
DPA DNP
I II III IV
λCT, nm 430 440 460 430
hνCT,eV 4.62 4.51 4.30 4.62
εmax, L mol−1cm−1 1.43×10⁴ 1.64×10⁴ 5.16×10³ 3.60×10³
Stoichiometry (drug:reagent) 1:1 2:1 1:1 1:2
RN (eV) 51.77×10⁻² 55.08×10⁻² 23.34×10⁻² 18.56×10⁻²
F 6.18×10⁻¹⁰ 7.08×10⁻¹⁰ 2.01×10⁻¹⁰ 1.09×10⁻¹⁰
µEN Depye 2.38×10⁻⁴ 2.57×10⁻⁴ 1.40×10⁻⁴ 9.97×10⁻⁴
Volume of reagent (mL)
0.0 0.1 0.2 0.3 0.4 0.5 0.6 0.7
A
bso
rb
ance
0.0 0.2 0.4 0.6 0.8 1.0
The results indicated that CN-DPA complex in mixture (I) and CN-DNP complex in acetonitrile (III) were formed in the ratio of 1:1. On the other hand, the ratio of the complexes DNP formed in mixture (IV) and CN-DPA formed in mixture (II) are 1:2 and 2:1 drug : reagent ratio, respectively. The results obtained were confirmed by elemental analysis for the solid charge-transfer complexes, Table 1. The results are shown in Figs. 5 and 6.
Figure 5. Continuous variation plots of CN-DPA and CN-DNP complexes; total molar concentration = 2×10⁻⁴ mol L-1. (1) DNP in 30% (v/v) dichloroethane in ethyl alcohol, 430 nm, (2) DNP in acetonitrile, 460 nm, (3) DPA in 15 % ( v/v) ethyl acetate in chloroform, 430 nm, and (4) DPA in 15% (v/v) dioxane in dichloroethane, 440 nm.
Figure 6. Molar ratio plots of CN-DPA and CN-DNP complexes. (1) DNP in 30% (v/v) dichloroethane in ethyl alcohol, 430 nm, (2) DNP in acetonitrile, 460 nm, (3) DPA in 15% (v/v) ethyl acetate in chloroform, 430 nm, and (4) DPA in 15% (v/v) dioxane in dichloroethane, 440 nm.
Association constants and standard free energy change
The association constants were calculated for 1:1 complexes using Benesi-Hildebrand24 equation (4):
where
AAD is the absorbance of the charge-transfer band,
AD is the molar absorptivity of the complex, [A0] and [D0] represent the initial acceptor and donor
concentrations, respectively, and
KCAD is the association constant for the
equilibrium.
Benesi-Hildebrand equations for 1:1 complexes of CN with DPA and DNP can be represented by equations 5 and 6, respectively.
The formation constants (Kf) of CN-DNP 1:2
ion-associate complexes formed in mixture (IV) and 2:1 CN-DPA complexes formed in mixture (II), were calculated, (Table 3) from the continuous variation data using the following equation25:
where
Am is the maximum absorbance obtained from Job’s
continuous variation curve,
A is the absorbance corresponding to the intersection of the two tangents of the continuous variation curve,
C is the concentration corresponding to maximum absorbance,
n is the ratio of the drug in the reaction product. The standard free energy change, ∆G° of the complex formation is related to the formation constant by the following equation 26:
0
2.303 lg (8)
G RT K
mole fraction of CN
0.0 0.2 0.4 0.6 0.8 1.0
A b s o rb a n c e 0.0 0.2 0.4 0.6 0.8 1.0 [1] [2] [3] [4]
1 1 1
0
(4)
AD AD AD
AD 0 C A D K
A
Drug: Reagent0 1 2 3
A b s o rb a n c e 0.0 0.2 0.4 0.6 0.8 1.0 [1] [2] [3] [4]
[ o] (4.9 10 5) (0.56 10 8) 1 (5)
AD [ o]
λ
[ o] (1.4 10 4) (0.27 10 7) 1 (6)
AD [ o]
λ A D A A D A (7) 1 1 A
Am n n
Kf C n
where
R is the universal gas constant (8.314 J mol-1 K-1),
T is the absolute temperature and
K is the formation constant of the CT complex. The obtained values of,AD, Kf and ΔG° for CN
charge-transfer complexes are presented in Table 3. It is clear from the obtained results that, these charge-transfer reactions are spontaneous as indicated by the negative values of ΔG° and the high values of Kf.
Validation of the methods
Calibration and sensitivity
Calibration curves for the determination of CN by its reaction with both DPA and DNP were constructed by plotting the absorbances as a function of the corresponding concentrations. The regression equations for the results were A=0.008+0.0425C (r=0.9970) and
A=0.0031+0.0371C (r=0.9996) with molar absorptivities (ε) 1.64×10⁴ and 1.43×10⁴ L mol−1 cm−1 for DPA-CN
complexes prepared in mixture (I) and mixture (II), respectively. The A = -0.0071 + 0.0101C (r = 0.9954) and
A = 0.0033 + 0.0143C (r=0.9996) with molar absorptivities (ε) 5.16×10³ and 3.60×10³ L mol−1 cm−1 for
DNP-CN complexes prepared in acetonitrile (III) and mixture (IV) were found, respectively, where A is the absorbance at λmax for each method, C is the
concentration of CN in µg mL-1, and r is the correlation
coefficient. Optimization of the linear range (Ringbom) was evaluated by plotting the percentage transmittance versus the logarithm of concentration (µg mL-1). The limit
of detection (LOD) and limit of quantification (LOQ) were determined according to the International
Conference of Harmonization (ICH) guidelines for validation of analytical procedures.27 The following
formula was used:
LOD or LOQ =K SDa, where K=3 for LOD and 10 for
LOQ, and SDa is the standard deviation of the intercept.
The values of LOD were 0.72 and 0.40, LOQ were 2.23 and 1.48 for CN-DPA in case of using 15% dioxane in dichloroethane and 15% ethyl acetate in chloroform, respectively. For CN-DNP LOD values were 0.54 and 2.08, and LOQ values were 2.35 and 5.27 in case of using acetonitrile and 30% dichloroethane in ethyl alcohol, respectively, Table 3.
Reproducibility
The reproducibility of the proposed methods was evaluated by replicate analysis of five separate solutions of the working standard at different concentration levels. The method gave satisfactory results; RSD did not exceed 2% indicating the good reproducibility of the proposed method. This precision level is adequate for routine analysis of the investigated drug in quality control laboratories.
Accuracy and interference liabilities
The accuracy of the proposed method was evaluated by the recovery studies for added concentrations. The recovery values were 98.77±0.9 – 100.00±1.1%, Table 4, indicating the accuracy of the proposed method. Interference liabilities of common excipients: starch, glucose, lactose, talc, and magnesium stearate were not necessary to be tested before proceeding with the analysis of CN in its dosage forms; the drug is extracted firstly by dissolving it in the appropriate solvent then filtering. The excipients are insoluble in such solvents.
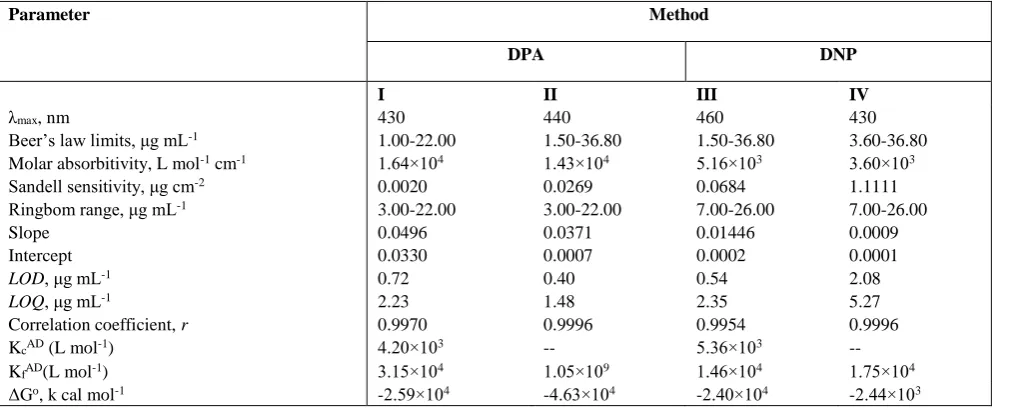
Table 3. Analytical parameters for CT complexes of cinnarizine with DPA and DNP.
Parameter Method
DPA DNP
I II III IV
λmax, nm 430 440 460 430
Beer’s law limits, μg mL-1 1.00-22.00 1.50-36.80 1.50-36.80 3.60-36.80
Molar absorbitivity, L mol-1 cm-1 1.64×10⁴ 1.43×10⁴ 5.16×10³ 3.60×10³
Sandell sensitivity, μg cm-2 0.0020 0.0269 0.0684 1.1111
Ringbom range, μg mL-1 3.00-22.00 3.00-22.00 7.00-26.00 7.00-26.00
Slope 0.0496 0.0371 0.01446 0.0009
Intercept 0.0330 0.0007 0.0002 0.0001
LOD, μg mL-1 0.72 0.40 0.54 2.08
LOQ, μg mL-1 2.23 1.48 2.35 5.27
Correlation coefficient, r 0.9970 0.9996 0.9954 0.9996
KcAD (L mol-1) 4.20×10³ -- 5.36×10³ --
KfAD(L mol-1) 3.15×10⁴ 1.05×10⁹ 1.46×10⁴ 1.75×10⁴
ΔGo, k cal mol-1 -2.59×10⁴ -4.63×10⁴ -2.40×10⁴ -2.44×10³
LOD: Limit of detection; LOQ: Limit of quantification; n=5; KcAD
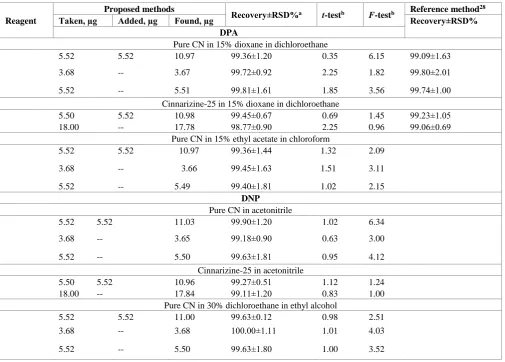
Table 4. Recovery studies for determination of CN in standard solutions and pharmaceutical formulation applying calibration curve and standard addition methods.
a.Mean ± relative standard deviation of five replicate analyses; b. Theoretical values for t- and F-tests are 2.77 and 6.39, respectively, for four degree of freedom and 95% confidence limit.
Robustness
Robustness was examined by evaluating the influence of small variation in the method variables on its analytical performance. In these experiments, the absorbances of the formed complex were determined at 5 minutes and at 15 minutes of the reaction time whereas the other conditions were kept unchanged. Similarly the temperature of the reaction was changed and the absorbance of the formed complex determined at 25 °C and 35 °C. The recovery percentage was calculated each time. It was found that small variation in the method variables did not significantly affect the procedures; recovery values were 97.90±1.95 – 100.50±1.02%, Table 5. This indicates the reliability of the proposed method during its routine application for the determination of cinnarizine.
Applications
The proposed methods were applied for the determination of Cinnarizine-25 tablets. Five replicate determinations were performed. Satisfactory results were obtained, Table 4. Moreover, to check the validity of the proposed methods, the standard addition method was applied by adding standard cinnarizine solution to a
previously analyzed tablet solution, and the recovery was calculated. The results of analysis of commercial dosage forms and the recovery study of the standard addition method of the cited drug reveals that the suggested methods give high recovery values.
For the sake of determining the accuracy and precision of the suggested methods, they were compared with a previously reported method.28 Statistical comparison of
the results was performed with regard to accuracy and precision using student’s t-test and F-test at 95% confidence level, Table 6. The results showed that there is no significant difference between the reported28 and
proposed methods with regard to accuracy and precision.
Conclusion
The suggested methods for the determination of cinnarizine by using dipicrylamine and 2,6-dinitrophenol have the advantages of being simple, accurate, sensitive, rapid and suitable for routine analysis in control laboratories. These methods utilize a single step reaction, and no substantial differences among the proposed methods arise from analysis of the experimental results.
Reagent
Proposed methods
Recovery±RSD%a t-testb F-testb Reference method 28
Taken, µg Added, µg Found, µg Recovery±RSD%
DPA
Pure CN in 15% dioxane in dichloroethane
5.52 5.52 10.97 99.36±1.20 0.35 6.15 99.09±1.63
3.68 -- 3.67 99.72±0.92 2.25 1.82 99.80±2.01
5.52 -- 5.51 99.81±1.61 1.85 3.56 99.74±1.00
Cinnarizine-25 in 15% dioxane in dichloroethane
5.50 5.52 10.98 99.45±0.67 0.69 1.45 99.23±1.05
18.00 -- 17.78 98.77±0.90 2.25 0.96 99.06±0.69
Pure CN in 15% ethyl acetate in chloroform
5.52 5.52 10.97 99.36±1.44 1.32 2.09
3.68 -- 3.66 99.45±1.63 1.51 3.11
5.52 -- 5.49 99.40±1.81 1.02 2.15
DNP Pure CN in acetonitrile
5.52 5.52 11.03 99.90±1.20 1.02 6.34
3.68 -- 3.65 99.18±0.90 0.63 3.00
5.52 -- 5.50 99.63±1.81 0.95 4.12
Cinnarizine-25 in acetonitrile
5.50 5.52 10.96 99.27±0.51 1.12 1.24
18.00 -- 17.84 99.11±1.20 0.83 1.00
Pure CN in 30% dichloroethane in ethyl alcohol
5.52 5.52 11.00 99.63±0.12 0.98 2.51
3.68 -- 3.68 100.00±1.11 1.01 4.03
Table 5. Influence of small variations in the assay conditions on the analytical performance of the proposed spectrophotometric method for determination of CN using DPA and DNP.
Methodb Recovery% ±SDa
Temperature Time
25 °C 35 °C 5 minutes 15 minutes
DPA method
I 99.15±1.02 100.10±0.84 100.02±0.99 100.50±1.02
II 98.20±0.98 98.15±1.01 100.50±1.02 98.21±0.96
DNP method
III 97.90±1.95 97.90±1.95 97.90±1.95 97.90±1.95
IV 98.80±1.35 99.01±0.89 98.23±1.01 99.56±0.99
a Values are the mean of 3 determinations; b At the optimum conditions; I: 15% dioxane in dichloroethane; II: 15% ethyl acetate in chloroform; III: Acetonitrile; IV: 30% dichloroethane in ethyl alcohol.
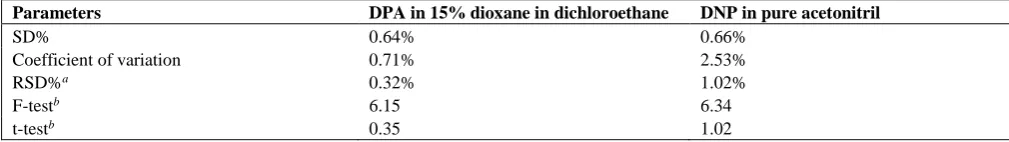
Table 6. Statistical tests for accuracy and precision of the proposed methods on samples of pure CN with DPA and DNP, at 95% confidence level and υ=4.
Parameters DPA in 15% dioxane in dichloroethane DNP in pure acetonitril
SD% 0.64% 0.66%
Coefficient of variation 0.71% 2.53%
RSD%a 0.32% 1.02%
F-testb 6.15 6.34
t-testb 0.35 1.02
a.Relative standard deviation of five replicate analyses; b. Theoretical values for t- and F-tests are 2.776 and 6.39, respectively, for four degree of freedom and 95% confidence level.
The complex formation of CN with DPA in mixture of 15% 1,4-dioxane in 1,2-dichloroethane is more sensitive than the other methods due to the higher molar absorptivity. These methods can be used precisely and accurately with high recovery ranged between 99.18±0.90 and 100.00±1.11, for the spectrophotometric determination of cinnarizine in the range of 1.00 - 36.80
g both in pure forms and in its pharmaceutical formulations.
References
1Rahaway,N. J., The Merk Index, an Encyclopedia of Chemicals, Drugs, and Biologicals, Merck, USA, 12th Edn. , 1996. 2Parfitt, K., Martindale, W., The complete drug reference, 32th
edn. Pharmaceutical Press, London, 1999, 411.
3British Pharmacopoeia Commission, British Pharmacopeia, vols. I and II. Her Majesty’s Stationery Office, London (through electronic version), 2003.
4Metwally, F. H., Elzeany, E. B. A. and Darwish, H. W., J AOAC Int., 2005, 88(6), 1666.
5Abdine, H., Belal, F. and Zoman, N., Il Farmaco, 2002, 57, 267.
6El-Gindy, A., Emara, S. and Hadad, G. M., Il Farmaco,2004, 59, 703.
7El-Gindy, A., Emara, S. and Mostafa, A., Il Farmaco, 2004, 59, 713.
8Xu, B. Z., Zhao, F. L. and Tong, S. Y., Guangpuxue-Yu-Guangpu-Fenxi, 1999, 19(6), 886.
9Hassan, S. S. M., Abdel-Aziz, R. M. and Abbas, A. B., Anal. Chim. Acta, 1996, 321(1), 47.
10Zeng, Y. H. and Sun, H. Y., Fenxi-Huaxue, 1993, 21, 1185. 11De Steene, J. C. V., Mortier, K. A. and Lambert, W. E., J
Chromatogr., 2006, 1123, 71.
12Hassan, S. S. M., Elmosallamy, M. A. F. and Abbas, A. B., J. Pharm. Biomed. Anal., 2002, 28(3-4), 711.
13Rosseel, M. T. and Lefebvre, R. A., Chromatographia, 1993, 36(1), 356.
14Sane, R. T., Sahasrabudhe, S. P., Nayak, V. G., Ladage, K. D., Kothurkar, R. M. and Nayak, V. G., Indian Drugs, 1989, 26(9), 491.
15Xie, X. T., Wu, G. L. and Liu, C. H., Sepu, 1993, 11, 315. 16Abdelal, A. A., Kitagawa, S., Ohtani, H., El-Enany, N., Belal,
F. and Walash, M. I., Pharm. Biomed., 2008, 46(3), 491. 17El-Sayed, G. O., Yasin, S. A. and El-Badawy, A. A., Anal.
Lett., 2008, 41(17), 3021.
18Job, P., Ann. Chem., 1936, 16, 97; Job, P., Advanced physicochemical experiments, 2nd Edn., Edinburgh, Oliner and Boyd, 1964, 54.
19Yoe, J. H. and Jones, A. L., Ind.. Eng. Chem. Anal. Ed., 1944, 16(14), 111.
20Lever., A.B.P., Inorganic Electronic Spectroscopy, 2nd Edn., Elsevier, Amsterdam., 1985, 166.
22Pandeeswaran, M. and Elango, K.P., Spectrochim. Acta A., 2006, 65, 1148.
23Briegleb, G. and Czekalla, J., Z. Phys. Chem. (Frankfurt), 1960, 24, 37
24Bensi, H. A. and Hildbrand, J. H., J. Am. Chem. Soc., 1949, 71, 2703.
25Inczedy, J., Analytical application of complex equilibra, John Wiley, Budapest, 1976.
26Martin, A. N., Swarbrick, J. and Cammarata, A., Physical Pharmacy, 3rd Edn., Lea and Febiger, Philadelphia USA, 1983, 344.
27ICH Guideline, Q2 (R1), Validation of analytical procedures: Text and methodology, London, 2005.
28Feng-lin, Z., Bian-Zhen, X., Zhi-Quan, T. and Shen-Yang, Z., J. Pharm. Biomed. Anal., 1999, 21(2), 355.

![Figure 2. Absorption spectra for CN-DPA complexes in different solvents, [CN] =5x10⁻⁵ mol L-1; at room temperature](https://thumb-us.123doks.com/thumbv2/123dok_us/7836206.2090151/3.595.56.260.222.391/figure-absorption-spectra-dpa-complexes-different-solvents-temperature.webp)