Spiral Flow Tube for Contrast Medium
Reduction in Coronary CT Angiography
Nobuo Tomizawa
1, Yayoi Hayakawa
1, Shinichi Inoh
1, Takeshi Nojo
1, Satoshi Uemura
2,
Sunao Nakamura
3.
1. Department of Radiology, New Tokyo Hospital, 1271 Wanagaya, Matsudo, Chiba, Japan, 270-2232 2. Sales Division, Nemoto Kyorindo, 2-7-20 Hongo, Bunkyo-ku, Tokyo, Japan, 113-0033
3. Department of Cardiology, New Tokyo Hospital, 1271 Wanagaya, Matsudo, Chiba, Japan, 270-2232
Corresponding author:
Nobuo Tomizawa
Department of Radiology, New Tokyo Hospital,1271 Wanagaya, Matsudo, Chiba, JAPAN, 270-2232 E-mail: [email protected]
Introduction
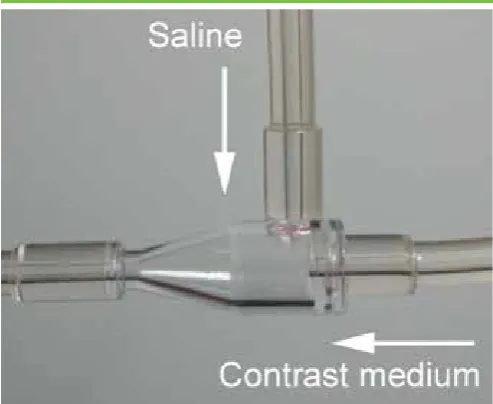
Coronary computed tomography (CT) angiography is an established method for identifying the presence and severity of coronary artery disease [1]. The amount of contrast medium should be kept as low as possible to prevent contrast-induced nephropathy [2] without the expense of diagnostic performance. Injection of a saline solution immediately after bolus injection of contrast material allows reduction of contrast medium while maintaining the enhancement of coronary arteries [3]. Recently, spiral flow tube has become available for saline flush (Fig 1). Spiral flow is generated at the chamber-shaped connecting site, hence saline solution would push the contrast medium more effectively than the conventional T-shaped tube [4-6]. Previous studies showed that the spiral flow tube significantly
increased the arterial enhancement of abdominal aorta [4], aorta of the lower extremities [5] and coronary arteries [6] than the T-shaped tube. However, it is not clear whether the spiral flow tube could maintain the arterial enhancement and diagnostic performance with reduced contrast medium injection.
The purpose of the present study was to assess the diagnostic performance of coronary CT angiography with reduced contrast medium dose using the spiral flow tube compared with the conventional T-shaped tube. We also investigated the difference in coronary enhancement between the two different tubes.
* Corresponding author. E-mail: [email protected]
Highlights
Background
To assess the diagnostic performance and enhancement of coronary CT with reduced contrast medium using the spiral flow tube compared with the T-shaped tube.
Methods
We retrospectively included 444 patients who underwent catheter examination within 2 months after coronary CT. The first 222 patients received 21.0 mgI/kg/s of contrast medium using the T-shaped tube and the injected contrast medium was reduced by 6% (19.8 mgI/kg/s) in the last 222 patients using the spiral flow tube. We compared the per vessel diagnostic performance for detecting obstructive stenosis (≥50%) by catheter examination and the enhancement of proximal coronary arteries.
Results
The sensitivity, specificity, positive predictive value, negative predictive value and accuracy was 96%, 84%, 72%, 98% and 87% using the spiral flow tube and 93%, 83%, 68%, 97% and 86% using the T-shaped tube, respectively, without significance. The enhancement of left main (spiral flow vs T-shape, 407 ± 53 vs 407 ± 62 HU, p = 0.95) and right coronary (419 ± 58 vs 415 ± 61 HU, p = 0.49) arteries did not show significant difference.
Conclusions
The spiral flow tube would maintain the diagnostic performance and coronary enhancement with reduced contrast medium compared with the T-shaped tube.
Keywords: Coronary CT angiography; coronary enhancement; image quality; saline flush; spiral flow tube
Citation: Tomizawa N, Hayakawa Y, Inoh S, et al. Spiral Flow Tube for Contrast Medium Reduction in Coronary CT Angiography. International Cardiovascular Forum Journal 2016;9:15-20 DOI 10.17987/icfj.v9i0.375
Materials and Methods
This retrospective study was approved by the local ethics committee, and the requirement for informed consent to participate in this study was waived.
Patients
The spiral flow tube (Nemoto spiral flow; Nemoto Kyorindo, Tokyo, Japan) became available at our institution in March, 2015. We initially did not change the injection protocol during April, 2015 (21.0 mgI/kg/s). Since the enhancement of coronary arteries increased by about 30 HU (data not shown), we estimated that 6% reduction in contrast medium dose (19.8 mgI/kg/s) would maintain an optimal enhancement for the diagnosis of coronary arteries. Thus, we reduced the injection dose to 19.8 mgI/kg/s from May 2015.
We retrospectively included patients from October 2014 to December 2015 who underwent catheter examination because obstructive coronary artery disease was suspected by coronary CT within 2 months after the CT exam. We excluded patients who underwent coronary CT with standard contrast medium dose using the spiral flow tube in April 2015. A total of 455 patients were initially eligible (227 patients with T-shaped tube and 228 patients with spiral flow tube). The exclusion criteria were as follows: post coronary artery bypass surgery (n = 5), suboptimal image quality due to breathing during the exam (n = 3), subcutaneous contrast medium extravasation (n = 3) and protocol deviation due to simultaneous pulmonary embolism evaluation (n = 1). The final study group consisted of 444 patients; the first 222 patients used the conventional T-shaped tube (Top injector tube; Top, Tokyo, Japan) and the last 222 patients used the spiral flow tube.
CT data acquisition
All patients underwent CT angiography with a 64-row CT (Brilliance 64; Philips, Tokyo, Japan). Each patient first underwent unenhanced prospectively electrocardiogram-gated axial scan with 120 kVp, 196 mA and 2.5 mm collimation for calcium scoring. Images were obtained at 40% or 70% of the R-R interval depending on the heart rate and were reconstructed with a slice
thickness of 2.5 mm and increment of 2.5 mm. Coronary CT angiography was performed by retrospectively electrocardiogram-gated helical scan. The scanning parameters were as follows: detector configuration, 64×0.625 mm; tube potential, 120 kVp; tube current-time product, 800-1050 mAs, depending on the body weight; gantry rotation time, 420 ms; and helical pitch, 0.2.
A 20- or 22-gauge catheter was placed at the right antecubital vein. The patients using the T-shaped tube received 21.0 mgI/ kg/s and the patients using the spiral flow tube received 19.8 mgI/kg/s of iopamidol 370 mgI/mL (Iopamiron 370; Bayer, Osaka, Japan). Contrast medium was injected for acquisition duration plus 7 s, followed by a 30 mL saline flush. Bolus tracking method was performed to determine the scan timing. The scan started 6 s after the descending aorta reached 100 Hounsfield unit (HU). Figure 1. The chamber at the connecting site generates a
spiral flow which allows saline chaser to effectively push contrast medium.
Figure 2. Surface maximal intensity projection image (a,c) and curved planar reformat (b,d) of repeated coronary CT angiography of a patient with angina. The injection speed reduced from 3.4 mL/s to 3.2 mL/s and the injected contrast medium reduced from 60 mL to 55 mL in the second CT exam. Plaque progression was suspected at mid left anterior descending (c,d arrows) and the patient underwent coronary angiography followed by stent implantation (e).
Figure 3. Forest plot showing pre-specified subgroup analysis comparing spiral flow tube and T-shaped tube for per vessel accuracy. Error bars indicate 95% confidence interval.
Patients with heart rate >65 beats per minute at the outpatient department were told to take an oral β-blocker (20 mg of metoprolol) 1 h prior to CT angiography. If the heart rate was >65 beats per minute on site, as much as 12.5 mg of landiolol (Corebeta; Ono Pharmaceutical, Tokyo, Japan) was given intravenously. All patients received 0.3 mg of sublingual nitroglycerin (Nitropen; Nippon Kayaku, Tokyo, Japan) before imaging.
For each patient, a senior technologist determined the phase with minimum artifacts at the CT console. Multiple phases were reconstructed when artifacts remained in the image. The reconstructed slice thickness was 0.67 mm, and the increment was 0.33 mm. Images were reconstructed using a cardiac sharp kernel. For processing, images were transferred to a workstation (Syanpse Vincent; Fuji Medical, Tokyo, Japan).
Image analysis of coronary CT angiography
Calcified lesions with a minimum area of three pixels and a minimum CT number of 130 HU were scored by using an algorithm developed by Agatston et al [7]. Lesion scores from the left main trunk (LMT), left anterior descending (LAD), left circumflex (LCX) and right coronary arteries (RCA) were summed to determine a total calcium score. Calcium scoring analysis was not performed in patients with stent implantation.
The Society of Cardiovascular Computed Tomography 18-segment classification was applied for analysis of CT angiography data [8]. All segments with a diameter of at least 1.5 mm at their origin were included. Vessels distal to total occlusions were excluded. The reconstructed images were evaluated and classified by two cardiovascular radiologists. Anatomically obstructive coronary artery disease was defined as ≥50% stenosis.
In order to measure the coronary enhancement, regions of interest (ROIs) at the LMT and the proximal RCA were drawn on a cross-sectional image of the vessel lumen. The average CT number (in HU) was recorded for each ROI. The ROI was chosen to be as large as possible while carefully avoiding the inclusion of the vessel wall to prevent partial volume effects. An ROI was also placed on the aortic root, and the standard deviation of this ROI was defined as image noise. The signal-to-noise ratio (SNR) was calculated as the CT number of the lumen divided by the image noise. The images were presented in random order and evaluation was performed blinded to the type of the tube used.
Invasive coronary angiography
Left and right coronary angiography was performed according to standard techniques. A minimum of 8 projections were obtained (minimum of 3 views for the right coronary artery system and minimum of 5 views for the left coronary artery system). Angiograms were assessed by an experienced cardiologist and a radiologist blinded to the results of CT. The same classification for CT angiography was applied for analysis [8]. Each segment was visually evaluated for the presence of significant stenosis by determining the presence of ≥50% luminal diameter reduction with most severe luminal narrowing.
Statistical analysis
Continuous variables were shown as mean ± standard deviation and categorical variables as number unless otherwise described.
The Student’s t test was used to compare continuous variables. The Fisher’s exact test or Chi-square test was used to compare categorical variables.
Diagnostic performance was evaluated on per segment, per vessel (RCA, LMT, LAD and LCX) and per patient basis. The primary endpoint of this study was per vessel accuracy which was estimated to be 85%. To detect a 5% difference in accuracy, the minimum sample size was calculated as 857
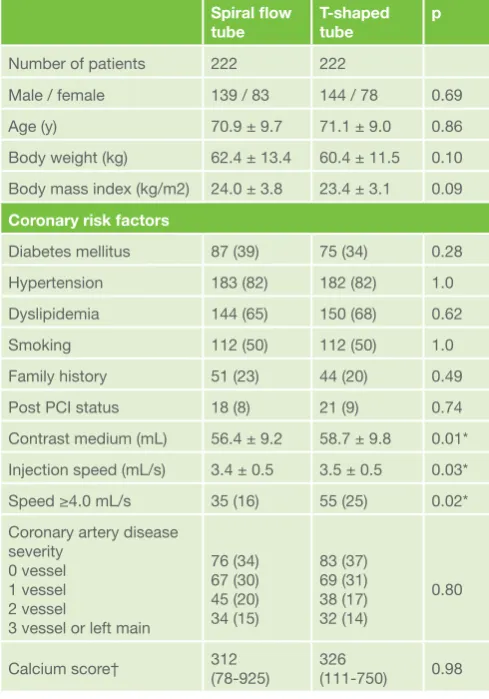
Table 1. Patient demographics and scanning parameters Spiral flow
tube T-shaped tube p
Number of patients 222 222
Male / female 139 / 83 144 / 78 0.69
Age (y) 70.9 ± 9.7 71.1 ± 9.0 0.86
Body weight (kg) 62.4 ± 13.4 60.4 ± 11.5 0.10 Body mass index (kg/m2) 24.0 ± 3.8 23.4 ± 3.1 0.09 Coronary risk factors
Diabetes mellitus 87 (39) 75 (34) 0.28
Hypertension 183 (82) 182 (82) 1.0
Dyslipidemia 144 (65) 150 (68) 0.62
Smoking 112 (50) 112 (50) 1.0
Family history 51 (23) 44 (20) 0.49
Post PCI status 18 (8) 21 (9) 0.74
Contrast medium (mL) 56.4 ± 9.2 58.7 ± 9.8 0.01* Injection speed (mL/s) 3.4 ± 0.5 3.5 ± 0.5 0.03*
Speed ≥4.0 mL/s 35 (16) 55 (25) 0.02*
Coronary artery disease severity
0 vessel 1 vessel 2 vessel
3 vessel or left main
76 (34) 67 (30) 45 (20) 34 (15)
83 (37) 69 (31) 38 (17) 32 (14)
0.80
Calcium score† 312 (78-925) 326 (111-750) 0.98 Numbers are reported as average ± standard deviation or N (%) unless otherwise described.
Bpm, beats per minute; PCI, percutaneous coronary intervention * statistically significant, p<0.05
† Median (interquartile range)
Table 2. Coronary artery attenuation and SNR
Spiral flow tube T-shaped tube P Attenuation (HU)
LMT 407 ± 53 407 ± 62 0.95
RCA 419 ± 58 415 ± 61 0.49
Image noise 31.2 ± 7.4 30.6 ± 6.9 0.40 SNR
LMT 13.7 ± 3.3 14.0 ± 3.9 0.37
RCA 14.1 ± 3.4 14.3 ± 4.0 0.63
Numbers are reported as average ± standard deviation.
vessels (approximately 215 patients) at 0.80 power. Sample size calculations were based on a type 2 error (α = 0.05). Pre-specified subgroup analysis was performed using logistic regression analysis to assess the relationship between tube type and per vessel accuracy.
Power analysis was performed using GPower (version 3.1.9.2; Dusseldorf, Germany). The remaining analyses were performed using JMP software (version 12.0.1; SAS, Cary, NC). A p-value <0.05 was deemed to indicate significance.
Results
The patient demographics and coronary risk factors showed no significant difference between the two groups (Table 1). The proportion of patients with a history of percutaneous coronary intervention was also similar between the groups. The reduction of contrast medium volume and injection speed was lower than initially estimated because patients using the spiral flow tube were slightly heavier. Spiral flow tube significantly decreased the proportion of patients with an injection speed ≥4.0 mL/s by 36% (p = 0.02).
Coronary enhancement
The attenuation of LMT and proximal RCA did not differ despite the lower contrast medium dose in the spiral flow tube group (Table 2). The image noise was comparable between the groups, thus the SNR showed no significant difference.
Diagnostic performance
The average interval between CT and catheter examination was 16 days. The prevalence of obstructive coronary artery disease was 66% and 63% in the spiral flow tube group and the T-shaped tube group, respectively. The severity of coronary artery disease and the calcium score did not differ between the groups (Table 1).
Among 3996 (222×18) total segments, 413 and 442 segments in the spiral flow tube group and the T-shaped tube group, respectively, were considered to be non-evaluable because the segments were small (<1.5 mm; 95 and 108 segments, respectively) or absent (318 and 334 segments, respectively). The per segment positive predictive value was slightly higher in the spiral flow tube group, but the sensitivity, specificity, negative predictive value and accuracy showed no significant difference (Table 3).
The diagnostic performance in per vessel analysis showed no significant difference between the groups (Table 4). The difference in accuracy was 1.5% (95% confidence interval −3.0 to 6.0%). Non-inferiority of diagnostic performance in the spiral flow tube group was proved because the lower limit did not cross the pre-specified endpoint of 5%. The achieved power was 0.81.
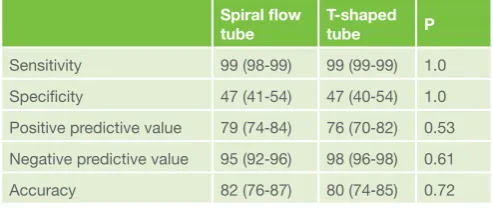
Per patient accuracy was about 80% in both groups without significant difference (Table 5). A total of 3 patients (2 and 1 patients in the spiral flow and T-tube group, respectively) resulted in false negative due to underestimation of LAD disease. These patients were scheduled for coronary angiography because the referring physician suspected coronary artery disease due to angina symptoms and abnormal electrocardiogram. A total of 83 patients (39 and 44 patients in the spiral flow and T-tube group, respectively) resulted in false positive. The median and average calcium score was 249 and 475, respectively, in these patients.
Figure 2 shows a patient who underwent repeated coronary CT with angina symptoms. The first exam was performed using the T-shaped tube with an injection speed of 3.4 mL/s (Fig 2a,b). The injection speed was reduced to 3.2 mL/s in the second exam using the spiral flow tube and LAD plaque progression was suspected (Fig 2c,d). The attenuation of proximal RCA was 391 and 392 HU, respectively, and that of LMT was 403 and 412 HU, respectively. Coronary angiography depicted obstructive disease in mid LAD (Fig 2e) and percutaneous coronary intervention was performed.
Subgroup analysis for per vessel accuracy
Stratified analysis of per vessel accuracy across different patient subgroups revealed that younger patients (≤ 72 y) resulted in better accuracy with the spiral flow tube (Fig 3, p = 0.0008). Although not significant, male and heavier (>60 kg) patients resulted in better accuracy using the spiral flow tube. Younger patients were more obese than older patients (65.6 ± 13.2 vs 57.2 ± 10.2 kg, p <0.0001), thus the image noise was stronger (32.0 ± 7.5 vs 30.0 ± 6.6, p = 0.001).
Table 3. Per segment diagnostic performance Spiral flow
tube T-shaped tube P
Sensitivity 91 (90‒92) 88 (86‒89) 0.13
Specificity 92 (91‒93) 92 (91‒93) 0.31
Positive predictive value 61 (59‒63) 54 (52‒56) 0.02* Negative predictive value 99 (98‒99) 99 (97‒99) 0.51
Accuracy 92 (91‒93) 91 (90‒92) 0.15
Numbers in parenthesis are 95% confidence interval. * Statistically significant, p <0.05
Table 4. Per vessel diagnostic performance Spiral flow
tube T-shaped tube P Sensitivity 96 (94‒97) 93 (92‒95) 0.34 Specificity 84 (82‒86) 83 (81‒86) 0.71 Positive predictive value 72 (69‒75) 68 (65‒71) 0.28 Negative predictive value 98 (96‒99) 97 (95‒98) 0.57
Accuracy 87 (85‒90) 86 (84‒88) 0.37
Numbers in parenthesis are 95% confidence interval.
Table 5 Per patient diagnostic performance Spiral flow
tube T-shaped tube P Sensitivity 99 (98‒99) 99 (99‒99) 1.0 Specificity 47 (41‒54) 47 (40‒54) 1.0 Positive predictive value 79 (74‒84) 76 (70‒82) 0.53 Negative predictive value 95 (92‒96) 98 (96‒98) 0.61
Accuracy 82 (76‒87) 80 (74‒85) 0.72
Discussion
The present study showed that the diagnostic performance of coronary CT angiography would be maintained using the spiral flow tube with 6% reduced contrast medium dose. Subgroup analysis showed that the spiral flow tube might improve the diagnostic performance in obese patients. Although the reduced amount of contrast was small, the proportion of patients with an injection speed ≥4.0 mL/s reduced by 36%. The decrease in injection speed would be protective for subcutaneous extravasation of contrast medium [9].
Experimental studies of pneumatic conveying system showed that spiral flow would convey particles more effectively than laminar flow in a vertical [10] and horizontal [11] pipeline. A phantom study by Kidoh et al [4] resulted that the spiral flow tube would increase the peak enhancement by 20% than the T-shaped tube. In vivo studies showed that the enhancement of abdominal aorta during hepatic arterial phase [4], arteries of lower extremities [5] and coronary arteries [6] increased by 30 to 50 HU using the spiral flow tube. However, the increase in the enhancement was attenuated during portal venous phase [4]. These results suggest that small amount of contrast medium might remain in the subclavian vein even when saline flush is performed using the T-shaped tube and the spiral flow tube might push the residual contrast medium into the central venous system. However, further research is necessary to clarify the mechanism of the increase in enhancement using the spiral flow tube.
Saline flush has been used to reduce the contrast medium dose while maintaining the enhancement of the aorta [12-14] and iliac arteries [15]. Saline flush is also used in coronary CT angiography to increase the coronary enhancement [3]. The results of the present study confirms that further reduction of contrast medium is feasible using the spiral flow tube with preserved image quality and diagnostic performance. This would be beneficial to reduce contrast induced nephropathy [2].
Cademartiri et al [16] investigated the relationship of coronary enhancement and diagnostic accuracy of coronary CT using 64-row CT. They concluded that the sensitivity and specificity was better in patients with higher coronary enhancement (>326 HU) compared with the remaining patients. The average coronary enhancement of the higher enhancement group was just below 400 HU which was comparable to the average coronary enhancement of the present study. We believe that the contrast medium dosage of 19.8 mgI/kg/s would be feasible for coronary CT using 64-row CT and further reduction in contrast medium dose might result in poorer diagnostic accuracy. Improving the depiction of calcified segments would reduce false positives and further increase the diagnostic accuracy. Latest generation of iterative reconstruction with a higher spatial resolution than filtered back projection reconstruction would be a promising method [17].
Our study had several limitations. This was not a prospectively randomized study, hence there might be some unknown bias between the groups. We performed a retrospective study because it was difficult to know in advance which patients would be candidates for subsequent coronary angiography. The patient demographics and coronary risk factors were
similar in both groups, thus we believe that the results in the present study would be robust. Secondly, although we excluded patients with an interval between CT and catheter examination over 2 months, coronary artery disease might have progressed during the interval. The average interval was 16 days and no patients suffered from cardiac events during this period. We believe that this interval would have little effect on the diagnostic accuracy of CT angiography. Thirdly, the specificity and positive predictive value of this study was quite low. The median calcium score of false positive patients was 249. Patients with intense calcification have obstructive disease, but it was quite difficult to rule out patients with moderately calcified lesions.
Conclusions
Diagnostic accuracy and coronary enhancement would be maintained with reduced dose of contrast medium using the spiral flow tube compared with standard dose of contrast medium using the T-shaped tube. The novel tube would help to further reduce the amount of contrast medium during coronary CT angiography.
Declarations of Interest
This research did not receive any specific grant from funding agencies in the public, commercial, or not-for-profit sectors. One author (SU) is an employee of Nemoto Kyorido.
Acknowledgements
The authors state that they abide by the “Requirements for Ethical Publishing in Biomedical Journals” [18].
References
1. Miller JM, Rochitte CE, Dewey M, et al. Diagnostic performance of coronary angiography by 64-row CT. N Eng J Med 2008;359:2324-2336. DOI: 10.1056/NEJMoa0806576
2. Solomon R. The role of osmolality in the incidence of contrast-induced nephropathy: a systematic review of angiographic contrast media in high risk patients. Kidney Int 2005;68:2256-2263. DOI: 10.1111/j.1523-1755.2005.00684.x
3. Kim DJ, Kim TH, Kim SJ, et al. Saline flush effect for enhancement of aorta and coronary arteries at multidetector CT coronary angiography. Radiology 2008;246:110-115. DOI: 10.1148/radiol.2453061953
4. Kidoh M, Nakaura T, Awai K, et al. Novel connecting tube for saline chaser in contrast-enhanced CT: the effect of spiral flow of saline on contrast enhancement. Eur Radiol 2013;23:3213-3218. DOI: 10.1007/ s00330-013-2923-x
5. Masuda T, Funama Y, Nakaura T, et al. Delivenng the saline chaser via a spiral flow-generating tube improves arteriaI enhancement for computed tomography angiography of the lower extremities. J Comput Assist Tomogr 2015;39:962-968. DOI: 10.1097/RCT.0000000000000292
6. Tomizawa N, Hayakawa Y, Inoh S, et al. Spiral flow tube for saline flush in coronary CT angiography: Initial experience. Int J Radiol 2016;3:56-60. DOI: 10.17554/j.issn.2313-3406.2016.03.31
7. Agatston AS, Janowitz WR, Hildner FJ, et al. Quantification of coronary artery calcium using ultrafast computed tomography. J Am Coll Cardiol 1990;15:827-832.
8. Raff GL, Abidov A, Achenbach S, et al. SCCT guidelines for the interpretation and reporting of coronary computed tomographic angiography. J Cardiovasc Comput Tomogr 2009;3:122-136. DOI: 10.1016/j.jcct.2009.01.001 9. Alami Z, Nasri S, Ahid S, Kacem HH. Extravasation of contrast medium
during CT examination: an observational case-control study. Pan Afr Med J 2015 doi: 10.11604/pamj.2015.20.89.3276. DOI: 10.11604/ pamj.2015.20.89.3276
10. Li H, Tomita Y. An experimental study of swirling flow pneumatic conveying system in a vertical pipeline. J Fluid Eng 1998;118:526-530.
11. Li H, Tomita Y. An experimental study of swirling flow pneumatic conveying system in a horizontal pipeline. J Fluid Eng 1996;118:526-530.
13. Dorio PJ, Lee FT Jr, Henseler KP, et al. Using a saline chaser to decrease contrast media in abdominal CT. Am J Roentgenol 2003;180:929-934. DOI: 10.2214/ajr.180.4.1800929
14. Utsunomiya D, Awai K, Tamura Y, et al. 16-MDCT aortography with a low-dose contrast material protocol. Am J Roentgenol 2006;186:374-378. DOI: 10.2214/AJR.04.1459
15. Kubo S, Tadamura E, Yamamuro M, et al. Thoracoabdominal-aortoiliac MDCT angiography using reduced dose of contrast material. Am J Roentgenol 2006;187:548-554. DOI: 10.2214/AJR.05.0309
16. Cademartiri F, Maffei E, Palumbo AA, et al. Influence of intra-coronary enhancement on diagnostic accuracy with 64-slice CT coronary angiography. Eur Radiol 2008;18:576-583. DOI: 10.1007/s00330-007-0773-0
17. Puchner SB, Ferencik M, Maurovich-Horvat P, et al. Iterative image reconstruction algorithms in coronary CT angiography improve the detection of lipid-core plaque--a comparison with histology. Eur Radiol 2015;25:15-23. DOI: 10.1007/s00330-014-3404-6