Esophageal transit study using a sliding sum
image: application to patients with probable
and definite systemic sclerosis
著者
Nakajima Kenichi, Hasegawa Minoru, Inaki Anri,
Wakabayashi Hiroshi, Hosoya Tetsuo, Takahara
Kazuhiko, Kinuya Seigo
journal or
publication title
Annals of Nuclear Medicine
volume
25
number
5
page range
325-331
year
2011-06-01
URL
http://hdl.handle.net/2297/26251
doi: 10.1007/s12149-011-0465-3Accepted for publication in Ann Nucl Med 2011
Esophageal transit study using a sliding sum image:
Application to patients with probable and definite systemic sclerosis
Kenichi Nakajima (1), Minoru Hasegawa (2), Anri Inaki (1), Hiroshi Wakabayashi (1), Tetsuo Hosoya (3), Kazuhiko Takehara (2), Seigo Kinuya (1)
(1) Department of Nuclear Medicine, Kanazawa University Hospital, Kanazawa, Japan (2) Department of Dermatology, Kanazawa University Hospital, Kanazawa, Japan (3) Fujifilm RI Pharma, Co. Ltd., Tokyo, Japan
Correspondence:
Kenichi Nakajima, MD, Department of Nuclear Medicine, Kanazawa University Hospital 13-1 Takara-machi, Kanazawa, ZIP 920-8641, Japan
e mail: [email protected] Pub Med http://www.ncbi.nlm.nih.gov/pubmed/21243540 Springer http://www.springerlink.com/content/a36261840x065lq3/ Abstract Purpose
Esophageal complication is common in systemic sclerosis (SSc), but scintigraphic transit patterns based on each subtype have not been understood well. The aim of this study was to develop a new algorithm for integrating a dynamic esophageal transit study and to apply the method to patients with SSc.
Methods
A total of 40 patients suspected of having SSc were examined by a dynamic esophageal transit study. The subtypes included 32 with definite SSc (15 limited cutaneous type and 17 diffuse cutaneous type) and 8 with probable SSc. The serial esophageal images were shifted and summed to a functional image (sliding sum image) and compared to a conventional condensed image analysis. Esophageal retention fraction at 90 seconds (R90) and half time (T1/2) of transit were also
measured.
Results
The four patterns of the sliding sum image and condensed image agreed in all patients. Abnormal retention patterns were observed in none of the 8 (0%) patients with the probable SSc and in 15 of 32 (47%) patients with definite SSc (p=0.014). The severity of scleroderma assessed by modified Rodnan skin thickness score correlated with that of esophageal retention R90 (p=0.04).
Conclusion
The sliding sum image is a simple and effective method for integrating esophageal transit. Patients with definite SSc and severe scleroderma had significantly higher retention patterns, while probable SSc patients showed no esophageal dysmotility.
Key Words Esophageal transit study, functional imaging, sliding sum image, condensed image, systemic sclerosis
Introduction
Dynamic esophageal transit scintigraphy is a diagnostic procedure to evaluate esophageal functional abnormalities of motility or peristalsis. It is a unique method to visualize physiologic passage of foods. The usefulness of an esophageal transit study has been documented in patients with achalasia, esophageal spasm, systemic sclerosis and other motility disorders. To evaluate functional abnormality of the esophagus, several methods have been clinically used, which include a cinematic display of dynamic images and analysis of time-activity curves by setting regions of interest (ROIs) on the esophagus [1, 2]. As an method of functional imaging, a condensed image has been used to summarize transit using space-time axes [3-6]. The quantitative method for radionuclide esophageal transit, however, seems to be underutilized compared with its reported usefulness. In this study, we developed a simpler algorithm that utilizes addition of successively shifted images into a functional image.
Systemic sclerosis (SSc) is a
generalized disease involving multiple organs [7, 8]. In digestive complications,
gastroesophageal reflux disease (GERD) symptoms and dysmotility of esophagus are more commonly observed, in comparison to gastric and intestinal complications. Some studies have utilized a radionuclide esophageal transit study in patients with SSc [1, 6, 9-13]. A reliable but simple non-invasive method for quantifying esophageal transit would
contribute to early diagnosis, treatment and follow-up of esophageal involvement [6, 12, 13].
The purpose of this study is to develop an algorithm of a sliding sum image and to compare the results with the conventional condensed image analysis. The incidence of abnormal image patterns was also analysed in subtypes of probable and definite systemic sclerosis.
Method
Subjects
Forty patients aged 53±16 (mean ± SD) years (range 12-81 years old; 37 females and 3 males) suspected of having SSc were studied. The diagnosis was made in the Department of Dermatology based on American Rheumatism Association diagnostic criteria. The
classification into diffuse and limited
cutaneous SSc types (dcSSc, lcSSc) was based on skin lesions according to LeRoy et al. [14], and other clinical findings and laboratory data were also evaluated. In addition to the typical classification into lcSSc and dcSSc, a probable or limited subset of SSc was diagnosed for those who had no skin involvement but instead had serological autoantibodies and clinical findings of Raynaud's phenomenon, abnormal nail-fold capillaroscopy (consisting of dilation and/or avascular areas) and swollen fingers [15, 16]. The severity of scleroderma was scored from 0 (normal) to 3 (severe) in 17 body surface areas using a pinching method. Each skin thickness score was summed, and a modified Rodnan total skin thickness score (MRSS) was calculated [17, 18]. In this study group, the total skin score ranged from 0 to 29 with a mean of 8 ± 9 (SD). The number of patients based on final classification was 15 with lcSSc, 17 with dSSc, and 8 were diagnosed with probable SSc. The probable SSc patients showed antibodies of
anti-centromere antibody (n=5), and the remaining patients had anti-ribonucleic acid polymerase, ribonucleic protein (U1-RNP) and anti-nuclear antibodies. The esophageal transit study in SSc patients was approved by institutional ethical committee of Kanazawa University, and written informed consents were obtained in all patients.
Esophageal transit study
An esophageal transit study was
performed as described [11, 19]. The study was performed under fasting condition for at least 6 hours, and current medications that may alter esophageal transit were documented. 99m
was mixed with a semi-liquid enteral feeding formula (Racol, Otsuka Pharmaceutical
Company Ltd, Japan), which included 200 kcal with 8.76 g of protein, 4.46 g of lipids, and 31.24 g of carbohydrates in addition to vitamins and minerals per 200 mL. Patients were instructed to retain 7–10 mL in their mouth, in which 10 MBq of 99mTc was mixed, and to swallow it in one gulp. After 30
seconds, the patients repeated dry swallows during each 15-second interval. After practice attempts of several swallows, the study was performed in the supine position. Serial anterior images were acquired in 64 x 64 matrices for 96 seconds at 0.5 seconds per frame. A large-field of view rectangular camera was used and equipped with a low-energy high-resolution collimator (e.cam, Siemens, Tokyo, Japan). To evaluate the GERD symptoms, a structured questionnaire to semiquantify the symptom was used [19]. A questionnaire score of ≥4 was considered significant as a reflux symptom.
Data analysis
After observing tracer transit on a cinematic display, esophageal transit was quantitatively analyzed [11]. Using a temporally summed esophageal image, an esophageal region was set over the whole esophagus ranging from the upper esophagus to the gastroesophageal junction, and a time-activity curve was generated. A parameter of half-time (T1/2) was defined as the interval from the peak activity to the 50% emptying of the maximum count. The retention fraction was defined as the retained activity at 90 seconds divided by the maximum activity (R90). The reproducibility of the parameters of R90 and T1/2 was r=0.93 and 0.59, respectively, by two observers [11].
The analysis of condensed images is described elsewhere [3, 4]. Each frame was compressed to a single column, and the columns were assembled into a condensed image, whose horizontal and vertical directions included temporal and spatial dimensions. In the sliding sum image presented in this study,
serial dynamic images were horizontally shifted rightwards by n pixels (n=1 to the last image number), and they were added in the final image (Figure 1). Because of the processing of simple image shifting and summation, the processing time for creating summed image was < 1 second and completely operator independent.
Based on the condensed and sliding sum images, we visually classified the transit pattern into four groups. The normal pattern showed rapid clearance from the esophagus into the stomach. The transient retention pattern showed temporal retention in the esophagus but the tracer was cleared from the esophagus by repeated dry swallows. The slight retention pattern denoted a slight degree of continuous retention in the esophagus even at 90 seconds. The severe retention pattern was defined as severe stagnation in the esophagus by the end of 90 seconds. In this pattern, the ingested bolus sometimes showed forward and backward movement from repeated swallows.
Statistics
Values in the results section were expressed as the mean ± standard deviation (SD). The differences of variance and mean values were examined by analysis of variance (ANOVA) and a multiple comparison test as Dunnett test. For χ2 analysis of the
contingency tables, likelihood ratio and Pearson statistics were used. The Wilcoxon/ Kruskal-Wallis' test was also used as non-parametric statistics.
Results
Transit patterns by condensed image and sliding sum image
Among the condensed images, the normal, transient retention, slight retention and severe retention patterns were observed in 16, 9, 5 and 10 patients, respectively. Among the sliding sum images, the four patterns exactly agreed with the condensed image patterns. Although the anatomy of the esophagus and location of the stomach were not always vertically straight, only minor differences were
observed near the esophagocardiac junction, and the patterns were essentially identical (Figure 2).
Probable SSc versus definite SSc
When probable and definite SSc patient groups were compared, the definite SSc group showed significantly higher incidence of esophageal retention (Table 1). If transient retention was included in the no-retention group, 15 of 32 (47%) of the definite SSc patients showed abnormal retention, while probable SSc patients (n=8) showed no
abnormal retention (p=0.014 based on Pearson statistics).
When the definite SSc patients were further classified into lcSSc and dcSSc groups, no significant difference in patterns was observed between lcSSc and dcSSc groups. The R90 was 23.0±23.0% and 27.6±25.3%, and the T1/2 was 28.5±46.5 seconds and 46.4±76.2 seconds for lcSSc and dcSSc types, showing no significant differences.
Low versus high score groups
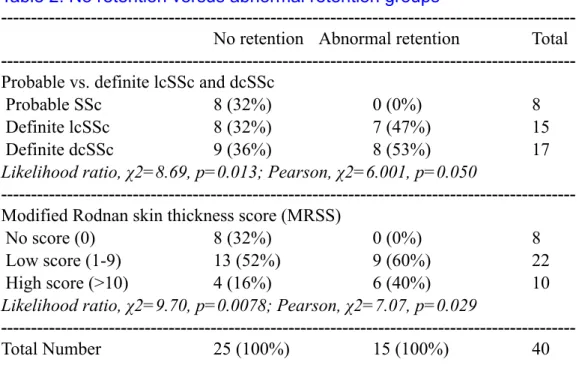
The MRSS was higher in the abnormal retention group (11.1±9.5) than in the no-retention group (6.2±8.7) (p=0.10 by ANOVA, p=0.05 by Wilcoxon/Kruskal-Wallis test). When the patients were classified based on no-score (0, probable), low-no-score (1-9) and high-score (≥10) groups, abnormal retention was significantly higher in the higher scoring groups (p=0.029) (Table 2).
When the parameters of R90 and T1/2 were measured in each transit pattern group, the higher retention groups showed more significant abnormality in terms of R90 (p<0.0001) and T1/2 (p=0.0002) (Figure 3). When patients were classified by MRSS into 3 groups, namely no-score (0), low-score (1-9) and high-score (≥10) groups, the R90 was significantly larger in the higher score groups (p=0.044 by ANOVA, p=0.027 between the no score and high score groups based on Dunnett test) (Figure 4). Since the standard deviation was large in T1/2, no significant difference was obtained among the three MRSS groups.
Discussion
A new algorithm of a sliding sum image was developed to integrate dynamic
esophageal transit images. The new functional image had a comparable value to that of the conventional condensed image analysis. Four typical transit patterns were observed, and the abnormal patterns demonstrated good
correlation to stages of SSc and severity of skin thickness score. Condensed image
analysis has been used as an effective way to summarize transit patterns as a single
functional image. The summary of time-space information into one image was considered convenient and objective to quantify the
transit. Condensed image software, however, is not standard for nuclear medicine computers. We therefore decided to make a simpler algorithm using successive shifting and addition of the original images. Since esophagus is usually vertically located, both sliding sum and condensed image patterns agreed completely. The only difference was observed when the esophagus was not straight. But general patterns were nearly the same, and this did not affect the judgement of transit patterns. The merit of the simple sliding sum algorithm is that the algorithm can be made using a combination of standard macro-programs of the image shifting and addition. The ROI setting and TAC analysis were standard for all nuclear medicine computer systems. In addition, since we made the program on a PC connected to a nuclear medicine computer and reporting system, the images were transferred easily using a common DICOM (Digital Imaging and Communications in Medicine) format.
In this study, we tentatively used a group of probable SSc. Preliminary criteria for the classification of SSc was made as the 1980 American Rheumatism Association
classification criteria [20]. When SSc cases and non-SSc cases were compiled, there were 264 definite SSc cases and 35 probable or early-stage SSc cases. LeRoy and Medsger proposed criteria of an additional early or limited subset
of SSc to supplement the previously recognized lcSSc and dcSSc types in 2001. Some patients with SSc may present to a clinic without skin involvement early in their disease course, but the diagnosis of SSc should be based on clinical and serologic findings of autoantibodies. Although it is not yet clear whether this limited subset SSc should actually be considered an early stage of the disease, the group has been included in the prospective population database since these patients may be informative regarding the development of typical SSc organ involvement [15]. Although the number of patients was still limited in this study, we found no esophageal dysmotility, and the incidence of dysmotility, R90 and T1/2 was comparable with that of the control study performed previously [11].
Esophageal symptoms in SSc are derived from complicated factors, such as esophageal hypocontraction or impaired peristalsis and impaired lower esophageal sphincter pressure function. Although the classic involvement of the gastrointestinal tract is smooth muscle fibrosis, namely replacement of smooth muscle by collagen, neural
involvement and vascular changes also contribute to pathophysiology of SSc . Even when symptoms have not come to the forefront, esophageal complication is most commonly observed in SSc patients. Medsger et al. demonstrated that the incidence of gastrointestinal involvement was found in approximately 70% of the subjects examined [8]. When autopsy cases were examined, D’Angelo et al. found that 74% of 48 cases showed muscle atrophy and fibrosis in the esophagus [7]. In this study about half of the patients with definite SSc showed abnormal transit, which was less than that of the histological examination. Although GERD symptoms are considered to be common complications in SSc patients, we have found that some patients showed dysmotility-dominant symptoms rather than GERD symptoms using a questionnaire method [19]. It is conceivable that slight histological
abnormality did not directly appear as a transit
abnormality, and the dysmotility would become evident after certain stages.
The severity of the SSc could not be differentiated well in the previous esophageal transit studies. Bestetti et al. studied 18 patients with SSc and demonstrated no significant difference between lcSSc and dcSSc types [12]. Klein et al. studied 17 patients with SSc including 9 lcSSc and 8 dcSSc types, and they also found no significant difference between the types [21]. The present study showed no significant difference in abnormal patterns between definite lcSSc and dcSSc. However, significant differences were instead observed between the probable and definite SSc groups and also between the lower and higher MRSS groups.
Although the algorithm of esophageal sliding sum image was used in patients with SSc in this study, the software would be applicable to any other types of esophageal dysmotility disorders. A possible merit of this functional imaging is to apply the method in patients who require medical therapy such as proton-pump inhibitors in patients with GERD symptoms. The changes in transit patterns after treatment or a follow-up period would be readily visible by the same format, although few studies have applied esophageal
scintigraphy for this purpose.
As a limitation, this study did not include control patients. When we compared the R90 value in the control group in the previous study using the same study protocol, R90 was 10.1±5.6 % and was comparable with the probable SSc patients (10.3±6.7 % in this study). We therefore postulated that the probable patients did not have significant esophageal complications, although the number of patients was still limited.
Conclusion
We have developed a method for integrating esophageal transit into a single functional image "sliding sum image." This result showed comparable value to the conventional condensed image, but the algorithm was very simple and the processing
was rapid enough for a routine study. When we applied the method to probable and definite SSc patients, the abnormal transit was
observed among half of the SSc patients, and the scleroderma severity was proportionate to that of the esophageal complication. The algorithm of sliding sum image can be applicable to any other types of esophageal dysmotility disorders.
Table 1. Transit patterns in patients with systemic sclerosis
---Patterns Probable SSc (n=8) Definite SSc (n=32) Total
---Normal 6 (75%) 10 (31%) 16
Transient retention 2 (25%) 7(22%) 9
Slight retention 0 (0%) 5 (16%) 5
Severe retention 0 (0%) 10 (31%) 10
Likelihood ratio, χ2=9.32, p=0.025; Pearson, χ2=6.84, p=0.077
---No retention* 8 (100%) 17 (53%) 25 Abnormal retention 0 (0%) 15 (47%) 15
Likelihood ratio, χ2=8.69, p=0.003; Pearson: χ2=6.00, p=0.014
---Total Number 8 (100%) 32 (100%) 40
---*Normal and transient retention patterns were included in no retention group.
Table 2. No retention versus abnormal retention groups
---No retention Abnormal retention Total
---Probable vs. definite lcSSc and dcSSc
Probable SSc 8 (32%) 0 (0%) 8
Definite lcSSc 8 (32%) 7 (47%) 15
Definite dcSSc 9 (36%) 8 (53%) 17
Likelihood ratio, χ2=8.69, p=0.013; Pearson, χ2=6.001, p=0.050
---Modified Rodnan skin thickness score (MRSS)
No score (0) 8 (32%) 0 (0%) 8
Low score (1-9) 13 (52%) 9 (60%) 22 High score (>10) 4 (16%) 6 (40%) 10
Likelihood ratio, χ2=9.70, p=0.0078; Pearson, χ2=7.07, p=0.029
---Total Number 25 (100%) 15 (100%) 40
---Figure 1
Creation of a condensed image and sliding sum image. In the sliding sum image, the frames are serially shifted and summed to make a functional image.
Figure 2
Comparison of condensed image (A) and sliding sum image (B). Typical four patterns were equally identified by both methods. Time-activity curves on the esophagus and retention fraction at 90 seconds (R90) are also shown (C).
Figure 3
Esophageal retention patterns and parameters of R90 and T1/2.
Figure 4
Skin thickness score of MRSS and parameters of R90 and T1/2. The classification of scores is no score (0), low score (1-9) and high score (≥10).
References
1. Drane WE, Karvelis K, Johnson DA,
Curran JJ, Silverman ED. Progressive systemic sclerosis: radionuclide esophageal scintigraphy and manometry. Radiology. 1986;160:73-6.
2. Malmud LS, Fisher RS. Radionuclide
studies of esophageal transit and gastroesophageal reflux. Semin Nucl Med. 1982;12:104-15.
3. Klein HA, Wald A. Computer analysis of radionuclide esophageal transit studies. J Nucl Med. 1984;25:957-64.
4. Ham HR, Georges B, Guillaume M,
Erbsmann F, Dobbeleir A. Evaluation of methods for qualitative and quantitative assessment of esophageal transit of liquid. Eur J Nucl Med. 1985;11:17-21.
5. Mearns AJ, Hart GC, Cox JA. Dynamic
radionuclide imaging with 99mTc-sucralfate in the detection of oesophageal ulceration. Gut.
1989;30:1256-9.
6. Edenbrandt L, Theander E, Hogstrom M,
Scheja A, Akesson A, Palmer J. Esophageal scintigraphy of systemic sclerosis. J Nucl Med. 1995;36:1533-8.
7. D'Angelo WA, Fries JF, Masi AT, Shulman
LE. Pathologic observations in systemic sclerosis (scleroderma). A study of fifty-eight autopsy cases and fifty-eight matched controls. Am J Med. 1969;46:428-40.
8. Medsger TA, Jr., Masi AT, Rodnan GP, Benedek TG, Robinson H. Survival with systemic sclerosis (scleroderma). A life-table analysis of clinical and demographic factors in 309 patients. Ann Intern Med. 1971;75:369-76.
9. Maddern GJ, Horowitz M, Jamieson GG,
Chatterton BE, Collins PJ, Roberts-Thomson P. Abnormalities of esophageal and gastric emptying in progressive systemic sclerosis. Gastroenterology. 1984;87:922-6.
10. Carette S, Lacourciere Y, Lavoie S, Halle P. Radionuclide esophageal transit in progressive systemic sclerosis. J Rheumatol. 1985;12:478-81.
11. Nakajima K, Kawano M, Kinuya K, Sato
S, Takehara K, Tonami N. The diagnostic value of oesophageal transit scintigraphy for evaluating the severity of oesophageal complications in systemic sclerosis. Nucl Med Commun. 2004;25:375-81. 12. Bestetti A, Carola F, Conciato L, Marasini B, Tarolo GL. Esophageal scintigraphy with a semisolid meal to evaluate esophageal dysmotility in systemic sclerosis and Raynaud's phenomenon. J Nucl Med. 1999;40:77-84.
13. Kaye SA, Siraj QH, Agnew J, Hilson A, Black CM. Detection of early asymptomatic esophageal dysfunction in systemic sclerosis using a new scintigraphic grading method. J Rheumatol. 1996;23:297-301.
14. LeRoy EC, Black C, Fleischmajer R, Jablonska S, Krieg T, Medsger TA, Jr., et al.
Scleroderma (systemic sclerosis): classification, subsets and pathogenesis. J Rheumatol.
1988;15:202-5.
15. Hachulla E, Launay D. Diagnosis and Classification of Systemic Sclerosis. Clin Rev Allergy Immunol. 2010 (EPub).
16. LeRoy EC, Medsger TA, Jr. Criteria for the classification of early systemic sclerosis. J
Rheumatol. 2001;28:1573-6.
17. Clements PJ, Lachenbruch PA, Seibold JR, Zee B, Steen VD, Brennan P, et al. Skin thickness score in systemic sclerosis: an assessment of interobserver variability in 3 independent studies. J Rheumatol. 1993;20:1892-6.
18. Furst DE, Clements PJ, Steen VD, Medsger TA, Jr., Masi AT, D'Angelo WA, et al. The modified Rodnan skin score is an accurate reflection of skin biopsy thickness in systemic sclerosis. J
Rheumatol. 1998;25:84-8.
19. Nakajima K, Inaki A, Hiramatsu T, Hasegawa M, Fujimoto M, Takehara K, et al. Esophageal transit scintigraphy and structured questionnaire in patients with systemic sclerosis with endoscopically proven reflux esophagitis. Ann Nucl Med. 2009;23:771-6.
20. Preliminary criteria for the classification of systemic sclerosis (scleroderma). Subcommittee for scleroderma criteria of the American Rheumatism Association Diagnostic and Therapeutic Criteria Committee. Arthritis Rheum. 1980;23:581-90.
21. Klein HA, Wald A, Graham TO, Campbell
WL, Steen VD. Comparative studies of esophageal function in systemic sclerosis. Gastroenterology. 1992;102:1551-6.