Computer Manufacturing
Server Virtualization
Intel® Xeon® Processor 5500
Series: A Proof of Concept
Intel IT, together with Intel’s Digital Enterprise Group, End User Platform Integration, and
Intel’s Software and Services Group, conducted proof-of-concept testing and total cost of
ownership (TCO) analysis to assess the virtualization capabilities of Intel® Xeon® processor
5500 series. A server based on Intel® Xeon® processor X5570 delivered up to 2.6x the
performance and up to 2.05x the performance per watt of a server based on Intel® Xeon®
processor E5450, resulting in the ability to support approximately twice as many virtual
machines for the same TCO. We also verified seamless live migration between servers based
on Intel Xeon processor 5500 series and previous Intel® processor generations using
VMware Enhanced VMotion* and Intel® Virtualization Technology FlexMigration assist.
Sudip Chahal, Sudhir S. Bangalore, Raghu Yeluri, Stephen G. Anderson, and Ashok Emani,
Intel Corporation
Executive Summary
Intel IT, together with Intel’s Digital Enterprise Group, End User Platform Integration, and Intel’s
Software and Services Group, conducted proof-of-concept testing and total cost of ownership
(TCO) analysis to assess the virtualization capabilities of Intel® Xeon® processor 5500 series.
Our results show that two-socket servers based on Intel Xeon processor 5500 series can offer
substantial improvements in virtualization performance and energy efficiency, resulting in lower
TCO per virtual machine (VM) in multiple Intel IT virtualization deployment scenarios.
We analyzed performance and energy consumption of a two-socket server based on Intel® Xeon®
processor X5570 compared with a server based on Intel® Xeon® processor E5450 in tests using
the vConsolidate virtualization benchmark suite. Based on our test results, we compared TCO for
each server.
The server based on Intel Xeon processor X5570 delivered:
Up to 2.6x faster performance
•
Up to 2.05x better performance per watt, resulting in approximately double the number of
•
VMs in the same data center thermal envelope
Approximately 2x the number of VMs for the same TCO
•
We also verified that servers based on Intel Xeon processor 5500 series are
live-migration-compatible with servers based on previous processor generations, using VMware Enhanced
VMotion* and Intel® Virtualization Technology FlexMigration assist.
Our tests show that servers based on Intel Xeon processor 5500 series can deliver significant
value and flexibility to Intel IT. We expect to standardize on Intel Xeon processor 5500 series
for new two-socket virtualization host servers.
Our results show
that, compared
with the previous
server generation,
two-socket servers
based on Intel Xeon
processor 5500
series can support
approximately 2x
as many VMs for
the same TCO.
Contents
Executive Summary ...2
Background ...3
Proof of Concept ...4
Test Setup ...4
Results ...8
Total Cost of Ownership Analysis ...10
Conclusion ...11
Authors ...12
Acronyms ...12
As part of this strategy, we test new server platforms to assess their virtualization performance and energy consumption, and analyze how well they help us meet the compute requirements of the Intel business groups we support.
We also perform tests to verify virtual machine (VM) live migration compatibility with other server platforms in our virtualized environment. This compatibility enables us to create higher capacity virtualization resource pools that combine servers based on multiple generations of Intel® processors.
Intel® Xeon® processor 5500 series, based on the Intel® microarchitecture formerly code-named Nehalem, includes new features designed to increase performance and reduce
energy consumption. These include Intel® Hyper-Threading Technology; Intel® Turbo Boost Technology; Intel® QuickPath Technology; an integrated memory controller with next-generation DDR3 memory; and 8-MB L3 cache. Servers based on the Intel Xeon processor 5500 series can have up to 2.25x the memory capacity compared to the previous server generation.
To determine the potential benefits, Intel IT recently performed proof-of-concept (PoC) testing of the virtualization capabilities of two-socket server platforms based on Intel Xeon processor 5500 series in collaboration with Intel’s Digital Enterprise Group, End User Platform Integration, and Intel’s Software and Services Group.
Background
Like many IT organizations, Intel IT is pursuing server virtualization to reduce costs and create
a more agile, dynamic data center computing environment.
Virtualization performance and power efficiency.
We tested a server based on Intel Xeon processor 5500 series, compared to the previous-generation Intel Xeon processor 5400 series, using a standard benchmark suite. We measured each platform’s performance, scalability, and power consumption.
Live migration compatibility. We tested live migration
between a two-socket server based on Intel Xeon processor 5500 series and two- and four-socket servers based on several other generations of Intel processors using Intel® Virtualization Technology (Intel® VT) FlexMigration assist and VMware Enhanced VMotion*.
Total cost of ownership (TCO) analysis. Based on
our performance test results and other factors such as platform and data center costs, we calculated relative virtualization TCO for servers based on Intel Xeon processor 5500 series compared to Intel Xeon processor 5400 series.
Test Setup
We conducted two separate sets of tests, one to measure virtualization performance and power efficiency, and one to verify live migration compatibility.
Virtualization Performance
and Power Efficiency
We performed testing to compare a two-socket server based on Intel® Xeon® processor X5570 (2.93 GHz) with a server based on the previous-generation Intel® Xeon® processor E5450 (3 GHz). We tested each platform’s performance, scalability, and power consumption when running a standard virtualization benchmark suite. System specifications are shown in Table 1. For our tests, we required a benchmark suite that:
Represented good approximations of IT workloads. •
Produced objective measurements. •
Adequately stressed each of the systems. •
Produced repeatable results. •
To meet these needs, we selected the vConsolidate benchmark suite. This tests virtualization performance by simulating real server performance in a typical environment.
We used vConsolidate (profile-2) to generate consistent application workloads for the performance analysis.1
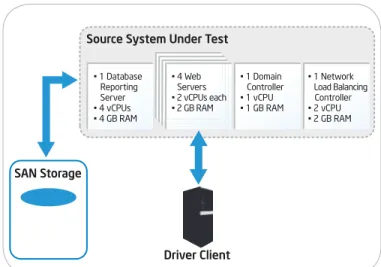
The test suite runs consolidated stack units (CSUs), each comprising five simultaneously running VMs, including one idle VM, as shown in Table 2. CSUs can be added to increase the system load and CPU utilization. Our PoC test environment is shown in Figure 1. We connected each tested server to a LAN and to a storage area network (SAN). Also connected to the LAN were driver systems that generated each CSU workload and controller nodes that managed the CSUs. We created a single set of test VMs and migrated it between test systems using the SAN.
When running the benchmark tests, we added CSUs until the systems under test attained high system utilization levels in excess of 80 percent—levels that we would rarely expect to reach in production. This allowed us to more fully exploit the scalability of each platform. If a system has enough headroom, adding CSUs increases the aggregate throughput of the system, which results in a greater vConsolidate score.
We executed three passes of the tests on each system while monitoring CPU utilization and power consumption, and selected the median set of results. For reference, we used the scores from test runs on a reference platform consisting of a two-socket server based on Intel® Xeon® processor 5160.
We analyzed the capabilities of the tested servers by comparing performance, performance-per-unit cost, and performance per watt for each system.
Live Migration Compatibility
We performed tests of live migration of representative IT workloads between servers based on Intel Xeon processor 5500 series and other Intel® server platforms, using Intel VT FlexMigration assist and VMware Enhanced VMotion. Live migration is an essential technology for an agile, dynamic data center environment based on server
1 See www.intel.com/technology/itj/2006/v10i3/7-benchmarking/6-vconsolidate.htm and http://software.intel.com/en-us/videos/ virtualization-performance-testing-with-vconsolidate/.
Proof of Concept
Our PoC focused on a number of critical areas.
virtualization. Live migration enables us to perform VM migrations within a server cluster without interrupting the services the VMs are providing. It provides the foundation for advanced data center capabilities such as dynamic load balancing and maintenance without VM downtime.
Dynamic load balancing, when combined with failover capabilities that enable fast, automated recovery of VMs, lowers the risk associated with consolidating many VMs onto each VM host. This makes it more feasible to target higher consolidation ratios that fully exploit increasing server performance and capacity. Until recently, successful live migration between servers within a cluster has required the servers to be based on the same generation of processors, with the same instruction set. This limited our ability to implement large resource pools, creating islands of servers and hindering the implementation of advanced data center capabilities. Combined, Intel VT FlexMigration assist and Enhanced VMotion, a feature of VMware ESX 3.5 U2* and subsequent software versions, are designed to overcome this limitation by enabling all servers to expose the same instruction set to applications, even if they are based on different Intel processor generations. This means we can create clusters that combine servers from multiple generations, allowing full implementation of advanced data center capabilities. We can create higher-capacity resource pools that help avoid potential issues with VM performance and response times. We previously performed tests2 to verify that we could use Intel VT
FlexMigration assist to perform live migration of essential Intel IT workloads between two-socket and four-socket servers based on generations of Intel Xeon processors with the Intel® Streaming SIMD Extensions (SSE) 3 instruction set—Intel Xeon processor 5300 series and Intel Xeon processor 7300 series—and the SSE 4.1 instruction
2 See http://communities.intel.com/docs/DOC-2538.
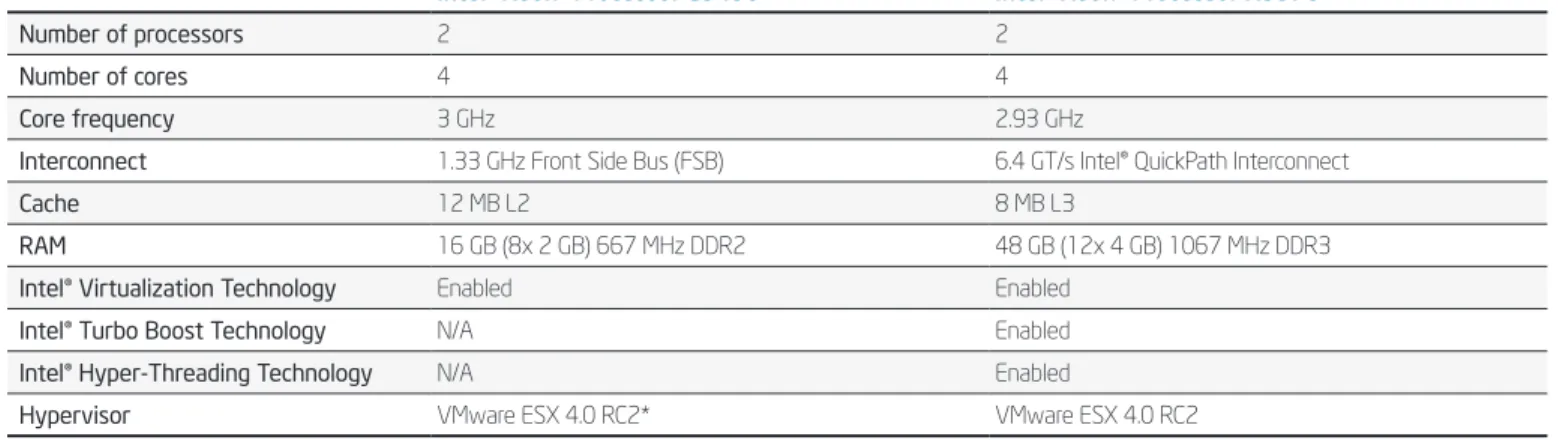
Table 1. Virtualization Performance Test System Specifications
Intel® Xeon® Processor E5450 Intel® Xeon® Processor X5570
Number of processors 2 2
Number of cores 4 4
Core frequency 3 GHz 2.93 GHz
Interconnect 1.33 GHz Front Side Bus (FSB) 6.4 GT/s Intel® QuickPath Interconnect
Cache 12 MB L2 8 MB L3
RAM 16 GB (8x 2 GB) 667 MHz DDR2 48 GB (12x 4 GB) 1067 MHz DDR3
Intel® Virtualization Technology Enabled Enabled
Intel® Turbo Boost Technology N/A Enabled
Intel® Hyper-Threading Technology N/A Enabled
Hypervisor VMware ESX 4.0 RC2* VMware ESX 4.0 RC2
CSU “n” Client Drivers CSU “n” Controller
Client DrivvverssseentsCSU 2
Client Drivers
” ”
SU“n” roller
CSU 2 Controller Two- and Four-Socket Servers
Systems Under Test CSU “n”
CSU 2 CSU 1
Guest Virtual Machines
Client DriveventverssCSU 1
Client Drivers
U
U U22
SUU roller
CSU 1 Controller
Local Area Network Storage
Area Network Storage Frame
CSU: consolidated stack unit, LUN: logical unit number,
LUNs
Figure 1. Virtualization performance test environment. Table 2. vConsolidate Consolidated Stack Unit (CSU)
Workload Operating System Memory vCPUs
VM 1 Database 64-bit Microsoft Windows Server 2003* 2.0 GB 2
VM 2 Web 32-bit Microsoft Windows Server 2003* 1.5 GB 2
VM 3 Mail 32-bit Microsoft Windows Server 2003 1.5 GB 1
VM 4 Java* 64-bit Microsoft Windows Server 2003 2. 0 GB 2
VM 5 Idle 32-bit Microsoft Windows Server 2003 0.4 GB 1
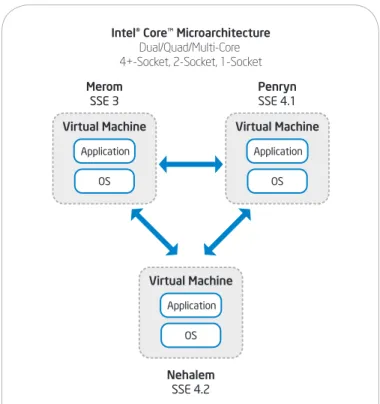
set—Intel Xeon processor 5400 series and Intel Xeon processor 7400 series. These results verified that we can combine these multiple processor generations within the same cluster. The Intel Xeon processor 5500 series includes the new SSE 4.2 instruction set, which provides additional instructions to boost performance and cut energy consumption. We wanted to verify that, using Intel VT FlexMigration assist and VMware Enhanced VMotion, we can perform live migration of representative IT workloads between servers based on Intel Xeon processor 5500 series and servers based on previous generations of Intel processors that lack SSE 4.2, as shown in Figure 2.
Live migration test design
We designed our PoC to test a wide variety of configurations and •
migration scenarios representative of our production IT environment: We used manual and automated migration modes across two •
different platform architectures (two-socket and four-socket) and three processor generations.
We used the server based on Intel Xeon processor X5570 as both •
a source and destination during migrations
We used Intel IT standard 64-bit and 32-bit Microsoft Windows* •
builds.
Our VMs were virtualized servers based on IT-standard configurations •
for database servers, reporting services, network load balancing, and Web servers.
We tested heavily loaded 32-bit and 64-bit VMs. •
Test system specifications are shown in Table 3.
Test workload
We employed an Intel IT business reporting application workload as well as VMs from our vConsolidate test workload.
The business reporting workload represents a highly utilized set of enterprise reports served to a large number of users. Tests also include some general Web site navigation. The workload includes
Table 3. Live Migration Test System Specifications
Processor Cores Intel® Microarchitecture SSE Core Frequency Interconnect RAM Server Architecture
Intel® Xeon® processor 5148 2 Merom SSE 3 2. 33 GHz 1.33 GHz FSB 16 GB Two socket
Intel® Xeon® processor X5365 4 Merom SSE 3 3 GHz 1.33 GHz FSB 16 GB Two socket
Intel® Xeon® processor X7350 4 Merom SSE 3 2.93 GHz 1.06 GHz FSB 32 GB Four socket
Intel® Xeon® processor X5450 4 Penryn SSE 4.1 3 GHz 1.33 GHz FSB 32 GB Two socket
Intel® Xeon® processor X7460 6 Penryn SSE 4.1 2.67 GHz 1.06 GHz FSB 32 GB Four socket
Intel® Xeon® processor X5570 4 Nehalem SSE 4.1 2.93 GHz 6.4 GT/s Intel® QPI 32 GB Two socket
FSB: Front Side Bus, Intel® QPI: Intel® QuickPath Interconnect, SSE: Intel® Streaming SIMD Extensions
SSE: Intel® Streaming SIMD Extensions
Intel® Core™ Microarchitecture Dual/Quad/Multi-Core 4+-Socket, 2-Socket, 1-Socket Merom
SSE 3 Virtual Machine
Application OS
Nehalem
SSE 4.2
Virtual Machine Application
OS
Penryn
SSE 4.1
Virtual Machine Application
OS
Figure 2. Intel® Virtualization Technology FlexMigration assist and VMware Enhanced VMotion* enable live migration between servers with different generations of Intel® processors.
While the individual servers support different instruction sets, only SSE 3 is exposed in compatibility mode.
Hypertext Transfer Protocol (HTTP) and network load-balancing traffic and is designed to stress compute, memory, and multi-protocol network capacity within the virtual environment under test. The workload is generated by an external physical driver client. The workload consists of seven VMs: a database reporting server running within a VM, four load-balanced Web servers used to handle user requests, a domain controller, and a network load balancing controller.
Test setup
The test host servers were connected to a SAN. The servers were also connected to two 1-Gbps LANs used for VMware Enhanced VMotion and for internal communications within our test cluster, as shown in Figure 3.
For each test, we installed VMware vSphere 4* on each of the test systems. We created a cluster, enabling VMware Enhanced VMotion Compatibility (EVC)*, and added our test systems to the cluster. Intel VT FlexMigration assist enabled the hypervisor to report the appearance of the same instruction set to the VMs.
We performed a series of manual and automated live migration tests using different combinations of host servers. We initiated the test by using an external load generator client system to direct application queries to the VMs running the test workload on the selected source host.
Once the targeted loading level was attained on the source host, live migration with VMware Enhanced VMotion was initiated. This live migration to the destination host or hosts was initiated either automatically or manually, depending on the test. We monitored the tests until live migration completed successfully. This included verifying that migration completed successfully without VM outage and that application operation was uninterrupted during the live migration. We recorded the time required to complete the migration, and we monitored application performance and related statistics as well as host system utilization information for the duration of each test. We performed two sets of live migration tests:
Manual migration. We tested manual migration of our IT business
reporting workload between pairs of test servers. In each test, we migrated all seven VMs from the source to the destination server. The server based on Intel Xeon processor X5570 was used as one of the destination servers.
Automated Migration. In these tests, the server based on Intel
Xeon processor X5570 was used as the source server. We created a VMware Distributed Resource Scheduler* (VMware DRS*) cluster that included all six servers that were described in Table 3. Our
• 1 Database Reporting Server • 4 vCPUs • 4 GB RAM
• 1 Domain Controller • 1 vCPU • 1 GB RAM
• 1 Network Load Balancing Controller • 2 vCPU • 2 GB RAM
Source System Under Test
Driver Client SAN Storage
RAID 4 14 Drives
• 4 Web Servers • 2 vCPUs each • 2 GB RAM
Server Test RAM ConfigurationMeasured Power Busy, Idle Target RAM Configuration Estimated Power Busy, Idle Intel® Xeon® processor E5450 16 (8x 2 GB) 364, 256 32 (8x 4 GB) 376, 268 Intel® Xeon® processor X5570 48 (12x 4 GB) 451, 246 72 (18x 4 GB) 481, 276
goal was to show automated load balancing within a cluster of servers based on multiple generations of Intel processors. In each test, we initially loaded multiple VM workloads on the source server. To help ensure this source server was sufficiently loaded with VMs to distribute and load-balance among the servers in the cluster, we added two vConsolidate CSUs as well as our business reporting application.
Then we used VMware DRS to automatically migrate the VMs to the other servers in the cluster. In separate tests, we used different VMware DRS cluster modes ranging from 1 (conservative) to 5 (aggressive). With higher settings, the software performed additional migrations to more evenly balance workloads within the cluster, based on the workloads that were running and the capacity of the available servers.
Results
In our performance tests, the server based on Intel Xeon processor X5570 was considerably more scalable than the server based on the Intel Xeon processor E5450. All of our live migration tests completed successfully.
Virtualization Performance and Scalability
The server based on Intel Xeon processor X5570 was considerably more scalable than the server based on the Intel Xeon processor E5450, delivering up to 2.6x the aggregate throughput at lower utilization levels.Aggregate throughput on the server based on Intel Xeon processor X5570 continued to increase as we increased the number of CSUs to eight, with utilization at about 90 percent. In contrast, performance on the server based on Intel Xeon processor E5450 reached a maximum with four CSUs, with utilization at about 98 percent. Maximum server throughput and utilization are compared in Figure 4.
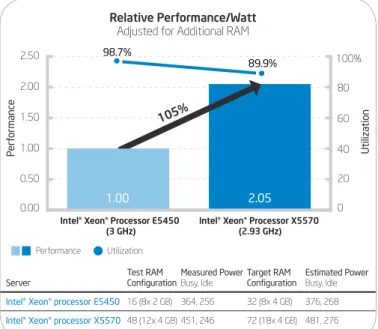
Performance per Watt
We measured power consumed by each server when running the tests. Details are shown in Figure 5.
The memory configurations of our two test systems were adequate to evaluate and compare performance. However, in real deployments, we would expect to use slightly larger memory configurations. This additional memory would slightly increase power consumption. Therefore, for our analysis, we created an adjusted power consumption estimate that takes into account this additional memory. Our adjusted estimate was based on 32 GB of RAM on the server based on Intel Xeon processor E5450, and 72 GB on the server based on Intel Xeon processor X5570.
We then normalized performance per watt relative to the server based on Intel Xeon processor E5450. Based on the adjusted power 0.00
0.50 1.00 1.50 2.00 2.50
Perf
ormance
Utiliza
tion
2.05
Utilization Performance
1.00
Intel® Xeon® Processor E5450
(3 GHz) Intel® Xeon® Processor X5570 (2.93 GHz) Relative Performance/Watt
Adjusted for Additional RAM
105%
1.00
0 20 40 60 80 100%
89.9% 98.7%
Figure 5. Power consumption and performance per watt.
Intel internal measurements, April 2009. 0.00
1.00 2.00 3.00 4.00 5.00 6.00 7.00
0 20 40 60 80 100%
Perf
ormance
Utiliza
tion
6.09 6.04 5.91 5.56
3 CSU 4 CSU 5 CSU 5 CSU 6 CSU 7 CSU 8 CSU
Utilization Performance
89.1% 89.9% 84.1% 87.3%
98.7% 98.7% 99.8%
2.28 2.32 2.27
Intel® Xeon® Processor E5450
(3 GHz) Intel® Xeon® Processor X5570 (2.93 GHz) Aggregate Performance Comparison
CSU: consolidated stack unit
Figure 4. Performance and utilization with vConsolidate benchmark. Intel internal measurements, April 2009.
consumption, the server based on Intel Xeon processor X5570 with 72 GB of RAM delivered approximately 105 percent better performance per watt compared with the server based on Intel Xeon processor E5450 with 32 GB of RAM.
Live Migration
In our manual migration tests, all migrations with VMware Enhanced VMotion completed successfully with no loss of service, as shown in Figure 6.
All of our automated migration tests with VMware Enhanced VMotion also completed successfully. As shown in Figure 7, higher VMware DRS settings resulted in an increasing number of migrations, resulting in a redistribution of the VMs among the available servers that reflected each server’s relative capacity. The idle VMs were not migrated, even with the most aggressive VMware DRS setting; because idle VMs do not consume processor resources, migrating them does not help balance resource utilization within the cluster.
Intel® Xeon® Processor X5450 SSE 4.1, 2-socket, 4 cores/CPU Intel® Xeon® Processor X5570
SSE 4.2, 2-socket, 4 cores/CPU
Intel® Xeon® Processor X5365 SSE 3, 2-socket, 4 cores/CPU
7 Virtual Machines 7 7 Virtual Virtual Virtual Virtual Machines Machines Machines Machines Machines Machines Machines Machines 7 Virtual Machines 7 Virtual Machines 7 7 Virtual Virtual Virtual Virtual Machines Machines Machines Machines Machines Machines Machines Machines 7 Virtual Machines 7 Virtual Machines 7 7 Virtual Virtual Virtual Virtual Machines Machines Machines Machines Machines Machines Machines Machines 7 Virtual Machines
Intel® Xeon® Processor 5148 SSE 3, 2-socket, 4 cores/CPU
7 Virtual Machines 7 7 Virtual Virtual Virtual Virtual Machines Machines Machines Machines Machines Machines Machines Machines 7 Virtual Machines
SSE: Intel® Streaming SIMD Extensions Figure 6. Manual migration results.
Intel® Xeon® processor X5570
Intel® Xeon® processor 5148
Intel® Xeon® processor X5365
Intel® Xeon® processor X5450
Intel® Xeon® processor X7350
Intel® Xeon® processor X7460 DB 2 DB 1 Java 2 Java* 1 Idle 2 Idle 1 Mail 2 Mail 1 Web 2 Web 1 Web 2 Web 1 Web 3DB Web 4NLB
DC DB 2 DB 1 Java 2 Java 1 Idle 2 Idle 1 Mail 2 Mail 1 Web 2 Web 1 Web 2 Web 1 Web 3DB Web 4NLB
DC Ag gr es si ve Co ns er va tiv e
Before Automated Live Migration
After Automated Live Migration – All live migrations completed successfully VMware DRS Setting 1 0 Migrations VMware DRS Setting 2 6 Migrations VMware DRS Setting 3 8 Migrations VMware DRS Setting 4 11 Migrations VMware DRS Setting 5 12 Migrations Java 1 Idle 2 Idle 1 Mail 2 Mail 1 Web 2 Web 2 Web 3 Web 4NLB
DB 2 DB 1
Java 2 Web 1 Web 1 Web 1 DBDB
DC Web 1
Web 1 DB 2 DB 1 Java 2 Java 1 Idle 2 Idle 1 Mail 2 Mail 1 Web 2 Web 2 Web 2 Web 3Web 3DBDB Web 4Web 4NLBNLB DC DC DB 2 DB 1 Java 2 Java 1 Idle 2 Idle 1 Mail 2 Mail 1 Web 2 Web 1 Web 2 Web 2 Web 1
Web 1 Web 3Web 3DBDB Web 4Web 4NLBNLB DC DC DB DB 2 DB 1 Java 2 Java 1 Idle 2 Idle 1 Mail 2 Mail 1 Web 2 Web 1 Web 2 Web 2 Web 1
Web 1 Web 3Web 3 Web 4Web 4NLBNLB DC
DC
Web 1 DB 1 DB 2
Java 2 Java 1 Idle 2 Idle 1 Mail 2 Mail 1 Web 2 Web 2 Web 2 Web 1
Web 1 Web 3Web 3DBDB Web 4Web 4NLBNLB DC
DC
Java 2DB 2 DB 1 Java 1 Idle 2 Idle 1 Mail 2 Mail 1 Web 2 Web 1 Web 2 Web 2 Web 1
Web 1 Web 3Web 3DBDB Web 4Web 4NLBNLB DC DC Idle 2 Idle 1 Mail 2 Mail 1 Web 2 Web 1 Web 3 Web 4Web 4NLB
DB 2 DB 1
Java 2 Java 1 Web 1 Web 2
DB DB DC DB 2 DB 1 Java 2 Java 1 Idle 2 Idle 1 Mail 2 Mail 1 Web 2 Web 1 Web 2 Web 2 Web 1
Web 1 Web 3Web 3DBDB Web 4Web 4NLBNLB DC DC DB 2 DB 1 Java 2 Java 1 Idle 2 Idle 1 Mail 2 Mail 1 Web 2 Web 1 Web 2 Web 2 Web 1
Web 1 Web 3Web 3DBDB NLBNLB DC
DC
DB Web 2 Web 2 Web 2 DB 2 DB 1 Java 2 Java 1 Idle 2 Idle 1 Mail 2 Mail 1 Web 1 Web 1
Web 1 Web 3Web 3 Web 4Web 4NLBNLB DC
DC
DB 1
Web 1 Java 1 Java 2 DB 2 Java 2 Java 1 Idle 2 Idle 1 Mail 2 Mail 1 Web 2 Web 2 Web 2 Web 1
Web 1 Web 3Web 3DBDB Web 4Web 4NLBNLB DC DC DB 2 DB 1 Idle 2 Idle 1 Mail 2 Mail 1 Web 2 Web 1 Web 2 Web 2 Web 1
Web 1 Web 3Web 3DBDB Web 4Web 4NLBNLB DC DC DB 2 DB 1 Java 2 Java 1 Idle 2 Idle 1 Mail 2 Mail 1 Web 2 Web 1 Web 2 Web 2 Web 1
Web 1 Web 3Web 3DBDB Web 4Web 4NLBNLB DC DC DB 2 DB 1 Java 2 Java 1 Idle 2 Idle 1 Mail 2 Mail 1 Web 2 Web 1 Web 2 Web 2 Web 1
Web 1 Web 3Web 3DBDB Web 4Web 4NLBNLB DC DC DB 2 DB 1 Java 2 Java 1 Idle 2 Idle 1 Mail 2 Mail 1 Web 2 Web 1 Web 2 Web 2 Web 1
Web 1 Web 3Web 3DBDB Web 4Web 4NLBNLB DC DC DB 2 DB 1 Java 2 Java 1 Idle 2 Idle 1 Mail 2 Mail 1 Web 2 Web 1 Web 2 Web 2 Web 1
Web 1 Web 3Web 3DBDB Web 4Web 4NLBNLB DC DC DB 2 DB 1 Java 2 Java 1 Idle 2 Idle 1 Mail 2 Mail 1 Web 2 Web 1 Web 2 Web 2 Web 1
Web 1 Web 3Web 3DBDB Web 4Web 4NLBNLB DC DC DB 2 DB 1 Java 2 Java 1 Idle 2 Idle 1 Mail 2 Mail 1 Web 2 Web 1 Web 2 Web 2 Web 1
Web 1 Web 3Web 3DBDB Web 4Web 4NLBNLB DC DC DB 2 DB 1 Java 2 Java 1 Idle 2 Idle 1 Mail 2 Mail 1 Web 2 Web 1 Web 2 Web 2 Web 1
Web 1 Web 3Web 3DBDB Web 4Web 4NLBNLB DC DC DB 2 DB 1 Java 2 Java 1 Idle 2 Idle 1 Mail 2 Mail 1 Web 2 Web 1 Web 2 Web 2 Web 1
Web 1 Web 3Web 3DBDB Web 4Web 4NLBNLB DC DC DB 2 DB 1 Java 2 Java 1 Idle 2 Idle 1 Mail 2 Mail 1 Web 2 Web 1 Web 2 Web 2 Web 1
Web 1 Web 3Web 3DBDB Web 4Web 4NLBNLB DC DC DB 2 DB 1 Java 2 Java 1 Idle 2 Idle 1 Mail 2 Mail 1 Web 2 Web 1 Web 2 Web 2 Web 1
Web 1 Web 3Web 3DBDB Web 4Web 4NLBNLB DC DC Idle 2 Idle 1 Mail 2 Mail 1 Web 4 Web 3
DC Web 4
NLB DB 2 DB 1 Java 2 Java 1 Idle 2 Idle 1 Mail 2 Mail 1 Web 2 Web 1 Web 2 Web 2 Web 1 Web 1 Web 3Web 3DBDB
DC DC Java 1 Web 2 DB 2 DB 1 Java 2 Idle 2 Idle 1 Mail 2 Mail 1 Web 2 Web 1 Web 1
Web 1 Web 3Web 3DBDB Web 4Web 4NLBNLB DC DC Web 2 DB DB 2 DB 1 Java 2 Java 1 Idle 2 Idle 1 Mail 2 Mail 1 Web 1 Web 2 Web 2 Web 1
Web 1 Web 3Web 3 Web 4Web 4NLBNLB DC DC DB 1 Web 1 DB 2 Java 2 Java 1 Idle 2 Idle 1 Mail 2 Mail 1 Web 2 Web 2 Web 2 Web 1
Web 1 Web 3Web 3DBDB Web 4Web 4NLBNLB DC DC DB 2 Java 2 Web 1 DB 1 Java 1 Idle 2 Idle 1 Mail 2 Mail 1 Web 2 Web 1 Web 2 Web 2 Web 3Web 3DBDB Web 4Web 4NLBNLB DC
DC DB 2
DB 1 Java 2 Java 1 Web 1 Web 2
Web 2 Web 2 Web 1
Web 1 DBDB NLBNLB
Idle 2
Idle 1 Web 2 Web 3 DB 2 DB 1
Java 2 Java 1 Web 1Mail 1 Mail 2
Web 2 Web 2 Web 1
Web 1 DBDB Web 4Web 4NLBNLB
DC Web 4
NLB DB 2 DB 1 Java 2 Java 1 Idle 2 Idle 1 Mail 2 Mail 1 Web 2 Web 1 Web 2 Web 2 Web 1 Web 1 Web 3Web 3DBDB
DC DC
DB 1 DB 2 Mail 2 Java 2 Java 1 Idle 2 Idle 1 Mail 1 Web 2 Web 1 Web 2 Web 2 Web 1
Web 1 Web 3Web 3DBDB Web 4Web 4NLBNLB DC
DC Web 2
DB DB 2 DB 1 Java 2 Java 1 Idle 2 Idle 1 Mail 2 Mail 1 Web 2 Web 1 Web 1
Web 1 Web 3Web 3 Web 4Web 4NLBNLB DC
DC
DB 2 Mail 1 Web 1 DB 1 Java 2 Java 1 Idle 2 Idle 1 Mail 2 Web 2 Web 2 Web 2 Web 1
Web 1 Web 3Web 3DBDB Web 4Web 4NLBNLB DC DC Java 2 Java 1 Web 1 DB 2 DB 1 Idle 2 Idle 1 Mail 2 Mail 1 Web 2 Web 1 Web 2 Web 2 Web 3Web 3DBDB Web 4Web 4NLBNLB DC
DC Web 4
DB: Database, DC: domain controller, VMware DRS*: VMware Distributed Resource Scheduler*, NLB: network load balancing controller vConsolidate workload
Total Cost of Ownership Analysis
Different groups of users have a variety of business requirements, resulting in multiple virtualization deployment TCO scenarios. Based on our performance test results and other data, we calculated relative TCO of the server based on Intel Xeon processor X5570, compared with the server based on Intel Xeon processor E5450, when used to support each of these TCO scenarios.
In our TCO calculations, we assumed that we would deploy typical rack-mounted servers. We compared a server based on Intel Xeon processor X5570 with 72 GB RAM to a server based on Intel Xeon processor E5450 with 32 GB RAM.
Our TCO calculations took into account costs in the following areas: Hardware (including configured RAM) and software acquisition; •
we based our analysis on list prices from major manufacturers Depreciation and amortization
•
Data center annual depreciation and operating expenses •
Server support personnel •
LAN, SAN, and cabling •
Key TCO assumptions are shown in Table 4.
Virtualization Deployment TCO Scenarios
We focused on two types of scenario and estimated TCO for each platform when supporting each scenario. Results are shown in Figure 8.Performance-centric SLA-focused
These scenarios emphasize the need to meet performance service-level agreements (SLAs). Typical examples include end-of-quarter financial processing and trading applications. IT must meet SLAs that specify response times for interactive applications and completion times for batch jobs. Therefore, application responsiveness or throughput are paramount.
To meet these SLAs, servers must consistently deliver a specific level of performance or throughput. In our TCO analysis, we therefore limited the number of VMs on each server, based on their relative performance in our tests. The server based on Intel Xeon processor X5570 delivered 2.6x the performance of the server based on Intel Xeon processor E5450, so in our TCO model we assumed that it would support a total of 2.6x as many VMs. Our TCO analysis showed that compared with the server based on Intel Xeon processor E5450, the server based on Intel Xeon processor X5570 supported 2.28x as many VMs for the same TCO, due to its increased throughput and greater performance per watt. Memory
Capacity-focused (Performance/Memory)Balanced Mix 50:50
Performance-centric
Number o
f Virtual Machines
Intel® Xeon® processor E5450 (3 GHz) Intel® Xeon® processor X5570 (2.93 GHz) 0.0
0.5 1.0 1.5 2.0 2.5
1.00 1.00 1.00
2.28
1.97 2.11
Figure 8. Relative number of virtual machines for the same total cost of ownership for different virtualization scenarios. Table 4. TCO assumptions
Category Assumption
Data Center Physical Plant
Space per rack: 25 square feet •
Depreciation cycle: 15 years •
Power use: 80 watts per square foot at USD 0.08 •
per kilowatt-hour
Busy time; 12 hours per day •
Cooling power multiplier: 2.0 •
LAN, Storage Area Network (SAN), and Cabling
Copper and fiber pre-wiring per rack: USD 3,000 over •
10 years
Gigabit Ethernet (GbE) LAN port costs per server •
USD 300 over 4 years
Fibre Channel (FC) SAN port costs per server: USD •
700 over 4 years
LAN/SAN ports per server: 7 GbE (LAN), 2 FC (SAN) •
Personnel • USD 100,000 per support employee per year One support employee per 250 servers (physical •
server support only, including installation, break, fix and de-installation). Virtual machine operating system and application support is not included, as it is the same for all alternatives.
Memory capacity-focused
These scenarios focus on provisioning large numbers of VMs as cost-effectively as possible; performance is secondary. Typically, this means maximizing the number of VMs per system. Examples include systems used for testing and development, and production applications with light transaction loads.
Because performance is secondary, the number of VMs per system tends to be constrained by memory capacity rather than processor performance. We assumed that each server could support as many VMs as the host server physical memory could accommodate.
The server based on Intel Xeon processor X5570 could support 1.97x as many as the Intel Xeon processor E5450-based server for the same TCO.
Balance of performance-centric and memory capacity-focused workloads
In situations where a server runs a mix of performance-centric SLA-focused and memory capacity-focused workloads, the server based on Intel Xeon processor X5570 offered a clear TCO advantage. This suggests
that this server would also be a good choice if we do not know in advance which workloads the server will be required to support.
Blade and specialized server considerations
Our TCO analysis is based on mainstream rack-mounted virtualization server configurations. TCO comparisons using blade servers and specialized niche server configurations will depend on the specifics of the server and the target deployment scenario or usage model.
Other scenarios
The virtualization performance, memory capacity, and power efficiency of servers based on Intel Xeon processor 5500 series makes them well suited for a variety of additional scenarios. In data centers facing constraints in power, cooling, or LAN or SAN ports, servers based on Intel Xeon processor 5500 series can allow us to host more VMs within the same data center capacity. The increased performance and memory capacity also means that we can increase the flexibility and efficiency of our environment by increasing the number of VMs we can include within a cluster.
Conclusion
Servers based on Intel Xeon processor 5500 series delivered significant improvements in
virtualization performance, energy efficiency, and TCO compared with previous generations.
They add significant capacity and flexibility to our virtualization environment: We can integrate
them into clusters with other server processor generations and perform live migration across
multiple generations, protecting our server investment and creating higher-capacity virtualization
resource pools. We expect to standardize on the Intel Xeon processor 5500 series for new
two-socket virtualization host servers.
Virtualization and Four-Socket Servers
The growing performance and capacity of two-socket servers makes them suitable for many general-purpose enterprise virtualization roles. However, Intel IT has found that some specialized roles require the even greater capacity of four-socket servers. For example, supporting virtualized enterprise resource planning (ERP) systems may require more memory per virtual machine (VM) or a greater processor core count per VM. This means four-socket servers, which have a greater memory capacity and core count than two-four-socket servers, may be a better fit. We expect that four-socket servers will be able to take on even more demanding virtualization host requirements when the Nehalem microarchitecture, which includes the virtualization hardware assists Intel® Virtualization Technology for Directed I/O (Intel® VT-d) and Intel® Virtualization Technology for Connectivity (Intel® VT-c), becomes available in four-socket servers with the planned introduction of Nehalem-EX systems.
Performance tests and ratings are measured using specific computer systems and/or components and reflect the approximate performance of Intel® products as measured by those tests. Results have been simulated and are provided for informational purposes only. Results were derived using simulations run on an architecture simulator or model. Any difference in system hardware or software design or configuration may affect actual performance. Buyers should consult other sources of information to evaluate the performance of systems or components they are considering purchasing. For more information on performance tests and on the performance of Intel products, visit www.intel.com/performance/resources/benchmark_limitations.htm. Intel does not control or audit the design or implementation of third-party benchmark data or Web sites referenced in this document. Intel encourages all of its customers to visit the referenced Web sites or others where similar performance benchmark data are reported and confirm whether the referenced benchmark data are accurate and reflect performance of systems available for purchase.
This paper is for informational purposes only. THIS DOCUMENT IS PROVIDED “AS IS” WITH NO WARRANTIES WHATSOEVER, INCLUDING ANY WARRANTY OF MERCHANTABILITY, NONINFRINGEMENT, FITNESS FOR ANY PARTICULAR PURPOSE, OR ANY WARRANTY OTHERWISE ARISING OUT OF ANY PROPOSAL, SPECIFICATION OR SAMPLE. Intel disclaims all liability, including liability for infringement of any proprietary rights, relating to use of information in this specification. No license, express or implied, by estoppel or otherwise, to any intellectual property rights is granted herein. Intel, the Intel logo, and Xeon are trademarks of Intel Corporation in the U.S. and other countries.
*Other names and brands may be claimed as the property of others. Copyright © 2009 Intel Corporation. All rights reserved.
Printed in USA Please Recycle
0609/KAR/KC/PDF 321377-001US
Sudhir S. Bangalore is a senior engineer with Intel Digital Enterprise Group, End User Platform Integration.
Raghu Yeluri is an enterprise architect with Intel Digital Enterprise Group, End User Platform Integration.
Stephen G. Anderson is a systems engineer with Intel IT.
Ashok Emani is a performance engineer with Intel Software and Services Group.
Acronyms
VMware DRS VMware Distributed Resource Scheduler
ERP enterprise resource planning
EVC Enhanced VMotion Compatibility
FC Fibre Channel
GbE gigabit Ethernet
Intel® VT Intel® Virtualization Technology FlexMigration assist
FlexMigration assist
Intel® VT-c Intel® Virtualization Technology for Connectivity
Intel® VT-d Intel® Virtualization Technology for Directed I/O
PoC proof of concept
SAN storage area network
SLA service-level agreement
TCO total cost of ownership