How Hadoop Clusters Break
Ariel Rabkin and Randy Katz
EECS Department, UC Berkeley
Berkeley, California, USA
{
asrabkin,randy
}
@cs.berkeley.edu
Abstract
This article describes lessons from examining a sample of several hundred sup-port tickets for the Hadoop ecosystem, a widely-used group of “big data” storage and processing systems. We give a taxonomy of errors and describe how they are addressed by supporters today. We show that misconfigurations are the dominant cause of failures. We describe these misconfigurations in detail. Using these fail-ure reports, we identify some of the design ”anti-patterns” and missing platform features that contribute to the problems we observed. We offer advice to develop-ers about how to build more robust distributed systems. We also advise usdevelop-ers and administrators how to avoid some of the rough edges we found.
Keywords: reliability, distributed systems, cloud computing, big data, system administration.
Ari Rabkin Bio
Ari Rabkin is a PhD candidate at UC Berkeley. He is interested in software quality and software intelligibility. He has contributed to several open source projects, including Hadoop, the Chukwa log collection framework, and the JChord program analysis toolset. He spent a summer at Cloudera, inc, in the course of which he conducted the investigations described here. He previously attended
Cor-nell University (AB ’06), and can be reached [email protected].
edu
Randy Katz Bio
Randy Howard Katz is the United Microelectronics Corporation Distinguished Professor in Electrical Engineering and Computer Science at UC Berkeley. His recent work has focused on cluster scheduling and Cloud-based logging and anal-ysis. He received his undergraduate degree from Cornell University, and his M.S. and Ph.D. degrees from Berkeley. He is a Fellow of the ACM and the IEEE, and a member of the National Academy of Engineering. He can be reached at [email protected]
1
Introduction
“Big data” is all the rage. Ten years ago, few software developers worked on dis-tributed systems with dozens of nodes. Today, the rise of the cloud and of software-as-a-service have made such systems increasingly common, and developers are responding by developing systems tuned for their workloads. New systems for large-scale data storage and processing are announced regularly. The dominance of relational database management systems is now in question, with “NoSQL” data stores becoming a major area of development. This rapid innovation appears unlikely to end soon.
Scalable distributed systems can be formidably complex. They challenge cur-rent engineering practice in several ways. This has driven the growth of the big-data support industry. Cloudera is one such support provider, selling support for the Hadoop ecosystem, which includes some of today’s most widely deployed “big data” systems. This article describes the causes of failures seen by Cloudera sup-porters. This article draws on that experience to advise users, developers and ad-ministrators how to build more reliable systems.
Hadoop was originally a filesystem and MapReduce implementation. In the last several years, it has grown into a complex ecosystem, including a range of software systems. Additional members of the Hadoop ecosystem include HBase (a distributed table store), Zookeeper (a reliable coordination service), and the Pig and Hive high-level languages that compile down to MapReduce. Throughout this article, we use “Hadoop” to mean the ecosystem as a whole, not just the filesystem and MapReduce components.
This ecosystem is the most prominent example of today’s open-source big data processing tools. (The project won the 2012 InfoWorld “Technology of the Year” award in recognition of this.) It is mature enough that companies like eBay, Ya-hoo!, and Facebook, use it for critical business processes. As a result, Hadoop is the place to look for lessons on how to build and operate reliable systems.
Our results are based on examining a sample of 293 customer support cases (“tickets”) at Cloudera, from the spring and summer of 2011. This viewpoint gave us access to experiences from dozens of distinct user sites, which would have been difficult to obtain in any other way. Our sample excludes purely informational or administrative cases as well as those where the definitive root cause of the failure was not recorded. The remaining cases cover a range of open-source Hadoop software. Our conclusions are therefore based on the study of an ecosystem, not just a single project.
One of us (Rabkin) manually labelled all the support cases in our sample with the established root cause. Since our observations come from a software support vendor, we see only those failures that users could not diagnose themselves. For example, our data set would not include a power supply failure. Our data does, however, include problems that users could not diagnose unaided, but that turned out, after investigation, to be due to hardware or operating system defects.
Note that we are studying failures that required support. These only partly overlap with bug reports to developers. A bug might cause trouble for many users (in which case we will count it several times), but only be entered once in a bug-tracking database. Conversely, bug reports are filed for defects that might not have ever caused trouble for an operational deployment. For instance, bug reports sometimes cover cosmetic defects, documentation errors, and so forth. Our data set does not include issues of this type.
When a production system fails, there is usually plenty of blame to go around. The developer should have handled the failure cause more gracefully. The user or administrator could have avoided using the system in such a way that the failure cause arose. The developer could have supplied tools to monitor and test against known failure causes. The user could potentially have pressed the developer to address reliability and ease of use early in the system life-cycle. Because the con-cerns of developers are entangled with those of users or administrators, this paper
adopts both perspectives. We outline somedo’sanddon’tsfor big-system building
and also describe how users and administrators can best cope with the limitations and rough edges they will encounter using Hadoop today.
2
Observations
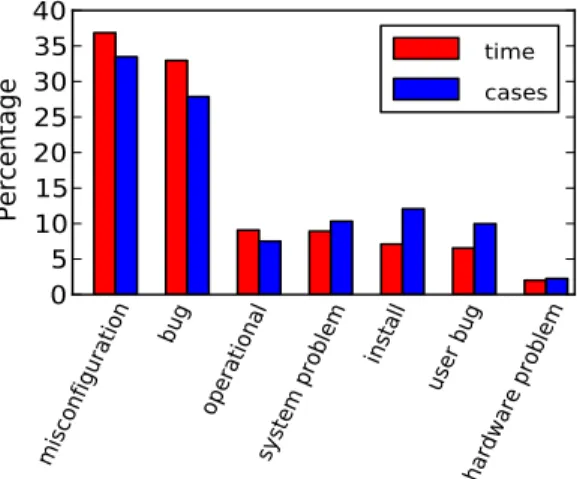
The main result of our study is that there are no magic bullets for improving ser-vice reliability. No one cause of failures predominated. The most common specific cause of failure accounted for no more than 10% of support cases. Figure 1 breaks down the number of cases and supporter time by category of root cause. (Sup-porter time is the estimated time spent by a sup(Sup-porter working on the case. For confidentiality reasons, we show percentages, rather than absolute numbers.)
The remainder of this section drills down on the specific causes of failures. We begin by describing the breakdown by the kind of root cause. Following that, we go into more detail about system problems and misconfiguration. We believe these two categories have the most lessons to teach developers and users of other software systems.
misconfiguration
bug
operational
system problem
install user bug
hardware problem
0
5
10
15
20
25
30
35
40
Percentage
time
cases
Figure 1: Breakdown of support cases and supporter time by issue category. For a given category, the ratio of “time” to “cases” is the average time spent resolving each issue in that category.
2.1
Overview
We classified cases based on the required action to resolve the issue, after diagno-sis. Going in order from most to least common:
• Misconfigurationincludes Hadoop configuration plus operating system-level
but Hadoop-specific permissions and options.
• Bugsrequired a patch to some part of the Hadoop platform. (This is a
de-liberately narrow definition: problems posed by unclear documentation or misleading user interfaces are generally not resolved by a patch, and hence are not classified as bugs.)
• Operational issuesare cases where the user is operating the system wrongly.
For example, the filesystem may not restart normally if it was previously killed abruptly while many files were open and partly-written.
• Asystem problemrequired a change to the underlying system in a
non-Hadoop-specific way. Most of these were caused by networking problems.
• Install problemsare those caused by a faulty installation. This often meant
having inconsistent library versions or relying on optional components that were not installed. Compression libraries were a common source of trouble.
• User bugsrequired changes to user code, often because the user
misunder-stood the Hadoop MapReduce API.
• Hardware problemswere the root cause for a handful of issues. These were
primarily networking faults that resulted in nodes appearing to fail intermit-tently.
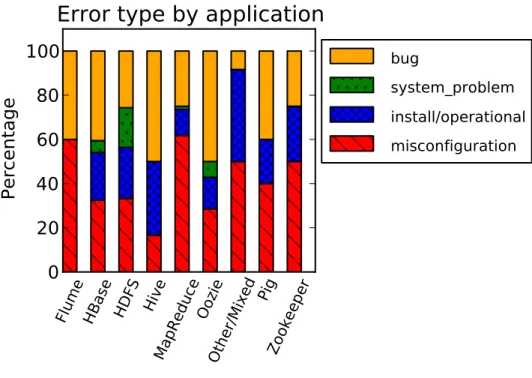
Figure 2 shows the relative frequency of different error causes for each major application supported. (We do not display absolute numbers, again for confiden-tiality reasons.) This data gives some insight into how well our results generalize across different software systems.
The same general categories apply to each of the applications we looked at. However, there are a few notable differences between applications. System prob-lems often manifest in HDFS, the filesystem at the bottom of the stack. MapRe-duce is highly memory-bound, and hence prone to misconfiguration. Hive is a younger, less mature system, with a high bug rate.
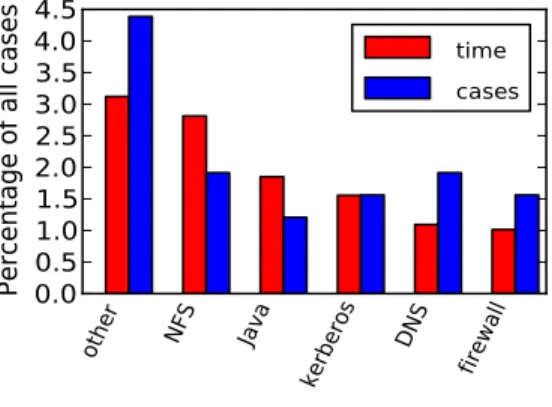
Figure 3 breaks down system problems. As can be seen, network problems are dominant. This category also included some problems due to broken JVM versions
or impropermysqlinstallation. (The Hive data processing system usesmysqlto
store metadata.)
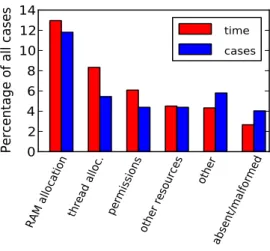
Misconfiguration represents the largest category of both cases and of reported supporter time. It therefore deserves special scrutiny. In Figure 4, we break down the misconfiguration category. As can be seen, memory-management problems were especially common. The next section will discuss them in detail. After that, we supply more detail about the remaining misconfiguration categories.
2.2
Memory Misconfiguration
Approximately a third of all misconfiguration problems were caused by some form of memory mismanagement. Hadoop has many options for controlling memory allocation and usage, at several levels of granularity. Working from the bottom
Flume HBase HDFS Hive
MapReduce
Oozie
Other/Mixed
Pig
Zookeeper
0
20
40
60
80
100
Percentage
Error type by application
bug
system_problem
install/operational
misconfiguration
Figure 2: Fraction of issue types by application supported.
up, there are configurable buffers, such as the MapReduce sort buffer. Each Java process itself has a configured maximum heap size. For each daemon, there is an
OS-imposed limit on the maximum amount of RAM to be used, theulimit. For
MapReduce, the user can tune how many concurrent tasks to execute on each host. And all tasks must fit into physical memory.
Hadoop does not check that these options form a sensible hierarchy. It is possi-ble for the combined heap size for all the daemons on a machine to exceed physical memory, or for the JVM to request more than the OS-imposed limit. Depending whether the JVM heap size, OS limit, or physical memory is exhausted first, this will cause an out-of-memory error, JVM abort, or severe swapping, respectively.
Another common source of memory-management problems is that a normally-small datastructure becomes unexpectedly large. The Hadoop MapReduce master, the Job Tracker, keeps a summary of past job execution in memory. This history is normally small and so Hadoop does not track or manage its size. But if a site runs many jobs with many tasks, it can grow large. This will cause slowdowns due to garbage collection overhead, and ultimately out-of-memory errors.
The difficulty of memory management is partly attributable to the Java plat-form. Consider a team of programmers writing a buffer that automatically frees
old items to manage memory use. Since Java lacks an equivalent of C’ssizeof,
the programmers must do all the accounting themselves. Language support for estimating memory usage would be preferable, easing code reuse. It could also
other
NFS
Java
kerberos DNS
firewall
0.0
0.5
1.0
1.5
2.0
2.5
3.0
3.5
4.0
4.5
Percentage of all cases
time
cases
Figure 3: Breakdown of system problems. Network services dominate this category.
capture memory overheads imposed by the runtime. Failing that, projects might adopt standard and reusable memory-conscious classes and data structures.
2.3
Other misconfigurations
Memory is not the only aspect of the system prone to misconfiguration. Hadoop services, especially the HBase table store, will keep many files and sockets open. The number of available file handles can be exhausted if it is not increased well above the system default. Disk space, too, can be exhausted if not managed prop-erly.
In addition to managing these resources, Hadoop and HBase rely on users to statically pick maximum sizes for various thread pools, including the sending and receiving sides of the MapReduce shuffle. If there are too many threads requesting data for each server thread, the requesters will experience frequent timeouts, lead-ing to jobs abortlead-ing. This sort of issue is marked as “thread allocation” in Figure 4.
We noticed two other common sources of trouble. One was permissions and account management, accounting for more than 10% of misconfigurations. Mis-matches between the user accounts for MapReduce jobs and those on the local filesystems was a particular source of trouble.
A last problem category we noticed is malformed or misplaced configuration files. These can be hard to diagnose because if a configuration file is unusable or not found, Hadoop will use default values. These defaults may be sufficient for some use cases or workloads, but then result in failures under heavy load or when a user tries to use an advanced feature.
RAM allocation thread alloc. permissions other resources
other
absent/malformed
0
2
4
6
8
10
12
14
Percentage of all cases
time
cases
Figure 4: Breakdown of misconfigurations. Resource allocation (including memory) is the major cause of configuration problems.
3
Support Responses
Our data set gives us insight into the support process, not only into failures. De-bugging often requires several rounds of interaction and exploration. Sometimes, the initial problem description from users and the attached logs and other data, are sufficient to diagnose the problem immediately. In other cases, it takes substantial time to find the key evidence or to test various possible diagnoses.
We investigated whether retrieving logs and data is a major support bottleneck. Figure 5 is a CDF showing when logs and attachments are added to a support ticket. The X-axis is time, scaled relative to the duration of the case. As can be seen, a large fraction of all the logs that will ever be available are present near the start of the case, but both logs and attachments continue trickling in throughout. If getting logs and attachments was the primary barrier to solving a case, we would expect a preponderance of arrivals near the finish time. Instead, there is an initial spurt as users describe the problem and supporters ask for logs, and then a roughly constant arrival rate. This shows that much of the work happens after logs are made available as supporters and users iterate through possible diagnoses.
Diagnosis time varies significantly across different types of problems. Install issues tend to be particularly quick to diagnose and fix. They are often determin-istic and often manifest at startup, leading to quick debug cycles. Bugs and mis-configurations are comparatively difficult, since they can require days or weeks of testing to verify that a problem has been fixed.
Sometimes, a reboot is all it takes to resolve a problem. In 11 of our 293 tickets, killing and restarting solved the problem. This was a particularly common remedy in cases where a process had failed but not exited, and was therefore blocking a port.
0
20
40
60
80
100
Percent of case duration
0.0
0.2
0.4
0.6
0.8
1.0
Cumulative fraction
Logs
Attachments
Figure 5: Arrival of logs and attachments, scaled to length of each support case.
4
What makes big-data different? [Possible
side-bar]
Several previous publications have discussed real-world failure causes. Jim Gray’s “Why do computers stop and what can be done about it” is a prominent example,
discussing failure data of Tandem computer deployments [3]. Huanget alinclude
data about failures seen in production by IBM [4]. Oppenheimeret al. looked
at failure data from Internet services in the early 2000s [5]. Recently, Yinet al.
have looked at misconfigurations in a variety of open-source and proprietary sys-tems [8].
Like this past work, we found that human mistakes are a major source of trou-ble, especially misconfiguration. Unlike this past work, we found that resource and thread allocation were major issues, while they are barely mentioned in past stud-ies. We suspect that Tandem users and interactive web services were optimizing for up-time and were mostly not subjecting their system to continuous intensive load. In contrast, users of big-data systems are trying to get the most performance possible out of their hardware. This means that they are more likely to operate at close to the maximum CPU, memory, and disk utilization. The price of this more aggressive usage is new failure modes.
We suspect that the open source development process is not the dominant con-tributor to the problems we saw. There are examples of easy-to-use open-source software for end users, such as the Firefox web browser or the Eclipse program-ming environment. In contrast, proprietary databases (which, like Hadoop, are designed to fully utilize a machine’s resources) often require specialized adminis-trators to attain optimal performance.
5
Limitations
The data in this paper was the result of labeling by a single individual. There is a possibility of bias or systematic mistakes. We regularly checked our labels with other members of the support team to mitigate this risk.
Our data is drawn from six months in the lifespan of a single software ecosys-tem. We are not in a position to say how the failure patterns we saw would compare to those from a more- or less- mature software system, nor can we definitively es-tablish how the Hadoop ecosystem compares to others. Our goal is to advise users and developers what to watch out for, not to supply precise statistics that would inevitably become suspect over time.
The period we studied included the beta-test period for Cloudera’s CDH3 Hadoop distribution. As a result, we saw more bugs, particularly in MapReduce, than we would have had we only considered problems in stable versions. Hence, our re-sults are representative of the experiences of early adopters, not of users of final versions.
6
Conclusion
No one cause for failures predominated in the support cases we examined. This suggests that no single change can drastically improve the reliability of the system in question. Rather, attention must be paid to a range of details. Put more posi-tively, all the categories of failure we saw can be addressed by current engineering techniques. More care in checking for and handling various out-of-resource cases should avoid many misconfiguration problems. It should also make the remain-ing ones simpler to diagnose. More attention to testremain-ing, particularly user-interface testing, should reduce the number of operational and install-time problems.
There is also room for future research and development. Today, much of the work of testing and validating configuration must be done per-site. Software devel-opers must anticipate and separately handle many different contingencies. Ways to systematically harden programs or to validate configuration will be a promis-ing area for future work. All these are already active research topics, although a general survey of reliability research is beyond the scope of this article.
Lessons for System Design [Possible sidebar]
1. Prune mutually-dependent optionsMemory and thread allocation in Hadoop is done with a set of closely-related options that can easily be set incompat-ibly. Errors involving such options accounted for most misconfigurations and about 20% of all failures. A design-time fix would be to parameterize the configuration space in such a way that one option corresponds to scal-ing along the “best practices” dimension, while a second knob allows for workload-specific or “expert” tuning.
2. Check configurationsAnother remedy is to build a configuration checker. Cloudera and other vendors have released such tools for Hadoop. Ways to do this automatically and efficiently are an area of current and potential future research [6].
3. Pay attention to memory managementJava provides programmers with powerful automatically-growable data structures. This makes it easy to lose track of the size of a given allocation. Problems can arise if a change in workload results in some usually-small data structure becoming very large. Better language mechanisms for managing resources are another area that would benefit from future work.
4. Better loggingLogs are commonly used to diagnose issues. Often, there is a statement, buried in thousands of lines of irrelevance, that clearly in-dicates the problem. Picking out the relevant bits in a long log listing is a skill that supporters slowly develop over time. Systems should clearly dis-tinguish “actionable” messages recommending a user action from those that are purely informational or intended for debugging. RPC-level tracing, such as provided by X-Trace or Dapper, would also be helpful [2, 7].
5. Design for [Configuration] changeAs systems evolve, options are added and deprecated. Flexible configuration-file formats allow users to set options that do not exist. This will happen: Users sometimes read documentation for a version they aren’t using, and will specify options that do not apply to the versions they have installed. They will then be puzzled when setting the option has no effect. Have a strategy in place to look for and flag undefined or obsolete options. (These errors were classified as ’absent’ in Figure 4.) Having a narrow XML schema for configuration would help.
Lessons for Users and Administrators [Possible
sidebar]
1. Monitor to avoid resource exhaustionThe systems we studied sometimes fail abruptly and catastrophically when resources like disk space or memory are exhausted. Restoring to a working state may require manual intervention. Hence, monitoring is required to avoid putting the system in such a state. Insufficient monitoring of memory and disk space was a major contributing cause of failures. We saw many failures of this type: resource exhaustion was approximately 20% of all problems. This suggests that user sites (even those with sophisticated users and administrators) would benefit from more careful monitoring.
2. Customize and deploy cautiouslyInstallation problems were often caused by mixing code from different versions, either due to a partial upgrade or by installing a new version on top of an old version. Big-data systems are not always designed or tested for such combinations. The rapid pace of open-source development, in particular, can result in a plethora of versions, making comprehensive cross-version testing infeasible.
3. Test under loadMisconfigurations can escape notice in a lightly loaded system, but result in failures when the system is subjected to intensive pro-duction workloads. Before deploying a service in propro-duction, users should verify stability by running it under demanding workloads for lengthy peri-ods.
4. Understand which dimensions of scale are well-testedBig-data systems can scale in many directions. Not all of these dimensions will be equally
well tested. Reaching some scalability limits will be handled gracefully. Hitting others can cause downtime. For your mix of software, will the sys-tem respond gracefully to a CPU-limited job? A memory-limited job? A few large objects or many small ones? The answers should be used for capacity planning and overall system architecture.
5. When in doubt, reboot firmlyPartial failures are a fact of life with complex software. A failed process can sometimes stick around, ignoring graceful-stop commands, while still holding a lock or a port. Have infrastructure in place to detect and kill stuck processes when it’s time to restart things. (The Recovery Oriented Computing project came to similar conclusions [1].)
References
[1] G. Candea and A. Fox. Crash-only software. In9th Workshop on Hot Topics
in Operating Systems (HotOS IX). USENIX, 2003.
[2] R. Fonseca, G. Porter, R. Katz, S. Shenker, and I. Stoica. XTrace: A
Perva-sive Network Tracing Framework. In4th USENIX Symposium on Networked
Systems Design and Implementation (NSDI ’07), Cambridge, MA, April 2007.
[3] J. Gray. Why do computers stop and what can be done about it. InSymposium
on reliability in distributed software and database systems, pages 3–12. IEEE
Computer Society Press, 1986.
[4] H. Huang, R. Jennings, III, Y. Ruan, R. Sahoo, S. Sahu, and A. Shaikh.
PDA: a tool for automated problem determination. InProceedings of the 21st
USENIX conference on Large Installation System Administration Conference
(LISA’07), 2007.
[5] D. Oppenheimer, A. Ganapathi, and D. A. Patterson. Why do internet services
fail, and what can be done about it? InUSENIX Symposium on Internet
Technologies and Systems, 2003.
[6] A. Rabkin and R. Katz. Static extraction of program configuration options.
InProceedings of the 33rd International Conference on Software Engineering
(ICSE ’11), 2011.
[7] B. Sigelman, L. Barroso, M. Burrows, P. Stephenson, M. Plakal, D. Beaver, S. Jaspan, and C. Shanbhag. Dapper, a large-scale distributed systems tracing infrastructure. Technical report, Google, 2010.
[8] Z. Yin, J. Zheng, X. Ma, Y. Zhou, S. Pasupath, and L. Bairavasundaram. An empirical study on configuration errors in commercial and open source
sys-tems. In23rd ACM Symposium on Operating Systems Principles (SOSP),