THE USE OF HAAR WAVELETS IN DETECTING AND LOCALIZING
TEXTURE DEFECTS
G
INTARĖV
AIDELIENĖ ANDJ
ONASV
ALANTINASKaunas University of Technology, Department of Applied Mathematics, Kaunas, Lithuania e-mails: [email protected]; [email protected]
(Received June 8, 2016; revised October 16, 2016; revised November 22, 2016; accepted November 25, 2016)
ABSTRACT
In this paper, a new Haar wavelet-based approach to the detection and localization of defects in grey-level texture images is presented. This new approach explores space localization properties of the discrete Haar wavelet transform (HT) and generates statistically-based parameterized texture defect detection criteria. The criteria provide the user with a possibility to control the percentage of both the actually defect-free images detected as defective and/or the actually defective images detected as defect-free, in the class of texture images under investigation. The experiment analyses samples of ceramic tiles, glass samples, as well as fabric scraps, taken from real factory environment.
Keywords: automatic visual inspection, defect detection, discrete wavelets transforms, statistical data analysis, texture images
INTRODUCTION
Automatic defect detection using a vision system is one of the key technologies for improving produc-tivity and maintenance of high product quality in a factory. Defect detection is intended to solve the problem of localization of abnormal areas in industrial products such as leather, textile, glass, paper, plastic products, ceramics tiles, etc. In the last decade, dozens of methods for detecting texture surface defects have been developed and proposed. Most of them can be roughly divided into four categories: statistical,
model-based, structural and spectral (Xie, 2008; Ngan et al.,
2011; Karimi and Asemani, 2014). Among the latter, some methods are oriented to detect specific defects, such as slub (Liu et al., 2008), pincher (Chuang et al.,
2009), crack (Chambon et al., 2011), welding
(Nacered-dine et al., 2007), knots (Hu et al., 2011), colour tonality
(Xie et al., 2006), etc., whereas other methods (often
called hybrid methods) combine several ideas and techniques to compensate for the shortcomings associa-ted with the variety and complexity of texture defects.
The hybrid defect detection methods quite often employ statistical and spectral analysis. These include visual inspection, based on wavelet characteristics and multivariate statistics of Hotelling, as well as Mahala-nobis distance, Chi-square function, for ceramic surfaces (Lin, 2007), independent vector analysis and statistical schemes, along with wavelet transforms
described in Sari and Ertüzün’s (2014). Some methods combine Gabor analysis of the sample image and
statistical processing of wavelet coefficients (Rallo et
al., 2009). Kim and Kang (2006; 2007) have extracted
texture features using wavelet packet frame decom-position, and selected the Gaussian mixture model as a classifier. Moreover, there is a study which investi-gates neural networks with the pyramid wavelet
transform (Wong et al., 2009), as well as statistical
analysis (Lin, 2009). An automatic damage detection system for engineering ceramic surfaces with image processing techniques, pattern recognition and machine vision is presented in Chen et al. (2013).
The majority of defect detection methods found in literature are adapted to process one type of texture surfaces. However, at present there is a growing need to develop more flexible defect detection schemes suitable for processing several types of texture
sur-faces. For instance, Kwon et al. (2015) have indicated
that seven different classes of texture images can be distinguished using Variance of Variance (VOV) pro-files applied to the random forest-based machine lear-ning algorithm. The article (Yuan et al., 2015) describes the modified Otsu method with the weight function which can be used to detect defects on texture surfaces
such as wood, fabric, metal, rail images, etc. Hu et al.
purpose, an optimized elliptical Gabor filter is consi-dered (Hu, 2015). Tolba (2012) introduces a novel multi-scale and multi-directional (MSMD) autocorre-lation function (ACF)-based approach to reliable defect detection and localization on homogeneous web sur-faces.
In this paper, a hybrid texture defect detection method (approach) that can be applied to inspect various types of texture surfaces (ceramic tiles, glass, textile, etc.) is presented. The developed approach combines Haar wavelet analysis of test texture images with statistically-based processing of non-overlapping subsets of wavelet coefficients.
MATERIAL AND METHODS
THE TEXTURE DEFECT DETECTION:
THE BASIC IDEA
The key point of the proposed texture defect detec-tion approach is simultaneous applicadetec-tion of several different scanning filters to the texture image under investigation. The filters differ in size and formation, and actualize particularities of two-dimensional Haar wavelets. The decision on the quality of the test texture image is made in relation to a priori prescribed per-centage of positive responses.
The whole texture defect detection process com-prises of six steps, namely:
1. The training set SX is selected from the whole set
(total population) T of defect-free texture images,
i.e.
1 2 1 2
{ [ ( , )] | , {0,1, , 1
2 ; N; 1, 2, } . X s s
n
S X X m m m m N
N n s r T
}; ,
2. The corresponding set SY of discrete Haar wavelet
(HT) spectra of images in SX is generated, i.e.
1 2 1 2
{ [ ( , )] | , {0,1, , 1} 1, 2, }.
Y s s
S Y Y k k k k N
s r
3. For each s (s{1, 2,r}), the set of HT spectral coefficients
1 2 1 2
{ ( ,Y k ks ) |k k, 0,1,,N1}
is partitioned into a collection of non-overlapping subsets (regions), namely: s(0, 0), s( , 0)i1 , s(0, )i2
and , where i i . The spectral
coefficient is attached
to the region , , or ,
if and only if k k , and
1 2 ( , ) s i i
s
1, 2 1, 2, {0,1,
1 ( , 0)i s
log n
,n
,N1})
2 (0, )i
2k1 i1
1 2 ( , ) Y k k
(0, 0 s
1 2 1 2 ( ,k k
s
0
) s( , )i i1 2
2 0
k ,
1 0
k and nlog2k2i2
2
k i
or n log2k1i1 and
2 2 g lo
n
1,i2 {0,1, , }}n
1, )|2 i
, respectively.
It is worth emphasizing that there is one-to-one correspondence between the set of regions
{s(i i
1 2 1 2 { ( , )|i i i i, {0,1
and the set of partitioning
schemes ,, }}n of the texture
image X of size 2n2n, where: represents a
unique block which coincides with
(0, 0)
X; ( , 0)i1 , (0, )i2
and ( , )i i1 2 ( ,i i1 21, 2,, )n stand for the regular
par-tition of X into non-overlapping image blocks of size
1
2i 2n,
2n2i2 and 2i12i2, respectively.
Numerical values of HT spectral coefficients, con-tained in s( , )i i1 2 ( ,i i1 2{0,1,, })n are specified
un-iquely by respective image blocks of the partitioning scheme( ,i i1 2). The latter blocks are processed
con-secutively using one filtering scheme (Fig. 1).
4. Using the sample data
1( , ),1 i2 Y i i2( , ),1 2 ,Y i ir( , )),1 2 (Y i
where Y i is( , )1 2 (s{1, 2,r}) is the average value of
HT spectral coefficients falling into the region
1 2 ( , s i i )
( ,i i1 2{0,1,, })n , the statistical hypothesis on the type of distribution of the value (discrete random variable) Y i( , )1 i2 (representing the total population
) is tested.
T
5. Taking into account both the type of distribution
(normal, lognormal, exponential, etc.) of the value Y i i( , )1 2 ( ,i i1 2{0,1,, })n
p p I I i i
and a priori prescribed probability p (0 < p < 1), the
paramete-rized sigma intervals ( , )1 2 are constructed,
i.e., P Y i i
( , )1 2 Ip
p.The texture defect detection criterion CRITp is
defined to be
1 2 1 2
{ ( , )| , 0,1, , p p p
CRIT I I i i i i n}.
The optimal value of the parameter p, for a
parti-cular class of texture images, is determined experi-mentally considering the texture defect information provided by an expert.
6. The test texture image Xtest of size 2n2n is
assumed to be defect-free if the number of cases when Ytest( , )i i1 2 falls into the respective sigma
interval I i ip( , )1 2 ( ,i i1 2 0,1,, )n is not less than 2
( 1) .
p n Otherwise, the image Xtest is assumed to
process, the test texture image Xtest is scanned
(n + 1)2 times, and all scanning results contribute to the final decision on the quality of the test texture image.
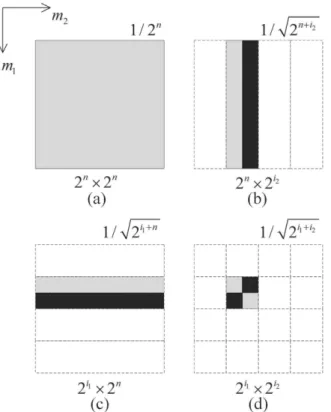
Fig. 1. Image partitioning and filtering schemes (pixel
values, contained in the black area of the image block, are subtracted from those contained in the grey area; the resulting sum is multiplied by a scalar, shown above): (a) (0,0); (b) (0, )i2 ; (c) ( , 0)i1 ; (d) ( , )i i1 2 .
LOCALIZING DEFECTS IN DEFECTIVE
TEXTURE IMAGES
Another problem, closely related to the detection of defects in texture images (surfaces), is the locali-zation of defects on the defective surface. This problem is noteworthy not only theoretically but also practically
(e.g., to meet industrial needs). For instance, in the
glass (card-board, plastic, ceramic, etc.) industry, it often happens that not only large defect-free sheets of the production are manufactured, processed and dis-patched to the customer but also smaller defect-free pieces, obtained from the defective sheet, are processed repeatedly during planned technological processes.
The proposed scheme for localizing defects in the defective texture image Xdef of size NN (N = 2n, nN)
comprises of four steps, namely: (1) parti-tioning the
image Xdef into non-overlapping image blocks of size
, (2) generating HT spectra
for the latter blocks, with the use of a computational
algorithm (Valantinas et al., 2013); (3) constructing
the parameterized texture defect detection criteria (on
the basis of the training set SX) for each image block
2m2m
{ 1, 2, } m n n ;
2m2m
; (4) applying the same defect detection “mechanism” to each image block as in the case of the whole test texture image.
RESULTS
In this section, the overall performance of the developed approach (method) to detecting and loca-lizing defects in texture images (surfaces) is evaluated. Three classes of grey-level texture images of size 256×256 have been explored, namely: ceramic tiles, glass sheets and fabric scraps.
All experiments have been implemented on a perso-nal computer using MatLab. Computer simulations were performed on a PC with CPU Intel Core i5-4200 U [email protected] Hz, 8 GB of memory.
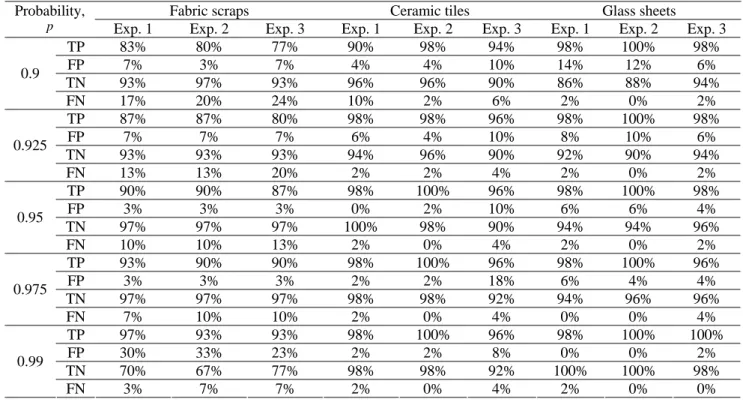
First of all, 100 defective images and 100 defect-free images, for each class of texture images, were selected. Then, three experiments, each including 100 randomly chosen test image samples (50 defect-free images, and 50 defective ones), were carried out. The analysis of experimental results are presented in Table 1, where the system’s performance parameter TP (true positive) stands for the detection of actual abnormalities, TN (true negative) means that normal textures are correctly labelled, FN (false negative) implies that true abnormality is not detected and FP (false positive) signifies that the texture is falsely identified as abnormal.
Table 1 shows that the test image classification
results depend on the probability p. To measure the
extent of this dependence, three widely used perfor-mance parameters of the secondary system were intro-duced and explored, namely: accuracy (texture defect detection success rate) = (TP+TN)/(TP+FN+TN+FP),
sensitivity = TP/(TP+FN) and specificity = TN/(TN+FP).
The average values of these parameters were cal-culated for each class of texture images (including all three experiments and some selected values of proba-bility p[0.5; 0.99]) (Figs. 2-4).
It can be observed (Fig. 2) that the highest average accuracy values are: 0.94 (fabric scraps), for
p = 0.975; 0.97 (ceramic tiles), for p = 0.99; 0.99
(glass sheets), for p = 0.99; also, the texture defect
detection success rate, for all classes of texture
images, tends to decrease, as p decreases. Therefore,
Table 1. Classification of fabric scraps, ceramic tiles and glass sheet images.
Fabric scraps Ceramic tiles Glass sheets
Probability,
p Exp. 1 Exp. 2 Exp. 3 Exp. 1 Exp. 2 Exp. 3 Exp. 1 Exp. 2 Exp. 3
TP 83% 80% 77% 90% 98% 94% 98% 100% 98%
FP 7% 3% 7% 4% 4% 10% 14% 12% 6%
TN 93% 97% 93% 96% 96% 90% 86% 88% 94%
0.9
FN 17% 20% 24% 10% 2% 6% 2% 0% 2%
TP 87% 87% 80% 98% 98% 96% 98% 100% 98%
FP 7% 7% 7% 6% 4% 10% 8% 10% 6%
TN 93% 93% 93% 94% 96% 90% 92% 90% 94%
0.925
FN 13% 13% 20% 2% 2% 4% 2% 0% 2%
TP 90% 90% 87% 98% 100% 96% 98% 100% 98%
FP 3% 3% 3% 0% 2% 10% 6% 6% 4%
TN 97% 97% 97% 100% 98% 90% 94% 94% 96%
0.95
FN 10% 10% 13% 2% 0% 4% 2% 0% 2%
TP 93% 90% 90% 98% 100% 96% 98% 100% 96%
FP 3% 3% 3% 2% 2% 18% 6% 4% 4%
TN 97% 97% 97% 98% 98% 92% 94% 96% 96%
0.975
FN 7% 10% 10% 2% 0% 4% 0% 0% 4%
TP 97% 93% 93% 98% 100% 96% 98% 100% 100%
FP 30% 33% 23% 2% 2% 8% 0% 0% 2%
TN 70% 67% 77% 98% 98% 92% 100% 100% 98%
0.99
FN 3% 7% 7% 2% 0% 4% 2% 0% 0%
Fig. 2. Dependence of the defect detection success rate on the probability p.
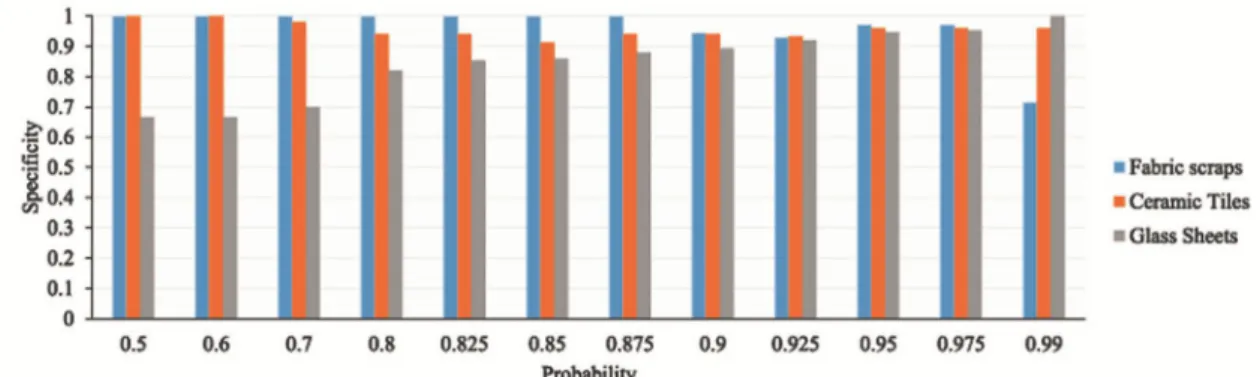
Fig. 4. Dependence of the defect detection specificity rate on the probability p.
On the other hand, the above results show compa-ratively high performance of the proposed approach.
Indeed, the wavelet-domain HMT model (Hu et al.,
2014) using textile fabric, woven wool, leather and sandpaper surfaces gives the defect detection success rate of (on average) 0.921. The success rate when applying VOV profiles to forest-based machine learning
algorithm (Kwon et al., 2015) is 0.927, for wafer,
solid car surface, pear colour car surface, paper, fabric, stone and striped-metal.
Figs. 3 and 4 present the dependence of the re-maining secondary parameters (sensitivity, specificity)
on probability p. Usually, this dependence is analysed
to control risk in the process of texture defect detec-tion to establish particular criteria. If the priority is considered to be the selection of highest quality pro-ducts (fabric scraps, ceramic tiles, glass sheets), i.e., sorting out all defective products perhaps at the expense
of some defect-free products, the value of p should be
chosen in such a way that sensitivity is close to 1 and specificity is less than 1. If the main interest is in the
second-rate products, the value of p should be selected
so that sensitivity is less than 1 and specificity is close to 1.
For instance, in the case of fabric scraps (Figs. 3-4), for p = 0.99: sensitivity = 0.94 and specificity = 0.72. It means that 28% of actually defect-free texture images (however characterized by negligible defects) are classified as defective. The remaining images, classified as defect-free are of the highest quality.
For p = 0.7, in the class of ceramic tiles (Figs. 3-4), specificity = 0.98 and sensitivity = 0.87. Thus, 13% of actually defective images are classified as being defect-free. This leads to the selection (classification) of second-rate ceramic tiles.
In the case of glass sheets (Figs. 3-4), sensitivity
= 0.99, for p = [0.825, 0.95], and specificity varies
from 0.85 to 0.94, respectively. This means that one
can control the quality (at the same time, percentage) of classified defect-free images by removing 6% or more (up to 15%) of actually defect-free images (per-haps having small defects).
Beyond a doubt, the above facts bring to light and corroborate existing flexibility of the developed texture defect detection system.
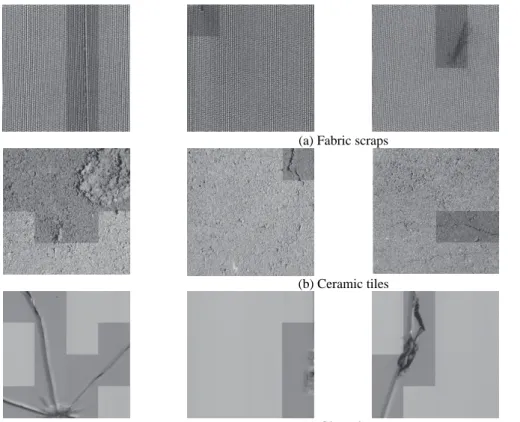
Some texture defect localization results are pre-sented in Fig. 5. In all cases, the defective texture image 256×256 has been partitioned into smaller blocks of size 64×64, and each block has then been inspected separately.
Defective textile samples with darkened areas of different fabric defects are displayed in Fig. 5a, darke-ned abnormalities in ceramic tiles are shown in Fig. 5b and defective glass sheets with localized defects are presented in Fig. 5c.
Thus, the proposed scheme is useful for localizing
texture defects, i.e., it successfully segments defects
of different shapes, positions and texture backgrounds.
DISCUSSION
In this paper, a new Haar wavelet-based defect detection and localization method (approach) for grey-level texture images is proposed. The approach explores space localization properties of the discrete Haar wavelet transform, generates statistically-based texture defect detection criteria and leaves space for controlling the risk.
(a) Fabric scraps
(b) Ceramic tiles
(c) Glass sheets Fig. 5. Localizing surface defects (n = 8, m = 6, p = 0.99).
Based on our experience, we here note that a task-oriented adaptation of the proposed defect detection system is necessary for a specific class of texture images. The nature of texture images falling into one or
the other class cannot be ignored, i.e., in each case,
the numerical values of the parameter (probability) p
for constructing sets of respective sigma intervals should be selected properly.
The computation of the discrete Haar spectra for the selected texture image fragments 2m2m using full image HT spectrum is 10-20 times faster in compa-rison with the direct evaluation procedures. This can be explained by the fact that the absolute majority, i.e., (2m – 1)2 spectral coefficients are transferred into the Haar spectrum of the fragment under consideration without any changes. This way, the time needed to
test a single image with fixed probability p is 0.028
s, and defect localization requires additional 0.04 s.
Our work in the nearest future is going to focus on the analysis of the potential possibility to apply higher-order statistics (e.g., sample variance) to deve-loping Haar wavelet-based texture defect detection criteria.
REFERENCES
Chambon S, Gourraud C, Moliard JM, Nicolle P (2010). Road crack extraction with adapted filtering and Markov model-based segmentation: introduction and validation. Int Joint Conference on Computer Vision Theory and
Applications, VISAPP, May 2010, France.
Chen S, Lin B, Han X, Liang X (2013). Automated inspec-tion of engineering ceramic grinding surface damage based on image recognition. Int J Adv Manuf Tech 66:431–43.
Chuang WL, Chen CH, Yen JY, Hsu YL (2009). Using MPCA of spectra model for fault detection in a hot strip mill. J Mater Process Tech 209:4162–8.
Hu C, Min X, Yun H, Wang T, Zhang S (2011). Auto-matic detection of sound knots and loose knots on sugi using gray level co-occurrence matrix parameters. Ann Forest Sci 68:1077–83.
Hu GH (2015). Automated defect detection in textured surfaces using optimal elliptical Gabor filters. Optik 126:1331-40.
Hu GH, Zhang GH, Wang QH (2014). Automated defect detection in textured materials using wavelet-domain hidden Markov models. Opt Eng 53(9):093107. doi: 10.1117/1.OE.53.9.093107.
Karimi MH, Asemani D (2014). Surface defect detection in tiling Industries using digital image processing methods: Analysis and evaluation. Isa T 53:834–44. Kim SC, Kang TJ (2006). Automated defect detection
system using wavelet packet frame and Gaussian mixture model. J Opt Soc Am A 23(11):2690–701. Kim SC, Kang TJ (2007). Texture classification and
seg-mentation using wavelet packet frame and Gaussian mixture model. Pattern Recogn 40:1207–21.
Lin HD (2007). Automated visual inspection of ripple defects using wavelet characteristic based multivariate statistical approach. Image Vision Comput 25:1785–801. Lin HD (2009). Automated defect inspection of
light-emitting diode chips using neural network and statis-tical approaches. Expert Syst Appl 36:219–26. Liu X, Su ZWZ, Choi KF (2008). Slub extraction in woven
fabric images using Gabor filters. Text Res J 78:320–5. Nacereddine N, Hamami L, Tridi M, Oucief N (2007). Non-parametric histogram-based thresholding methods for weld defect detection in radiography. International J Electr, Comput, Energe, Electron Commun Eng 9(1): 1401–5.
Ngan HYT, Pang GKH, Yung NHC (2011). Automated fabric defect detection – a review. Image Vision Comput 29:442–58.
Ralló M, Millán MS, Escofet J (2009). Unsupervised novelty detection using Gabor filters for defect segmentation in textures. J Opt Soc Am A 26(9):1967–76.
Sari L, Ertüzün A (2014). Texture defect detection using independent vector analysis in wavelet domain. 22nd
Int Conf Pattern Recogn, Aug 24-28, 2014, Sweden, 1639–44.
Tolba AS (2012). A novel multiscale-multidirectional auto-correlation approach for defect detection in homoge-neous flat surfaces. Mach Vision Appl 23:739-50. Valantinas J, Kančelkis D, Valantinas R, Viščiūtė G (2013).
Improving space localization properties of the discrete wavelet transform. Informatica-Lithuan 24(4):657-74. Wong WK, Yuen CWM, Fan DD, Chan LK, Fung EHK
(2009). Stitching defect detection and classification using wavelet transform and BP neural network. Expert Syst Appl 36:3845-56.
Xie X (2008). Review of recent advances in surface defect detection using texture analysis techniques. ELCVIA 7(3):1–22.
Xie X, Mirmehdi M, Thomas B (2006). Colour tonality inspection using eigenspace features. Mach Vision Appl 16(6):364–73.