QUANTIFICATION OF ANGIOGENESIS ON THE RAT AORTIC RING
ASSAY
S
ILVIAB
LACHER, L
AETITIAD
EVY, A
GNESN
OEL ANDJ
EAN-M
ICHELF
OIDARTLaboratory of Tumor and Developmental Biology, University of Liège, Tour de Pathologie (B23), Sart-Tilman; B-4000 Liège
e-mail: [email protected] (Accepted January 31, 2003)
ABSTRACT
Image analysis is used to quantify angiogenesis on the rat aortic ring model. This technique allows to determine: (1) the aortic ring area and factor shape; (2) the number of microvessels, the total number of branching, the maximal microvessel length and the number of microvessels in function of the distance to the aortic ring; (3) the total number of isolated fibroblast-like cells and the number of fibroblast-like cells in function of the distance to the aortic ring. We show that this method is suitable to quantify spontaneous angiogenesis as well as to analyse a complex microvascular network induced by vascular endothelial growth factor (VEGF).
Keywords: angiogenesis, complexity, fibroblast-like cells, microvessels, quantification.
INTRODUCTION
In vitro angiogenesis assays are important for identification of potential angiogenic agents and screening for pharmacological inhibitors. Among these assays, the rat aortic ring model (Nicosia and Ottinetti, 1990) bridges the gap between in vivo and in vitro models. On this system, rat aortic rings cultured in collagen gel give rise to microvascular networks composed of branching endothelial channels. By using intact vascular explants, it reproduces more accurately the environment in which angiogenesis takes place than those with isolated endothelial cells. The quantification of angiogenesis on this system implies the determination of: (i) the number and length of branching microvessels; (ii) the size and form of aortic rings and (iii) the number and spatial distribution of fibroblast-like cells. To our knowledge, quantification on the aortic ring model has been performed according to the three following approaches: (i) manual processing and measurement (Kobayashi et al., 1998; Brown et al., 1996); (ii) global characterisation (Bocci et al., 1999; Kruger et al., 2000) and (iii) automatic binary processing of grey level image and determination of the number and the total area of microvessels at a fixed distance from the aortic ring (Nissanov et al., 1995). Those kinds of quantification suffer from a number of practical difficulties. Mainly manual processing is slow, annoying and subjective. Nissanov et al. (1995) approach present the great advantages of being fully
automatic. Nevertheless, as noticed by the authors themselves, the vessel area determination, cannot allow to distinguish between increased vessel length and increased vessel number. The aim of the present
study is to develop an image-processing method,
which allows to extract vessels and fibroblast-like cells during spontaneous or modulated angiogenesis and to determine additional relevant parameters.
MATERIALS AND METHODS
10×MEM, 1.5 volumes of NaHCO3 (15.6 mg/ml) and approximately 0.1 volume NaOH (1 M) to adjust the pH to 7.4. The collagen gel cultures were first prepared in cylindrical agarose wells (Nicosia and Ottinetti,
1990) and kept in triplicates at 37°C in 100 mm
diameter Petri dishes (bacteriological polystyrene, Falcon, Becton Dickinson, Lincoln Park, New Jersey). The identification of endothelial cells was based on their ability to uptake low-density lipoprotein (LDL). Prior to sectioning and collagen embedding, aortas were incubated for 4 hours at 37 °C in a solution of 10 µg/ml acetylated-LDL labelled with the fluorescent probe 1,1'-dioctadecyl-3, 3,3’, 3’-tetramethyl-indocarbocyanine perchlorate (Dil-Ac-LDL) (Biomedical Technologies Inc., Stoughton, Massachussets) (Voyta at al., 1984). Cultures were then examined by fluorescent microscopy using rhodamine excitation and emission filters. Aortic ring and microvascular endothelial cells were fluorescent whereas the intensity of fibroblast-like cells (smooth muscle cells and pericytes) was only slightly above background levels.
The aortic outgrowth was evaluated in the presence of vascular endothelial growth factor (VEGF, Sigma) added to the culture medium (5-20 ng/ml) immediately after aortic ring embedding. The cultures were kept at 37°C in a humidified environment for two weeks and examined every second day by phase contrast microscopy with an Olympus microscope. Image analysis was performed on a WorkStation Sun SPARC30, using the software ‘Visilog5.0’ from Noesis.
Images were digitised in 760×540 with 256 grey
levels. Grey level image transformation and binary image processing have been carrying out using traditional tools and mathematical morphology (Coster and Chermant, 1985). Testing was conducted by using at least triplicate culture per condition.
RESULTS
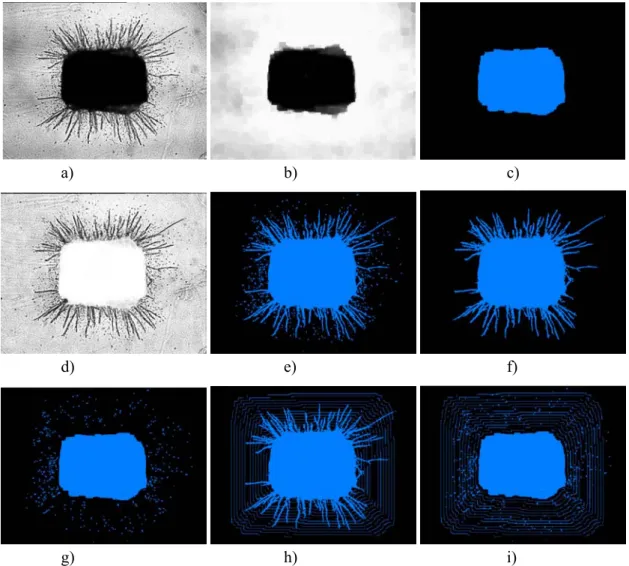
Fig. 1a shows a typical image of an aortic ring at day 10 of culture, giving rise to branching microvessels, surrounded by elongated fibroblast-like isolated cells. Binary images have been performed by the two-step procedure i.e., aortic ring extraction on the one hand, and microvessels and fibroblast-like cells extraction on the other hand. For the aortic ring extraction, a closing transformation was applied to smooth the background and eliminate microvessels and fibroblast-like cells (Fig. 1b). Then, the image was binarized using the threshold which maximizes the interclass variance of the grey levels (Otsu, 1979) (Fig. 1c). To extract microvessel and fibroblast-like
cells the following steps were performed: the closed image (Fig. 1b) was subtracted from the original image (Fig. 1a) and the resulting image was binarized using the Otsu method (Otsu, 1979). Fig. 1e shows the resulting image after the elimination of artefacts located at the border of the image. An opening transformation was then used to filter fibroblast-like cells (Fig. 1g). Using this last image as a marker, the microvessel image is obtained by a reconstruction operation (Fig. 1f). Finally, the fibroblast-like cells image (Fig. 1g) results from the difference between the total binary image (Fig. 1e) and the image of microvessels (Fig. 1h).
After the generation of binary images, the aortic ring area (A) and the shape factor (F) defined as F = perimeter2/4πA (Serra, 1982) have been measured. The microvessels and fibroblast-like cells were then quantitatively studied, depending on the vascular network complexity (a, and b below) acknowledged in this work: a) Spontaneous angiogenesis (e.g., Fig. 1a, 2a). In
this case, aortic outgrowth is evaluated without adding any exogenous factor. Each microvessel with its branching can be clearly identified. The
number of microvessels (Nv), their maximal
length (Lmax), and the total number of branching (Nb) have been measured. To achieve this goal, the number of intersections (Ni) of microvessels with a grid defined as the successive boundaries of the aortic ring n-dilate (n = 1, 2, 3…) was considered (Fig. 1h). In this construction, allowing to take into account the particular geometry of the studied aortic ring, increasing boundaries correspond to increasing distances D
to the aortic ring. The Ni value at a fixed
mode (most probable value of d) (d); (iii) the skewness (sk), which describes the symmetry of
the distribution (sk = 0 for symmetrical
distributions, sk < 0 or sk > 0 for nonsymmetrical distributions with the longer “tail” of the curve to the left or to the right, respectively) and (iv) the kurtosis (k) which describes how flat or peaked the distribution is (k = 0 for a gaussian distribution, k < 0 for a flat distribution and k > 0 for a peaked one). In our study, D corresponds to the distance from the explant at which Ni or Nf reach its mean value, d corresponds to the distance from the explant at which most cells migrated, a positive sk value indicates that most cells migrate at distances lower than D and k indicates the cell dispersion around d.
b) Induced-angiogenesis (e.g., Fig. 3a). In this case,
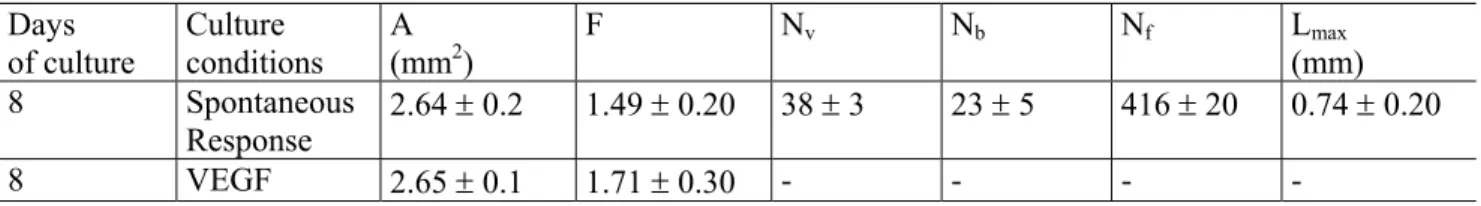
microvessel outgrowth is evaluated after addition of a well-known pro-angiogenic molecule (VEGF). Each microvessel displayed a large number of branchings elongated in all directions. Consequently, the microvascular network formed a complex interconnected structure, in which the measurement of Nv, Nb and Lmax were meaningless. Accordingly, only Ni(D) has been determined. Angiogenic parameters were automatically evaluated on rat aortic rings after 8 of culture in the following situations: (i) a spontaneous angiogenic response and (ii) a VEGF-induced angiogenesis. From Table 1, it must be noticed that the area A and the shape factor F had almost the same value for each set of experiment. This allows to assert that results did not depend on the particular size or geometry of the aortic rings.
a) b) c)
d) e) f)
g) h) i)
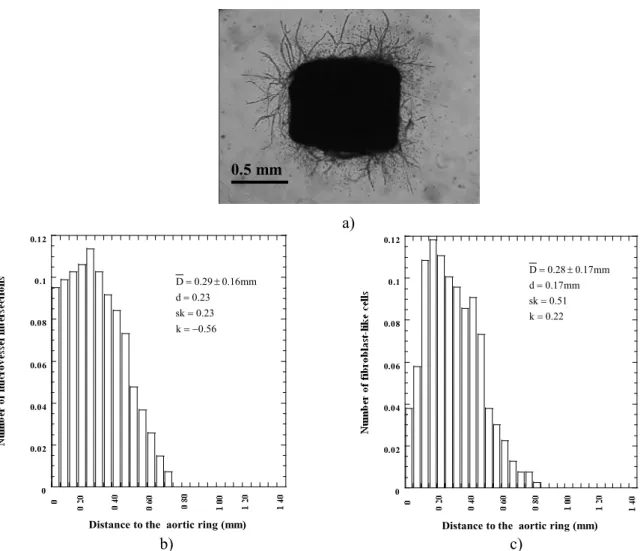
After 8 days of culture, aortic explants embedded in collagen gels gave rise to capillary-like structures with isolated fibroblast-like cells, primarily confined in periaortic location (Fig. 2a). In this case, all the parameters linked to endothelial sprouting (Nv, Nb, Lmax), and fibroblast-like cells (Nf) can be clearly determined (Table 1).
The complexity of the vascular network and fibroblast migration is quantifiedby the analysis of the Ni(D) and Nf (D) functions. Ni (D) has a peak (k < 0)
nearby the aortic ring (d = 0.23 mm) and then
decreases (sk = 0.23) (Fig. 2b). This indicates that the structure was rather ordered, i.e., microvessels were short and had few branching. Compared to the Ni (D) function, the Nf(D) is shifted, has a rather flat peak (k>0) centred at d = 0.17mm, and then decreases less steeply than Ni (D) (sk = 0.51). Nf (D) reached its smallest values at distances corresponding approximately to Lmax (Fig. 2c and Table 1).
In order to apply our quantification method to induced angiogenesis, rat aortic rings were cultured in the presence of VEGF164 (20 ng/nl), a key regulator of angiogenesis (Fig. 3a). In this case, a notable increase of network complexity was observed. As shown in Fig. 3a the interconnected microvessels prevented to determine accurately Lmax.Nevertheless, a qualitative value of 1.3 mm corresponding to the distance at which the last intersection was observed has been measured. A comparison between Figs. 2b and 3b show that the Ni (D) function corresponding to the stimulated sample is shifted, extends towards the long distances, and is more peaked (increased values
of
D
, sk, k, and (D
-d)), compared to thenon-induced cultures (spontaneous angiogenesis).
Indeed, Ni (D) increases at short distances from the aortic ring (in the range 0-0.26 mm), reaches a maximum (d = 0.26 mm) and then decreases slowly at longer distances (in the range 0.5-1.4 mm). This
shape is the signature of an interconnected network. Consequently, higher the broadness of the maximum, higher thenetwork complexity is.
Indeed, Ni (D) increases at short distances from the aortic ring (in the range 0-0.26 mm), reaches a maximum (d = 0.26 mm) and then decreases slowly at longer distances (in the range 0.5-1.4 mm). This shape is the signature of an interconnected network. Consequently, broader is the maximum, more complex thenetwork is.
DISCUSSION
This method allows to quantify number, branching, length, and the outgrowth of microvessels. Moreover, the shape of Ni (D) appears as an indicator of the degree of complexity of the vascular network. When microvessels grow radially, as in the spontaneous angiogenic response, Ni(D) displays a peak which is close to the aortic ring and decreases monotonically. On the contrary, when a branched structure is observed, as after VEGF-stimulation of angiogenesis, Ni (D) has a peak at longer distance from the explant. In this situation, maximal Ni value corresponds to maximal network density. Consequently, the broader the peak is, the more complex the structure of intertwined branching should be expected. It must be noticed that this method is valuable on a microscopic level at which both the explant and the microvessels structure are
observed. At the vascular level, at which only a
portion of the structure is observed, microvessels and fibroblast cannot be determined. The present work demonstrates that the particularities of each Ni (D) function can be described by statistical parameters that allow comparing various experimental situations, and characterise the network complexity. The advantage of this technique is that it allows the quantification and positioning of fibroblast-like cells.
Table 1.Image analysis quantification of angiogenesis in the rat aortic assay. Days
of culture
Culture conditions
A
(mm2) F Nv Nb Nf L(mm)max
8 Spontaneous
Response 2.64 ± 0.2 1.49 ± 0.20 38 ± 3 23 ± 5 416 ± 20 0.74 ± 0.20
-0.5 mm
a)
b) c)
Fig. 2. a) Spontaneous angiogenesis. b) the number of microvessel intersections in function of the distance to the aortic ring (Ni(D)), c) the number of fibroblast-like cells in function of the distance to the aortic ring (Nf(D)).
a) b)
Fig. 3. a) VEGF-induced angiogenesis, b) Ni (D) in the VEGF-treated cultures.
0 0.02 0.04 0.06 0.08 0.1 0.12
Distance to the aortic ring (mm) 0
0.02 0.04 0.06 0.08 0.1 0.12
Distance to the aortic ring (mm)
22 . 0 k
51 . 0 sk
mm 17 . 0 d
mm 17 . 0 28 . 0 D
= = =
± =
56 . 0 k
23 . 0 sk
23 . 0 d
mm 16 . 0 29 . 0 D
− =
= =
± =
0 0.02 0.04 0.06 0.08 0.10 0.12
Distance to the aortic ring (mm)
D= 0.54 ± 0.33 mm d = 0.26 mm sk = 0.83 k = 0.33
REFERENCES
Bocci G, Danesi R, Benelli U, Innocenti F, Di Paolo A, Fogli S, Del Tacca M (1999). Inhibitory effect of suramin in rat models of angiogenesis in vitro and in vivo. Cancer Chemother Pharmacol. 43:205-12. Brown KJ, Maynes SF, Bezos A, Maguire DJ, Ford MD,
Parish CR (1996). A novel in vitro assay for human angiogenesis. Lab Invest 75:539-55.
Coster M, Chermant JL (1985). Précis d’analyse d’images. Paris: CNRS.
Himmelblau DM (1970). Process Analysis by statistical methods. New York: Wiley.
Kobayashi S, Fukuta M, Kontani H, Yanagita S, Kimura I (1998). A quantitative assay for angiogenesis of cultured choroidal tissues in streptozotocin-diabetic wistar and spontaneously diabetic GK rats. Jpn J Pharmacol 78:471-8.
Kruger EA, Duray PH, Tkosos MG, Venzon DJ, Libutti SK, Dixon SC, Rudek MA, Pluda J, Allegra C, Figg W (2000). Endostatic inhibits microvessel formation in
the ex vivo rat aortic ring angiogenesis assay. Biochem Biophys Res Commun 268:183-91.
Montesano R, Orci L, Vassali P (1983). In vitro rapid organisation of endothelial cells into capillary-like networks is promoted by collagen matrices. J Cell Biol 97:1648-52.
Nicosia RF, Ottinetti AA (1990). Growth of microvessels in serum-free matrix culture of rat aorta: a quantitative assay of angiogenesis in vitro. Lab Invest 63:115-22. Nissanov J, Tuman RW, Gruver LM, Fortunato JM (1995).
Automatic vessel segmentation and quantification of the rat aortic ring assay of angiogenesis. Lab Invest 73:734-9.
Otsu N (1979). A threshold selection methods from gray-level histograms. IEEE Trans Syst Man Cybern 9:62. Serra J (1982). Image analysis and mathematical morphology.
Vol. 1. Academic press, Inc.