129
BENCHMARK FOR COUNTRY-LEVEL EARTHQUAKE
STRONG-MOTION INSTRUMENTATION PROGRAM
Widjojo Adi Prakoso
*)and I Nyoman Sukanta
1. Civil Engineering Department, Faculty of Engineering, Universitas Indonesia, Depok 16424, Indonesia 2. Agency for Meteorology, Climatology and Geophysics of Indonesia, Jakarta 10720, Indonesia
*)
E-mail: [email protected]
Abstract
An empirical study to develop benchmark models at country-level to assess the suggested number of earthquake strong-motion stations based on a framework encompassing geographic, demographic, and socio-economic parameters is reported. The models are to provide a working estimate of the required number of stations for improving the strong-motion instrumentation program of Indonesia. National earthquake strong-strong-motion networks of New Zealand, Japan, Taiwan, Iran, Turkey, and Italy were used as the references. The parameter proposed is the number of stations in land area of 1,000 km2, and three models based on the exponential regression analysis are presented as functions of population density, Gross Domestic Product (GDP) per capita, and the Global Competitiveness Index (GCI) Basic Requirements Index. Using the models, it is suggested that Indonesia would require at least 750 stations.
Abstrak
Model Acuan Tingkatan Negara untuk Program Sistem Pencatat Percepatan Gempabumi Kuat. Makalah ini memaparkan hasil pengembangan beberapa model acuan untuk menentukan jumlah stasiun pencatat percepatan gempabumi kuat pada tingkatan negara berdasarkan kondisi geografis, demografis, dan sosial-ekonomi. Beberapa model ini dapat digunakan dalam pengembangan lebih lanjut sistem pencatat gempa bumi kuat Indonesia. Dasar pengembangan model adalah sistem serupa di Selandia Baru, Jepang, Taiwan, Iran, Turki, dan Italia. Parameter jumlah stasiun pencatat yang diusulkan adalah jumlah stasiun per 1000 km2 luas daratan, dan tiga buah model regresi eksponensial telah dikembangkan berdasarkan fungsi kepadatan penduduk negara, fungsi Produk Domestik Bruto (PDB) per kapita, dan fungsi Indeks Daya-Saing Global(GCI) kelompok Persyaratan Dasar. Berdasarkan tiga model ini, jumlah minimum stasiun pencatat yang dibutuhkan adalah sekitar 750 stasiun.
Keywords: benchmark, earthquake, strong-motion network, strong-motion instruments
1. Introduction
The Government of Indonesia, following the 24 December 2004 Aceh earthquake, has started a strong-motion instrumentation program. The program would include the installation of about 500 strong-motion instruments by year 2014. These instruments were initially set up to serve as back-up instruments for the Indonesia Tsunami Early Warning System; 160 instruments are currently co-located with broadband seismometers. However, the latter deployment of the instruments is mostly for engineering purposes. The technical agency responsible for this program is the Agency for Meteorology, Climatology, and Geophysics of Indonesia and, at present, the number of instruments installed is 218 instruments.
financially prohibitive. Review of world-wide strong-motion stations [4-5] did not address these questions as well.
This paper reports an empirical study to develop benchmark models at country-level to assess the required number of strong-motion stations based on a framework encompassing geographic, demographic, and socio-economic parameters. The benchmark models are to address the adequacy of the current strong-motion instrumentation program and to provide a working estimate of the required number of strong-motion instruments for entire Indonesia for improving the program.
2. Methods
COSMOS [1] states five global siting considerations to optimize the location of strong-motion instrument stations, and the considerations relevant to this research are the following: likelihood of shaking; risk related to the existing infrastructure; and likelihood for casualties, death, or human suffering resulting from the fragility of the infrastructure. These considerations had to be modified to the country-level because the benchmarking was to be conducted for this level. In this study, a three step research method, in which seismic, geographic, and socio-economic aspects at country-level are used as proxies to these siting considerations, is developed.
The first step of the research method was to search for countries with openly published strong-motion instrumentation programs to deduct knowledge about how these countries have developed their programs. The
countries were New Zealand, Japan, Taiwan, South Korea, Iran, Turkey, Italy, the United States of America (USA), Canada, and Mexico. The programs considered were those at country-level, not at regional or local level. The next step was to examine the geographical distribution of stations for each country. As the goal is to develop a country-level benchmark, the stations in each referred country are installed relatively in the entire country to minimize biases in the benchmark models. Based on this criterion, the countries not considered further were USA, Canada, and Mexico; the stations in both USA and Mexico are mostly in the west coast areas, and those in Canada are mostly in the west coast area and Quebec.
Conditions of the further considered countries varied significantly, and the third step therefore was to search for common seismic, geographic, and socio-economic databases. The following are the referred databases: a) Seismic database: United States Geological Survey (USGS)–World Earthquake Information by Country/ Region [6], b) Geographic database: Central Intelligence Agency–The World Factbook [7], c) Socio-economic database: The Global Competitiveness Report 2011–2012 published by the World Economic Forum [8].
The seismic and geographic parameters considered are the 500-year return period peak ground acceleration and the land area, respectively. The socio-economic parameters are the population, Gross Domestic Product (GDP) per capita, and the Basic Requirements Index within the Global Competitiveness Index (GCI). It is noted that the first two parameters have been found to
Table 1. Seismic, Geographic, and Socio-Economic Data
Country
Peak Ground Acceleration (PGA) (m/sec2)
Number of Strong-Motion Stations
[Ref]
Land Area (km2)
Pop. (millions)
GDP (USD billions)/ GDP per capita
(USD)
GCI Basic Reqs.
New
Zealand 0.8-1.6 – >4.8
242 (operational), 41
(planned) = 283 [11-12] 267,710 4.3 140.4/32,145 5.66
Japan 0.4-0.8 – >4.8
1031 (K-Net), 692 (KIK-Net) = 1723 [2,13]
377,915 127.0 5,458.9/42,820 5.40
Taiwan 4.0-4.8 – >4.8 CMSMA: 40, TSMIP:
650 free-field [14] 32,260 23.2 430.6/18,458 5.69
Iran 1.6-2.4 – >4.8 1065 digital and 29 analog [15-16] 1,531,595 75.1 357.2/4,741 4.80
Turkey 0.8-1.6 – >4.8 327 [17] 783,562 75.7 741.9/10,399 4.61
Italy 0.4-0.8 – 2.4-3.2 (excl. Sardinia)
384 (2008) to 506
(2011) [3] 294,140 60.1 2,055.1/34,059 4.84
have correlations with casualties [9-10], while the last parameter was chosen to represent the country institution quality which has been found to correlate with casualties as well [9]. From the remaining seven countries, South Korea is the only country not in the USGS database and therefore it was not included in the final analysis. The seismic, geographic, and socio-economic data of the considered countries, as well of those of Indonesia, are shown in Table 1. The last step was to examine the data to develop benchmark models. The parameter proposed is the number of stations in land area of 1,000 km2.
3. Results and Discussion
The population density, GDP per capita, and the operational and planned stations (shown as the relative bubble for the number of stations in land area of 1,000 km2) for each country are shown in Figure 1. New Zealand, Italy, Japan, and Taiwan are countries with high GDP per capita and within the group of “innovation-driven” countries of the Global Competitiveness Index [8]. Turkey is within the group “transition to innovation-driven” countries, while Iran is within the group “transition to efficiency-driven” country. Taiwan is a very densely populated country, followed by Japan and Italy. Turkey and Iran are within the relative same range of population density, while New Zealand has a relative low population density.
The PGA of Taiwan is very high in the entire country. The PGA of Japan, New Zealand, Iran, and Turkey is within the same range, although it varies quite significantly within each country. The PGA of Italy is in the lower range, compared to that of the other considered countries.
The number of stations in land area of 1,000 km2 for Taiwan is significantly larger than that for the other countries; the logical explanation would be that Taiwan is a densely populated, and has a relatively high GDP per capita and high PGA ranges. Japan appears to have similar characteristics to Taiwan, and the number of stations is also high. Although its PGA ranges are not as high as the others, Italy is relatively densely populated and has high GDP per capita, and it is currently developing a dense strong-motion station network. New Zealand has high GDP per capita and relatively high PGA ranges, and it has deployed considerable number of stations. Iran and Turkey are relatively comparable among the considered countries, although Iran has deployed a denser strong-motion station network.
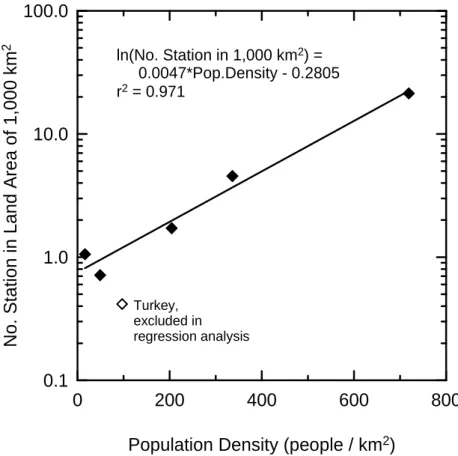
The population density and the GDP per capita, as well as the GCI Basic Requirements Index, are plotted against the number of stations in land area of 1,000 km2, as shown as Figures 2 through 4, respectively. In general, the figures indicate that, for each parameter, the
number of stations increases with an increase in the parameter. However, for the regression analyses, some countries were excluded as their data values appear not to be in the same general data trends. The population density versus number of stations data of Turkey was excluded because the data appears to be lower than the data general trend. The GDP per capita versus number of stations data of Taiwan was excluded because the data is much higher than the data general trend. The GCI Basic Requirements Index versus number of stations data of New Zealand was excluded because the data is much lower than the data general trend. Several regression analyses were performed, and the exponential regression analysis was found to consistently better than the other types of regression analyses. The results for the three parameters are as follows:
ln(No. Station in 1,000 km2) =
0.0047·(Population Density) – 0.2805 (1)
ln(No. Station in 1,000 km2) =
4.8495e-5 (GDP Per Capita) – 1.0236 (2)
ln(No. Station in 1,000 km2) =
3.3419 (GCI Basic Requirements Index) – 16.154 (3)
The r2 value of the regression analysis is shown in the respective figures.
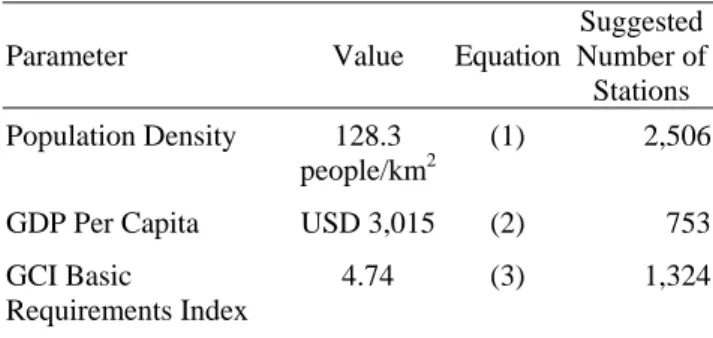
Indonesia is within the group of “efficiency-driven” countries of the Global Competitiveness Index [8], with a lower GDP per capita compared to the considered countries, while it has a relatively similar range of population density to Iran and Turkey; the position of Indonesia is also shown in Figure 1. The PGA of Indonesia is somewhat between the range for Japan, New Zealand, Iran, and Turkey and the range for Italy, and it varies rather significantly. The population density, GDP per capita, and GCI Basic Requirements Index, as well as the benchmarking results, of Indonesia are given in Table 2. The suggested number of stations varies from 753 stations to 2,506 stations. Given that the GDP per capita and the GCI Basic Requirements Index of Indonesia are not relatively high yet and that the variation of PGA is rather significant, it is recommended
Table 2. Benchmarking Results for Indonesia
Parameter Value Equation
Suggested Number of Stations Population Density 128.3
people/km2
(1) 2,506
GDP Per Capita USD 3,015 (2) 753
GCI Basic
Requirements Index
0
200
400
600
800
Population Density (people / km
2)
0
10
20
30
40
50
GDP Per Capi
ta (USD × 1,000)
Japan
PGA = 0.4 - >4.8 m/s2
Italy
PGA = 0.4 - 3.2 m/s2
New Zealand
PGA = 0.8 - >4.8 m/s2
Taiwan PGA = 4.0 - >4.8 m/s2
Turkey
PGA = 0.8 - >4.8 m/s2
Iran, PGA = 0.8 - >4.8 m/s2
Indonesia, PGA = 0.2 - >4.8 m/s2
Figure 1. Mapping of Countries Considered in Benchmarking
0
200
400
600
800
Population Density (people / km
2)
0.1
1.0
10.0
100.0
No. S
tat
ion
in Land Area of
1,000
km
2
ln(No. Station in 1,000 km2) = 0.0047*Pop.Density - 0.2805 r2 = 0.971
Turkey, excluded in regression analysis
0
10
20
30
40
50
GDP Per Capita (USD × 1,000)
0.1
1.0
10.0
100.0
No.
St
ation
in Land Ar
ea
of 1,000 km
2
ln(No. Sta. in 1,000 km2) =
4.8495E-05*(GDP/Capita) - 1.0236 r2 = 0.762
Taiwan, excluded in regression analysis
Figure 3. Relationship between Number of Stations in 1,000 km2 Land Area and GDP Per Capita
4
5
6
7
GCI Basic Requirements Index
0.1
1.0
10.0
100.0
No. Station in Land
Area of
1,000 k
m
2 ln(No. Sta. in 1,000 km2) =
3.3419*(GCI-BRI) - 16.154 r2 = 0.947
New Zealand, excluded in regression analysis
at present that the lower bound value of about 750 strong-motion stations to be deployed for the Indonesian network. As the overall conditions of Indonesia would improve, a greater number of stations could be deployed in the future.
4. Conclusions
The development of empirical benchmark models at country-level to answer the adequacy of strong-motion instrumentation network for Indonesia is reported. This study uses a framework encompassing geographic, demographic, and socio-economic parameters as the basis. National strong-motion networks of New Zealand, Japan, Taiwan, Iran, Turkey, and Italy are used as the references. The parameter proposed is the number of stations in land area of 1,000 km2, and three models based on the exponential regression analysis are presented as functions of population density, GDP per capita, and the GCI Basic Requirements Index. The suggested number of stations for Indonesia varies from 753 stations to 2,506 stations. Given the current conditions of Indonesia, the lower bound value of about 750 strong-motion stations is recommended. Comparing this recommended value to the actual program, it is further recommended that the strong-motion instrumentation program of Indonesia is to be improved accordingly.
Acknowledgment
The work described in this paper was part of a research project supported by a grant from Universitas Indonesia (National Strategic Research Grant No. 1415/H2.R12/PPM.00.01 Sumber Pendanaan/2011). This work is the opinion of the authors and may not reflect the official opinion of the Agency for Meteorology, Climatology, and Geophysics of Indonesia.
References
[1] Consortium of Organizations for Strong-Motion Observation Systems (COSMOS), Guidelines for Installation of Advanced National Seismic System Strong-Motion Reference Stations, Richmond, 2001, p.40.
[2] National Research Institute for Earth Science and Disaster Prevention (NIED), Kyoshin Net (K-Net),
www.k-net.bosai.go.jp, 3 July 2011.
[3] A. Gorini, M. Nicoletti, P. Marsan, R. Bianconi, R. De Nardis, L. Filippi, S. Marcucci, F. Palma, E. Zambonelli, Bull. Earthq. Eng. 8 (2010) 1075. [4] M.D. Trifunac, M.I. Todorovska, Soil Dyn. Earthq.
Eng. 21 (2001) 537.
[5] M.D. Trifunac, Soil Dyn. Earthq. Eng. 29 (2009) 591.
[6] United States Geological Survey (USGS), World Earthquake Information by Country/Region,
earthquake.usgs.gov/earthquakes/world, 3 July 2011. [7] Central Intelligence Agency (CIA), The World
Factbook, www.cia.gov/library/publications/the-world-factbook, 3 July 2011.
[8] K. Schwab (Ed.), Global Competitiveness Report 2011-2012, World Economic Forum (WEF), Geneva, 2011, p.544.
[9] M.E. Kahn, Rev. Econ. Stat. 87 (2005) 271. [10] M.K. Rad, S.G. Evans, A. Brenning, Proceedings
of American Geophysical Union–Fall Meeting 2010, San Francisco, USA, 2010, abstract #NH12A-04.
[11] GNS Science, GeoNet, www.geonet.org.nz, 22 October 2011.
[12] T. Petersen, K. Gledhill, M. Chadwick, N.H. Gale, J. Ristau, Seismol. Res. Lett. 82 (2011) 9.
[13] National Research Institute for Earth Science and Disaster Prevention (NIED), Kiban-Kyoshin Net (KiK-Net), www.kik.bosai.go.jp, 3 July 2011. [14] K.-L. Wen, C.-F. Wu, H.-H. Hsieh, C.-M. Lin,
Proceedings of International Workshop for Site Selection, Installation, and Operation of Geotechnical Strong-Motion Arrays, Richmond, USA, 2004, p.51.
[15] H.M. Alavijeh, E. Farzanegan, Asian J. Civ. Eng. (Building and Housing) 4 (2003) 173.
[16] Building and Housing Research Center (BHRC), Iran Strong Motion Network,
www.bhrc.ac.ir/ismn/Index.htm, 22 June 2011. [17] S. Akkar, Z. Cagnan, E. Yenier, E. Erdogan, M.A.