The University of Vermont
A
B
ENCHMARKING
S
TUDY
U
SING
P
EER AND
C
OMPARATIVE
A
NALYSIS
Document Prepared by:
P
AULIEN
&
A
SSOCIATES
,
I
NC
.
Denver, Colorado
Daniel K. Paulien
, President
Yvonne M. Thibodeau,
Associate
Frank A. Markley,
Associate
Acknowledgments to:
The University of Vermont
John Bramley, Senior Vice President, ProvostRobert Vaughan, Director, Capital Planning and Management
Michelle Mullarkey, Assistant to the Director, Capital Planning and Management
Linda Seavey, Director, Campus Planning Services
Joanna Carney, Campus Space Manager
Susan Greenhalgh, Consultant
We also want to express our gratitude to those individuals at the benchmark institutions who expended their time and effort to participate in this benchmarking survey. Without their
A
B
ENCHMARKING
S
TUDY
U
SING
P
EER AND
C
OMPARATIVE
A
NALYSIS
August 2005
T
ABLE
O
F
C
ONTENTS
1.0
E
XECUTIVES
UMMARY... 1
1.1 Campuswide Benchmarking Results ... 1
1.2 Research Benchmarking Results ... 2
1.3 College and School Level Results... 2
2.0
O
BJECTIVE... 5
3.0
P
ROCESS... 5
3.1 Identification of Institutions and Survey Development ... 5
3.2 Survey Distribution and Collection of Responses ... 6
3.3 Benchmarking Defined ... 7
3.4 Benchmarking Analysis... 8
3.5 Assumptions and Conditions Used in This Analysis ... 9
4.1 Total ASF per Student FTE ... 11
4.2 Total ASF per Full-time (FT) Faculty ... 12
4.3 Research ASF and R&D Expenditures per Full-time Faculty Headcount... 13
4.4 College/School Benchmark Analysis... 14
4.4.1 College of Agriculture and Life Sciences ... 15
4.4.2 College of Arts and Sciences ... 17
4.4.3 School of Business Administration... 19
4.4.4 College of Education and Social Services ... 21
4.4.5 College of Engineering and Mathematics... 23
4.4.6 College of Engineering, Excluding Mathematics ... 24
4.4.7 College of Medicine ... 27
4.4.8 Rubenstein School of Environment and Natural Resources... 29
4.4.9 College of Nursing and Health Sciences... 31
4.5 Related Benchmarking Findings – Campuswide Spaces... 33
4.5.1 Classrooms ... 33
4.5.2 University Library ... 34
A
PPENDICES APPENDIX A COVER LETTER TO BENCHMARK INSTITUTIONS,QUESTIONNAIRE, AND INSTRUCTIONS... 37PAULIEN &ASSOCIATES,INC. Page 1
U
NIVERSITY OF
V
ERMONT
A
B
ENCHMARKING
S
TUDY
U
SING
P
EER AND
C
OMPARATIVE
A
NALYSIS
prepared by
P
AULIEN
&
A
SSOCIATES
,
I
NC
.
A
UGUST2005
1.0
E
XECUTIVE
S
UMMARY
As part of a larger study, the University of Vermont (UVM) retained Paulien & Associates, Inc. to conduct a peer and comparative analysis using benchmarking techniques. University planning staff approved 13 institutions from a list of more than 30 colleges and universities to form the sample of this study, The 13 comparison universities were selected based on similarity of academic units as compared to UVM. In each case, the main or flagship campus was selected for evaluation. The institutions were divided into three categories, Aspirants, Peers, and Private Universities. This report compared assignable square feet (ASF) at the college and school level in the three categories of institutions. Student FTE enrollment and full-time faculty were used to normalize the space data.
Student FTE enrollment, full-time faculty headcount, and detailed physical space data by college and school were secured from each of the institutions by an electronic spreadsheet. The 13 selected institutions were contacted via email and/or telephone and asked to participate in the study.
Twelve of the universities provided information for this study, a response rate of 92%. As a note, percentage comparisons between benchmarked institutions and UVM were calculated as the percent above or below UVM's stated number. The following summarizes the key results of the benchmarking analysis.
1.1
C
AMPUSWIDEB
ENCHMARKINGR
ESULTS¾ The five Aspirants, (institutions that UVM aspires to become more like) had the highest Total ASF and Student FTE, followed by Private Universities, and Peers. UVM is below the combined benchmarked averages.
¾ On average, the five Aspirant institutions reported 8,426,593total campus ASF, slightly less than three times the average amount of space of the five Peers while the two Private Universities were about twice the total ASF of the Peer Group. Total campus ASF for UVM was calculated at 1,930,806 ASF or 198% below the combined average of benchmarked institutions.
¾ The twelve benchmark institutions represented a wide diversity with respect to Student FTE enrollment. Student FTE reflects the number of credit hours or units taught for each subject or discipline, regardless of declared major. Ranges varied from a high of 39,246 FTE at Pennsylvania State University to a low of
Benchmark Institutions
Aspirants
University of Michigan - Ann Arbor University of North Carolina - Chapel Hill Pennsylvania State University - State College University of Virginia - Charlottesville University of Wisconsin - Madison
Peers
University of Connecticut - Storrs University of Delaware - Newark Kansas State University - Manhattan University of Massachusetts - Amherst Oklahoma State University - Stillwater University of Rhode Island - Kingston Priva te Unive rsitie s
Boston University
PAULIEN &ASSOCIATES,INC. Page 2 11,867 FTE at the University of Rhode Island. The average Student FTE for all 12 benchmark institutions was 23,378 FTE, considerably higher than UVM’s 9,647 student FTE.
¾ When total ASF was standardized by Student FTE,
UVM’s ASF/FTE ratio was 39% lower than the Aspirants (200 vs. 279 ASF/FTE) but 13% higher than the Peer Groups average of 175 ASF/FTE. In direct comparison to the average of all benchmark institutions combined, UVM was 38 ASF/FTE or 19% lower. These results are presented graphically in the chart labeled ASF/Student FTE Comparisons.
¾ When total ASF is standardized by full-time faculty, UVM’s ratio was lower than the average of each benchmark group. UVM’s 1,968 ASF/Faculty was 75% less than the Aspirants and 54% less than the five Peers. On average, UVM had 1,288 ASF per faculty or 65% less space per full-time faculty than of all benchmark institutions combined.
1.2
R
ESEARCHB
ENCHMARKINGR
ESULTSIn this comparative analysis, all research laboratory spaces (academic and administrative) were combined and normalized by the number of full-time faculty, creating total research lab ASF per full-time faculty.
¾ The range of research laboratory ASF per full-time faculty extended from a low of 192 ASF/Faculty at Boston University to a high of 844 ASF/Faculty at the University of Wisconsin. Overall, UVM with 299 ASF/Faculty was below the average of each group. For example, UVM had 51% less space per faculty than combined benchmark institutions. The benchmarked institutions designated 451 ASF/Faculty to research space, compared to 299 ASF/Faculty at UVM.
¾ When total R&D expenditures (FY 2002) were analyzed, the 12 institutions, with a combined average $139,164 of R&D expenditures per full-time faculty, were more productive than UVM’s $90,318 in R&D expenditures per faculty.
1.3
C
OLLEGE ANDS
CHOOLL
EVELR
ESULTSEach benchmark institution provided detailed space data at the college and school level. Since no two universities had the same organizational structure and academic departments, data from more than 75 unique colleges and schools were collected from the 12 universities. Colleges and schools that were not direct comparisons to UVM’s programs are not summarized in this report. Each college was analyzed for comparability with UVM’s six colleges and two schools. This summary provides an overview of the results. Detailed findings are described in the main body of the report.
Chart No. 1 illustrates graphically the results of the analysis. Each of eight colleges and schools at UVM are listed across the bottom of the graph. The solid line represents the high and low ASF per Student FTE for each program as secured from the selected institutions. The middle of the triangle delineates UVM’s ASF for that college or school.
Aspirants Peer's Private Universities UVM All Peers 0 50 100 150 200 250 300 A S F/S tude nt FTE
ASF/Student FTE Comparisons
Aspirants Peer's Private Universities UVM All Peers 0 500 1,000 1,500 2,000 2,500 3,000 3,500 A S F/Faculty ASF/Faculty Comparisons
PAULIEN &ASSOCIATES,INC. Page 3 As an example, for the College of Agriculture and Life Sciences, the highest point on the vertical line (611 ASF/FTE) was reported by Penn State University while the lowest point on the vertical line (279 ASF/FTE) was reported by the University of Delaware. The College of Agriculture and Life Sciences within the University of Vermont was calculated at 376 ASF/FTE, as noted by the triangle in the Chart No. 1.
Colleges and Schools of Agriculture, Engineering & Math, and Medicine had the largest variance in ASF per Student FTE, suggesting inclusion of other programs and activities within these colleges. There is also the issue of how on-campus land grant mission functions are incorporated with these colleges. On the other hand, Arts and Sciences, Education, Nursing, Environment & Natural Resources, and Business Administration are more tightly clustered.
Chart No. 1
Comparative Analysis of College/School Summary by Student FTE
0 100 200 300 400 500 600 700 800 900 1000 Agricu lture and Life Scienc es Arts & Scien ces Educ atio n an d So cial Serv ices Engi neer ing & Ma th Nur sing & Hea lth S cien ces Envi ronm ent & N atur al Re sou rces Busin ess A dmini strat ion Medi cine Cam pus Tot al A S F pe r S tude nt F T E
Peer High/Low Range
UVM
¾ The College of Nursing and Health Sciences ASF per student was calculated to be 12% above benchmark institution averages. The benchmark average is noted as approximately the middle of the high/low range.
¾ Total ASF per Student FTE for two of UVM’s Colleges and Schools were slightly below comparable benchmark institutions. The Colleges of Agriculture and Life Sciences (21% below average), and the College of Medicine (6% less than average) were below the average of the square feet per student range when compared to benchmark institutions.
Peer Rankings of UVM Schools and Colleges ASF/Student FTE College/School Total Number of Institutions In Analysis UVM Overall Ranking Among Institutions
Agriculture and Life Sciences 8 6th
Arts and Sciences 13 13th
Business Administration 13 8th
Education and Social Services 12 7th
Engineering and Mathematics 12 12th
Environment and Natural Resources 3 3rd
Medicine 6 4th
PAULIEN &ASSOCIATES,INC. Page 4 ¾ Three UVM schools and colleges were below benchmark averages. The School of Business
Administration (106% below average), the College of Arts and Sciences, (71% below average), and the College of Education and Social Services, (39% below average) were further below the average of the square feet per student range when compared to benchmark institutions.
¾ Two UVM programs were considered to be at the lower end of the benchmark average. These include the College of Engineering and Mathematics (183% below average) and the School of Environment and Natural Resources (131% below average).
A summary of rankings is provided in the previous table. UVM, along with the other benchmark institutions in the study, was rank ordered in terms of ASF/Student FTE. For the College of Agriculture and Life Sciences, a total of eight institutions (including UVM) were included in the benchmark study. UVM’s program ranked sixth among the eight universities in ASF/Student FTE.
Detailed comparative analysis by space categories are discussed in the report body. Benchmark comparisons of campus classrooms and library spaces were also collected and analyzed in this report. Comparative tables are located in the last section of this report.
When ASF per full-time faculty is summarized, the results are mixed:
¾ UVM’s College of Agriculture and Life Sciences and the School of Environment and Natural Resources was near the lower middle of benchmark averages. The benchmark average is noted as approximately the middle of the high/low range. If Animal Quarters, Field Buildings, and Greenhouses are removed from the comparison, UVM drops lower in the Agriculture comparative rankings.
¾ All of the other Colleges and Schools were well below benchmark averages with respect to ASF/Faculty.
¾ The College of Engineering and Mathematics was 233% below benchmark institutions ASF/Faculty average and was outside of the high/low range. Similar findings were found for the College of Education and Social Sciences, and the College of Medicine.
Chart No. 2
Comparative Analysis of College/School Summary by Faculty Headcount
0 1000 2000 3000 4000 5000 6000 7000 Agric ultur e an d Life Scienc es Arts & Sc ience s Edu catio n an d Soc ial S ervi ces Eng ineer ing & Mat h Nur sing & He alth S cien ces Env ironm ent & Na tura l Res ources Busines s Adm inistr atio n Med icine Cam pus T otal A SF pe r F acu lt y H ead co u n t
Peer High/Low Range
UVM
Similar to ASF per Student FTE comparisons, detailed analysis of ASF per faculty, including space categories, are discussed in the report body.
PAULIEN &ASSOCIATES,INC. Page 5
2.0
O
BJECTIVE
In March of 2004, the University of Vermont retained Paulien & Associates, Inc. to conduct a classroom and laboratory utilization and space needs analysis. This benchmarking study was included as an integral part of the project. Authorization to proceed with the benchmarking study in the Fall of 2004 followed. The focal point of this study is the University of Vermont. This report contains peer and comparative analyses using benchmarking techniques with 12 of the 13 selected institutions; which included five Peers and five Aspirants. Two Private Institutions were also used to obtain a broader range of values.
The objective of this study is to analyze how UVM’s existing space at the college/school level compares to each of the selected benchmark institutions.
3.0
P
ROCESS
3.1
I
DENTIFICATION OFI
NSTITUTIONS ANDS
URVEYD
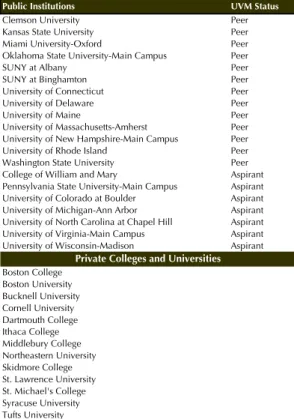
EVELOPMENTAt the onset of this study, UVM identified 20 public institutions and 14 private institutions that were potential inclusions into the benchmark study. Of the 20 public peers and aspirants, 12 were "peers" and 8
were "aspirants". The 12 peers were derived from a multivariate statistical analysis (cluster analysis) using 125 variables (admissions, quality, enrollment, degrees awarded, faculty, salary, financial, etc.). The 8 aspirants were schools were identified using several criteria: some were previously identified with UVM as a "public ivy"; strong national reputation; similarity of mission; survey of UVM deans for schools they viewed as aspirants for both UVM and their specific college or school. The private institutions provided by UVM were selected based on multi-year trends in the volume cross-applications and cross-admits with the University of Vermont. The initial list of institutions is illustrated in Table No. 1.
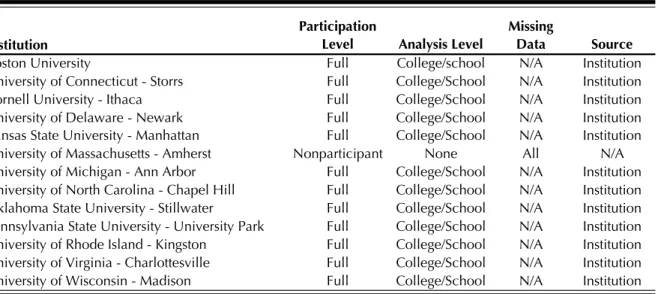
Since the objective of the study was to analyze how UVM’s existing space at the college/school level compared to each of the selected benchmark institutions, the consultant developed a matrix for each institution, highlighting similarities of schools and colleges that were aligned with UVM. The institutions that closely mirrored UVM’s academic structure were selected for the benchmark study. UVM planning staff approved the final list before commencing with the study. The final list of institutions is noted in Table No. 2. With the exceptions of the University of Michigan, University of North Carolina, University of Virginia, and Boston University, all the institutions in the study are land grant universities.
Once the list of benchmark institutions was finalized, Paulien & Associates, Inc. developed a list of facilities data needed to conduct the benchmarking study. An electronic spreadsheet was developed, along with an explanatory cover letter, detailed instructions, and Glossary of Terms. A copy of the Peer Analysis Questionnaire, letter of introduction, and instructions are included in Appendix A while the Glossary of Terms is included in Appendix B.
Table No. 1 Initial List of Institutions for Benchmarking Study
Public Institutions UVM Status
Clemson University Peer
Kansas State University Peer
Miami University-Oxford Peer
Oklahoma State University-Main Campus Peer
SUNY at Albany Peer
SUNY at Binghamton Peer
University of Connecticut Peer
University of Delaware Peer
University of Maine Peer
University of Massachusetts-Amherst Peer University of New Hampshire-Main Campus Peer
University of Rhode Island Peer
Washington State University Peer
College of William and Mary Aspirant
Pennsylvania State University-Main Campus Aspirant University of Colorado at Boulder Aspirant University of Michigan-Ann Arbor Aspirant University of North Carolina at Chapel Hill Aspirant University of Virginia-Main Campus Aspirant University of Wisconsin-Madison Aspirant Boston College Boston University Bucknell University Cornell University Dartmouth College Ithaca College Middlebury College Northeastern University Skidmore College St. Lawrence University St. Michael's College Syracuse University Tufts University University of Rochester
Source: UVM Office of Institutional Studies
PAULIEN &ASSOCIATES,INC. Page 6
3.2
S
URVEYD
ISTRIBUTION ANDC
OLLECTION OFR
ESPONSESThe electronic spreadsheet requested space data in assignable square feet (ASF) at the college, school, unit, or division level by space categories based on room use codes as outlined in the National Center for Education Statistics Postsecondary Education Facilities Inventory and Classification Manual. The questionnaire also queried for total campus ASF as well as pooled/centralized classrooms, residential, university library, athletics, and physical education/recreation spaces. The electronic spreadsheet was customized for each institution by highlighting the specific colleges/schools unique to each university that was selected for this study.
UNIVERSITY OF VERMONT • PEER BENCHMARKING ANALYSIS
Table No. 2 Benchmark Institution List
Institution
Participation
Level Analysis Level
Missing
Data Source
Boston University Full College/school N/A Institution
University of Connecticut - Storrs Full College/School N/A Institution
Cornell University - Ithaca Full College/School N/A Institution
University of Delaware - Newark Full College/School N/A Institution
Kansas State University - Manhattan Full College/School N/A Institution
University of Massachusetts - Amherst Nonparticipant None All N/A
University of Michigan - Ann Arbor Full College/School N/A Institution
University of North Carolina - Chapel Hill Full College/School N/A Institution
Oklahoma State University - Stillwater Full College/School N/A Institution
Pennsylvania State University - University Park Full College/School N/A Institution
University of Rhode Island - Kingston Full College/School N/A Institution
University of Virginia - Charlottesville Full College/School N/A Institution
University of Wisconsin - Madison Full College/School N/A Institution
The consultant asked each participant to supply full-time faculty headcount and student full-time equivalent (FTE) data. In some cases, this information was verified by the consultants to reduce errors. It should be noted that FTE was calculated based on the number of credits or units generated in each subject or discipline, regardless of a student’s major. For example, a student majoring in engineering who took two English courses would have those student credits stay with the English Department in the College of Arts and Sciences.
Survey Distribution and Collection of Responses
The consultants organized names, phone numbers, and email contacts for campus representatives at each of the 13 identified institutions. Surveys were sent electronically to higher level administrators (vice chancellors, vice presidents) who were able to make concrete decisions about participation in the study. In some cases, surveys were sent to the University Architect’s office or representatives of the physical planning office. To maximize the number of positive responses, whenever possible, questionnaires were sent to the person on campus with whom the consultants had previously been acquainted. Respondents were given approximately three weeks to complete the survey.
After the survey had been sent to each identified institution, representatives were contacted by phoneand/or by email to verify their willingness to participate in the study. Additional follow-up calls were made by the consultants to clarify questions or concerns regarding the requested data. It is important to note that the consultants agreed to share selected results of this study as an incentive for participation.
Initially, all 13 institutions agreed to participate in the study. Twelve of the 13 institutions fully completed the questionnaire as described in the instructions. They are noted in Table No. 2 as providing full participation. Initially, the University of Massachusetts agreed to participate but failed to respond due to staffing changes. The consultants downloaded some facility data, student FTE and faculty headcount data for the institution. They are listed in Table No. 2 as a non-participant and were excluded from the study.
PAULIEN &ASSOCIATES,INC. Page 7 Data for UVM was obtained by the consultants from student FTE reports, staffing files and space inventories supplied by the University. Consultants summarized the data files to fit the format of the electronic questionnaire. The data were current as of fall 2004.
3.3
B
ENCHMARKINGD
EFINEDBenchmarking is a tool that has been used in industry for many years. More recently, extraordinary challenges and the need to develop new ways to demonstrate accountability have forced higher education institutions to begin using many of the same concepts. Definitions of benchmarking vary depending on the focus of the study. Jackson and Lund (2000) describe benchmarking as comparing organizational or industry practices, performance, and process in order to improve the focal organization or business. Schuler (1998) defined benchmarking as “a structured approach for looking outside an organization to study and adapt the best outside practices to complement internal operations with new, creative ideas” (p. 40). For purposes of this study, benchmarking is defined as making direct comparisons with other similar institutions in order to improve or adapt to best practices and to understand quantitatively existing conditions, as compared to other selected higher education institutions. These existing conditions include full-time faculty, research expenditures, student FTE, and physical space.
The literature provides three reasons for making such comparisons:
¾ Assessment - Provides a context to make better sense of an institution’s outcomes and achievements. ¾ Innovation – Provides new insights into ways of thinking and working.
¾ Change – Provides a context for promoting institutional change.
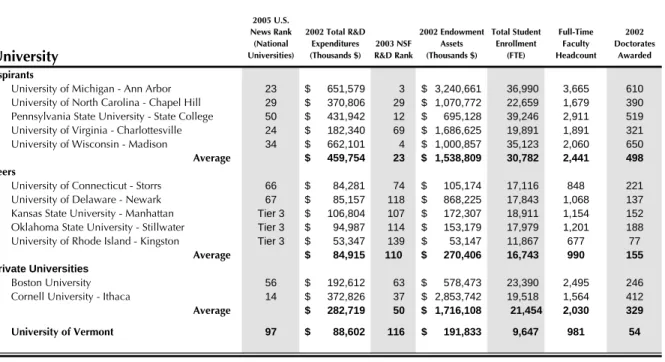
Table No. 3 provides selected data on each of the benchmark institutions in this report. This data serves as an initial point of comparison between institutions before moving into the comparative findings of the study. In many instances, these indicators measure the degree of excellence or prominence of a university. The consultants obtained total R&D expenditures and rankings for fiscal year 2002 through online reports from the National Science Foundation, Division of Science Resources Statistics, Survey of Research and Development Expenditures at Universities and Colleges. In some cases, these data were adjusted by the consultant to reflect conditions outlined in the instructions to benchmark institutions. These changes include:
• Cornell University R&D Expenditures were for FY2003 and excluded the Medical College in NYC. • University of Connecticut R&D Expenditures excluded the UConn Health Center in Farmington. • R&D Expenditures for the University of North Carolina and Boston University included the School
of Medicine.
• R&D Expenditures for Penn State excluded the College of Medicine in Hershey and the College of Law in Carlisle as well as other system campuses, but included the Applied Research Laboratory with $108,991,000 in expenditures.
• University of Michigan R&D Expenditures excluded Dearborn and Flint campus totals.
Endowment data was obtained from the National Association of College and University Business Officers (NACUBO) Endowment Study as reported in the Chronicle of Higher Education for the year ending June 30, 2002. Full-time faculty and Student FTE enrollment data were self-reported from the questionnaire for institutions that participated fully in the study. Full-time faculty and Student FTE data for the University of Massachusetts was obtained from the institution’s web site. Doctorates awarded were secured from the NCS, IPEDS Completions Survey, doctoral degrees awarded between July 1, 2001 and June 30, 2002. The benchmark institutions were divided into three categories. It is worth noting the average differences between the three categories on each of the measures. Due to these differences, the consultant will present the results of the benchmarking study using the categories of Aspirants, Peers, and Private Universities. The first observation of note is that UVM has the lowest student enrollment level of all colleges and universities in the study but a higher full-time faculty headcount than the University of Connecticut and the
PAULIEN &ASSOCIATES,INC. Page 8 University of Rhode Island. However, the higher faculty headcount does not translate to a greater number of doctorates awarded as UVM is the lowest among all benchmark institutions. On average, total R&D expenditures for the Peers category ($84,915,000) are comparable to those at UVM with $88,602,000 in expenditures.
Table No. 3
Selected Characteristics of Benchmark Institutions
University 2005 U.S. News Rank (National Universities) 2002 Total R&D Expenditures (Thousands $) 2003 NSF R&D Rank 2002 Endowment Assets (Thousands $) Total Student Enrollment (FTE) Full-Time Faculty Headcount 2002 Doctorates Awarded Aspirants
University of Michigan - Ann Arbor 23 $ 651,579 3 $ 3,240,661 36,990 3,665 610 University of North Carolina - Chapel Hill 29 $ 370,806 29 $ 1,070,772 22,659 1,679 390 Pennsylvania State University - State College 50 $ 431,942 12 $ 695,128 39,246 2,911 519 University of Virginia - Charlottesville 24 $ 182,340 69 $ 1,686,625 19,891 1,891 321 University of Wisconsin - Madison 34 $ 662,101 4 $ 1,000,857 35,123 2,060 650
Average $ 459,754 23 $ 1,538,809 30,782 2,441 498 Peers
University of Connecticut - Storrs 66 $ 84,281 74 $ 105,174 17,116 848 221 University of Delaware - Newark 67 $ 85,157 118 $ 868,225 17,843 1,068 137 Kansas State University - Manhattan Tier 3 $ 106,804 107 $ 172,307 18,911 1,154 152 Oklahoma State University - Stillwater Tier 3 $ 94,987 114 $ 153,179 17,979 1,201 188 University of Rhode Island - Kingston Tier 3 $ 53,347 139 $ 53,147 11,867 677 77
Average $ 84,915 110 $ 270,406 16,743 990 155 Private Universities
Boston University 56 $ 192,612 63 $ 578,473 23,390 2,495 246 Cornell University - Ithaca 14 $ 372,826 37 $ 2,853,742 19,518 1,564 412
Average $ 282,719 50 $ 1,716,108 21,454 2,030 329
University of Vermont 97 $ 88,602 116 $ 191,833 9,647 981 54
3.4
B
ENCHMARKINGA
NALYSISThe data received from the participating institutions included the overall space available by college/school and by space category. Data requested also included the Student FTE and the number of full-time faculty. Paulien & Associates compiled the benchmarking data by college/school, normalizing the information by calculating the assigned square feet per Student FTE and assigned square feet per full-time faculty. Totals may not add to the sum of their parts due to rounding.
In order to present this information in a consistent manner, the consultants based the student counton FTE. Based on experience, Paulien & Associates believes that comparisons using full-time equivalent students are the most appropriate since they are comparing an equivalent amount of academic instruction rather than the number of majors in a given college or school.
Because there is a variance in the number of FTE generated by graduate students at different institutions, and because of the greater complexity of surveying differentiated graduate and undergraduate student FTE’s, only the total Student FTE was used in this report. No differentiation between graduate and undergraduate student credit hours to FTE formulas were made in this analysis. The consultants recognize that in many cases full-time graduate students may represent fewer credit hours than FTE for undergraduate students. The consultants asked the participating institutions for full-time faculty which were defined as full-time teaching staff including tenured, tenure track, and non-tenure track professors and instructors who had full-time appointments.
Finally, the institutions were asked to report facilities, staffing, and Student FTE within the boundaries of the main campus. Campus boundaries were defined by each institution. Buildings such as cooperative extension centers, agricultural experiment stations, medical centers, hospitals, and schools and colleges located off campus were not included in this study.
PAULIEN &ASSOCIATES,INC. Page 9
3.5
A
SSUMPTIONS ANDC
ONDITIONSU
SED INT
HISA
NALYSIS¾ The information used for this benchmarking study is taken from the responses to the surveys reported to the consultants. The different colleges and schools that recorded the data may have classified their space differently in their identification of space within the various space categories. Categories of space type or facilities room uses and square footages have been taken directly from the data as sent to the consultants or obtained from web-based resources. In some instances, consultants contacted benchmark institutions when data seemed “out-of-range” in a particular space category. Outcomes of these discussions are found in the comparative analysis section of this report.
¾ Similarly, full-time faculty headcounts and Student FTE were taken from the data as sent. In almost all cases, faculty and student information reported on the peer forms are different from published sources such as IPEDS or the Common Data Set. These discrepancies are mostly the result of differences in reporting dates and definitions. For this study, faculty was defined as full-time faculty that includes tenured, tenure track, and non-tenure track professors and instructors or lecturers who had full-time appointments. This category did not include part-time adjunct instructors or lecturers.
¾ Student FTE for both graduate and undergraduate levels was requested, however, no differentiation between graduate and undergraduate Student FTE was made in the analysis. It was assumed that Student FTE was generated based on credit hours generated for a given term.
¾ For this study, only departmentally controlled classroom space was included in the college level analysis. Centrally scheduled or managed classrooms were analyzed separately. The space categories used in the tables that follow are departmentally assigned classrooms, teaching laboratories, open laboratories, research laboratories, offices, study space, and other. The “other” category includes assembly and exhibit space, food and lounge facilities, animal quarters, greenhouses, health care facilities, and demonstration areas. The “other” category does not include residential space.
¾ Student FTE for the University of Vermont was secured from the Office of Institutional Studies, Table 7, Full Time Equivalent (FTE) Students Taught, Fall 2004. Full-time faculty headcounts included clinical, visiting, and research faculty, and was secured from the Office of Institutional Studies website under the heading of Faculty and Staff Information and titled Headcount and FTE Faculty by Unit. Student FTE and full-time faculty headcount are presented in Table 4 below.
PAULIEN &ASSOCIATES,INC. Page 10
Table No. 4
School / College FTE - Fall 2004
Total Student FTE
Full-Time Faculty
College of Agriculture and Life Sciences 675 60
College of Arts and Sciences 4,733 268
School of Business Administration 441 24
College of Education and Social Services 766 88
College of Engineering and Mathematics 1,063 72
School of Environment and Natural Resources 445 27
Evening Division 519
-Medicine - Basic Sciences 141
-Microbiology & Molecular Genetics 74 22
Military Studies 5
-College of Nursing and Health Sciences 302 37
Physical Education Activities 82
-College of Medicine 402 383
PAULIEN &ASSOCIATES,INC. Page 11
4.0
C
OMPARATIVE
A
NALYSIS
The comparative analysis results and findings presented in the remainder of this report are based solely on data from benchmark institutions. More specifically, identified deficits and surpluses of space in each of UVM’s colleges and schools are related to benchmark institution averages. In each of the tables, percentage comparisons between peers and UVM were calculated as the percent above or below UVM's stated number. The results of this report are independent of findings of a formal space needs and utilization analysis as prepared by Paulien & Associates in other reports. Since the other reports were generated using normative guidelines and other internal factors, the results are not comparable.
4.1
T
OTALASF
PERS
TUDENTFTE
Before examining the college-by-college benchmark analysis, a review of the data at the institutional level is warranted. Student FTE and total ASF data were used to calculate ASF per student FTE, thus normalizing the data for comparative purposes. Total ASF data includes not only spaces for academic programs, but also spaces for administrative and student support, library, athletics, and recreation. Due to differences in accounting systems at each university, auxiliary or non-general fund spaces may not be included in the overall totals. Residential space and inactive or un-coded square footages are excluded in this total as well. It must be noted that the University of Virginia reported 413,725 ASF that was under construction at the time of the survey and was not reported in their inventory. The largest of these spaces was the John Paul Jones Arena, with 237,900 ASF of space dedicated to Athletics. Likewise, the University of North Carolina reported more than 675,000 ASF that was under construction and not incorporated into their response. Findings for each of the 12 benchmark institutions are delineated in the following table. The consultant used the University of Vermont’s designations for the comparison groups. The groups are “Aspirants”, “Peers” and “Private Universities”. Comparison groups will remain consistent for the remainder of this report. A Glossary of Terms for terminology found in each table is located in Appendix B.
ASF per Student
Institution Total
ASF per
Student Student FTE TOTAL ASF
Dept. Class-rooms Total Labs
Teaching Labs Open Labs Research Labs Office &
Conf. Study Other
Aspirants
University of Michigan - Ann Arbor 336 36,990 12,414,220 15 54 13 0 41 82 24 161
University of North Carolina - Chapel Hill 302 22,659 6,839,652 13 45 9 5 31 87 30 98
Pennsylvania State University - State College 160 39,246 6,267,396 10 40 7 5 28 49 9 52
University of Virginia - Charlottesville 284 19,891 5,641,123 12 42 6 3 33 83 26 120
University of Wisconsin - Madison 312 35,123 10,970,575 12 70 13 8 49 83 24 123
Aspirants Average 279 30,782 8,426,593 12 50 9 4 37 77 23 111
Peers
University of Connecticut - Storrs 221 17,116 3,779,395 10 45 9 8 29 54 18 94
University of Delaware - Newark 106 17,843 1,883,024 14 26 7 2 17 26 12 27
Kansas State University - Manhattan 213 18,911 4,030,564 6 72 16 18 38 52 14 69
Oklahoma State University - Stillwater 150 17,979 2,699,136 13 38 11 4 23 33 13 54
University of Rhode Island - Kingston 183 11,867 2,172,473 10 25 10 2 13 50 16 82
Peers Average 175 16,743 2,912,918 11 41 11 7 24 43 15 65
Private Universities
Boston University 216 23,390 5,041,895 13 35 10 5 20 46 10 21
Cornell University - Ithaca 375 19,518 7,312,256 17 87 16 5 65 97 30 145
Private Universities Average 295 21,454 6,177,076 15 61 13 5 43 71 20 83
COMBINED AVERAGE 238 23,378 5,754,309 12 48 11 5 32 62 19 87
University of Vermont 200 9,647 1,930,806 12 44 10 4 30 52 19 48
UVM COMPARED TO ASPIRANTS AVERAGE (78) (21,135) (6,495,787) (0) (6) 1 (0) (6) (24) (4) (63)
UVM % COMPARED TO ASPIRANTS AVERAGE (39%) (219%) (336%) (3%) (13%) 6% (0%) (21%) (46%) (20%) (130%)
UVM COMPARED TO PEERS AVERAGE 26 (7,096) (982,112) 1 3 (1) (2) 7 9 4 (17)
UVM % COMPARED TO PEERS AVERAGE 13% (74%) (51%) 12% 7% (9%) (60%) 22% 18% 23% (35%)
UVM COMPARED TO PRIVATE UNIV. AVERAGE (95) (11,807) (4,246,270) (3) (16) (3) (1) (13) (19) (1) (35)
UVM % COMPARED TO PRIVATE UNIV. AVERAGE (47%) (122%) (220%) (26%) (37%) (30%) (21%) (41%) (36%) (6%) (72%)
UVM COMPARED TO COMBINED AVERAGE (38) (13,730) (3,823,503) (0) (4) (1) (1) (2) (9) 0 (39)
PAULIEN &ASSOCIATES,INC. Page 12 Total ASF and Student FTE followed a distinct pattern. These two measures were the highest for Aspirant institutions, followed by Private Universities, with Peers being the lowest of the three groups. UVM had the lowest Total ASF (1,930,806) and Students FTE (9,647). Private Universities averaged the highest ASF/per Student FTE with 295 ASF/FTE. UVM, with 200 ASF per Student FTE, was above the Peers average of 175 ASF/FTE. On the whole, the combined average of the comparison groups ASF/FTE to UVM was a19% deficit or a deficit of 38 ASF per student FTE.
Reviewing the combined average detail for each room use category, UVM had equal ASF/FTE in departmental classrooms and study categories. Lower combined average ASF/FTE was evident in total labs, open labs, teaching labs, research labs, office and conference, and other spaces. Results of the benchmarking comparison on a college-by-college level, in terms of ASF per Student FTE, will be discussed in the following sections of this report. As a note, the University of Michigan reported no centralized classrooms as they were assigned only to departmental units.
4.2
T
OTALASF
PERF
ULL-
TIME(FT)
F
ACULTYThe next table normalizes space data by full-time faculty instead of Student FTE. As explained in the following table, UVM’s full-time faculty headcount was only 1% below Peer’s average but substantially below the average faculty headcount for both the Aspirants and Private Universities comparison groups. Since UVM total ASF was below the average of other institutions, UVM’s 1,968 ASF per full-time faculty ranks at the lower end of the 12 institutions, which had a combined average of 3,256 ASF/Faculty. These below average results also translate to each of the eight space categories, where UVM is 41% to 157% below combined averages.
Assignable Square Feet per Faculty
ASF per Faculty
Institution Total
ASF per Faculty
FT
Faculty TOTAL ASF
Dept. Class-rooms Total Labs
Teaching Labs Open Labs
Research Labs
Office &
Conf. Study Other
Aspirants
University of Michigan - Ann Arbor 4,217 2,944 12,414,220 185 677 158 0 519 1,034 296 2,025
University of North Carolina - Chapel Hill 2,532 2,701 6,839,652 108 378 74 41 263 727 249 819
Pennsylvania State University - State College 2,153 2,911 6,267,396 134 544 98 67 379 657 123 696
University of Virginia - Charlottesville 2,983 1,891 5,641,123 125 440 61 32 347 875 279 1,264
University of Wisconsin - Madison 5,326 2,060 10,970,575 213 1,195 214 137 844 1,409 408 2,102
Aspirants Average 3,442 2,501 8,426,593 153 647 121 55 470 940 271 1,381
Peers
University of Connecticut - Storrs 4,457 848 3,779,395 198 918 187 154 577 1,087 361 1,893
University of Delaware - Newark 1,763 1,068 1,883,024 233 446 124 35 287 440 201 443
Kansas State University - Manhattan 3,493 1,154 4,030,564 106 1,175 270 288 617 853 225 1,133
Oklahoma State University - Stillwater 2,247 1,201 2,699,136 190 571 168 58 345 497 188 802
University of Rhode Island - Kingston 3,209 677 2,172,473 182 431 173 37 221 874 286 1,436
Peers Average 3,034 990 2,912,918 182 708 185 114 409 750 252 1,141
Private Universities
Boston University 2,021 2,495 5,041,895 125 330 92 47 192 431 96 198
Cornell University - Ithaca 4,675 1,564 7,312,256 212 1,080 201 64 815 1,207 372 1,804
Private Universities Average 3,348 2,030 6,177,076 168 705 147 55 503 819 234 1,001
COMBINED AVERAGE 3,256 1,793 5,754,309 167 682 152 80 451 841 257 1,218
University of Vermont 1,968 981 1,930,806 119 438 98 41 299 516 185 474
UVM COMPARED TO ASPIRANTS AVERAGE (1,474) (1,520) (6,495,787) (35) (209) (23) (14) (172) (424) (86) (907)
UVM % COMPARED TO ASPIRANTS AVERAGE (75%) (155%) (336%) (29%) (48%) (24%) (35%) (57%) (82%) (46%) (192%)
UVM COMPARED TO PEERS AVERAGE (1,066) (9) (982,112) (63) (271) (87) (73) (111) (234) (67) (668)
UVM % COMPARED TO PEERS AVERAGE (54%) (1%) (51%) (53%) (62%) (89%) (179%) (37%) (45%) (36%) (141%)
UVM COMPARED TO PRIVATE UNIV. AVERAGE (1,380) (1,049) (4,246,270) (50) (268) (49) (14) (205) (303) (48) (527)
UVM % COMPARED TO PRIVATE UNIV. AVERAGE (70%) (107%) (220%) (42%) (61%) (50%) (35%) (69%) (59%) (26%) (111%)
UVM COMPARED TO COMBINED AVERAGE (1,288) (812) (3,823,503) (49) (245) (54) (39) (152) (325) (72) (744)
PAULIEN &ASSOCIATES,INC. Page 13
4.3
R
ESEARCHASF
ANDR&D
E
XPENDITURES PERF
ULL-
TIMEF
ACULTYH
EADCOUNTSince the University of Vermont has a research focused mission, it was determined that research laboratory spaces on campus should be analyzed for each of the benchmark institutions. For clarity, peer institutions that reported administrative or other organizational research spaces (i.e., centers, institutes) on the main campus were included in the ASF numbers.
Total research laboratory ASF was reported in the middle column of the table. The analysis indicates that UVM has less total research lab space (293,029 ASF) than any of the comparison benchmark institutions, except the University of Rhode Island. The average of the Aspirant group was 1,147,439 ASF, while Peer’s averaged three times less at 414,392 ASF. Private Universities averaged 876,563 ASF. In looking at research lab ASF per faculty, UVM ranks ninth among all benchmark institutions, with 51% less research lab space per faculty than all benchmark institutions combined.
Academic Research R & D Expenditures
Institution
Research Lab ASF per
Faculty FT Faculty Total Research Laboratory ASF R&D $ per Faculty Total R&D Expenditures Aspirants
University of Michigan - Ann Arbor 519 2,944 1,527,542 221,324 651,579,000 University of North Carolina - Chapel Hill 263 2,701 711,565 137,285 370,806,000 Pennsylvania State University - State College 379 2,911 1,103,617 148,383 431,942,000 University of Virginia - Charlottesville 347 1,891 656,562 96,425 182,340,000 University of Wisconsin - Madison 844 2,060 1,737,910 321,408 662,101,000
Aspirants Average 470 2,501 1,147,439 184,965 459,753,600
Peers
University of Connecticut - Storrs 577 848 489,458 99,388 84,281,000 University of Delaware - Newark 287 1,068 306,667 79,735 85,157,000 Kansas State University - Manhattan 617 1,154 712,263 92,551 106,804,000 Oklahoma State University - Stillwater 345 1,201 414,154 79,090 94,987,000 University of Rhode Island - Kingston 221 677 149,420 78,799 53,347,000
Peers Average 409 990 414,392 85,913 84,915,200
Private Universities
Boston University 192 2,495 477,894 77,199 192,612,000 Cornell University - Ithaca 815 1,564 1,275,231 238,379 372,825,530
Private Universities Average 503 2,030 876,563 157,789 282,718,765
COMBINED AVERAGE 451 1,793 796,857 139,164 274,065,128
University of Vermont 299 981 293,029 90,318 88,602,000
UVM COMPARED TO ASPIRANTS AVERAGE (172) (1,520) (854,410) (94,647) (371,151,600)
UVM % COMPARED TO ASPIRANTS AVERAGE (57%) (155%) (292%) (105%) (419%)
UVM COMPARED TO PEERS AVERAGE (111) (9) (121,363) 4,405 3,686,800
UVM % COMPARED TO PEERS AVERAGE (37%) (1%) (41%) 5% 4%
UVM COMPARED TO PRIVATE UNIV. AVERAGE (205) (1,049) (583,534) (67,471) (194,116,765)
UVM % COMPARED TO PRIVATE UNIV. AVERAGE (69%) (107%) (199%) (75%) (219%)
UVM COMPARED TO COMBINED AVERAGE (152) (812) (503,828) (48,846) (185,463,128)
UVM % COMPARED TO COMBINED AVERAGE (51%) (83%) (172%) (54%) (209%)
Total R&D expenditures were analyzed in the preceding table. A review of R&D expenditures per full-time faculty ranges from a low of $77,199 per faculty at Boston University to a high of $321,408 at the University of Wisconsin. Aspirants had the highest average expenditures per faculty ($184,965) than the Peers or Private Universities, which averaged $85,913 and $157,789 per faculty, respectively. Overall, UVM expends 54% less R&D dollars per full-time faculty member than compared to the 12 benchmarked institutions combined, which averaged $139,164 per full-time faculty in expenditures.
PAULIEN &ASSOCIATES,INC. Page 14
4.4
C
OLLEGE/S
CHOOLB
ENCHMARKA
NALYSISThe main focus of this study disaggregates institutional space data at the college and school level so that specific comparisons relevant to UVM can be achieved. While no two institutions had identical colleges and schools, there are similarities. In most cases, similarity of disciplines and fields of study within a college or school provided evidence for appropriate classification. The following table displays the outcome of this task. This analysis compared approximately 75 unique colleges and schools, however, only colleges and schools relevant to UVM are contained in this section. Only Oklahoma State University provided space for their Honors College. However, they were unable to separate student FTE from the various disciplines. It must be noted that Cornell University is both a private endowed university and the federal land-grant institution of New York State. Four of its colleges – Agriculture and Life Sciences, Human Ecology, Industrial & Labor Relations, and Veterinary Medicine – are affiliated by law with the State University of New York (SUNY), creating a special association between Cornell and SUNY.
Benchmark Institution Matrix
College/School Un iversi ty of Verm on t blank Un iversi ty of Mich igan Ann Arbo r Unive rsity of N orth Car olina a t Chap el Hi ll Penns ylvan ia Stat e Uni versit y Unive rsity of V irgini a Unive rsity of W iscon sin M adiso n Unive rsity of C onnect icut Unive rsity of D elawar e Kan sas St ate Un iversit y Oklah oma S tate U nive rsi ty-Main Cam pus Unive rsity of Rho de Isl and blank Bo ston Unive rsity Corn ell U niver sity
College of Agriculture and Life Sciences x x x x x x x x
College of Arts and Sciences x x x x x x x x x x x x
College of Education and Social Services x x x x x x x x x x x x
College of Engineering and Mathematics x x x x x x x x x x x x
College of Nursing and Health Sciences x x x x x x x x
Honors College x x
School of Environment and Natural Resources x x x
School of Business Administration x x x x x x x x x x x x x
College of Medicine x x x x x x
PAULIEN &ASSOCIATES,INC. Page 15
4.4.1
C
OLLEGE OFA
GRICULTURE ANDL
IFES
CIENCESAll seven of the comparison institutions had a Natural Resources program or school with the College of Agriculture.
Cornell University reported that largest amount of space and student FTE, with 1,226,519 ASF, and 3,114 students. Cornell’s College of Agriculture and Life Sciences is one of four colleges that is under the federal land-grant institution of New York, a partnership maintained with the State University of New York (SUNY). UVM, with 675 student FTE, had the lowest enrollment of the all benchmark institutions and the second lowest physical space at 253,588 ASF.
When compared to all benchmark institutions, UVM’s 376 ASF per Student FTE for the College of Agriculture and Life Sciences was ranked sixth among all institutions. This difference in ASF per Student FTE, as compared to the other benchmark institutions, can be attributed mainly to lower ASF per Student FTE numbers in Study, Departmental Classrooms, Open Labs, and Office & Conference spaces.
On average, UVM, with 376 ASF/FTE, had 4% less space than the four institutions that comprise the Peers category (392 ASF/FTE) and 5% less than Cornell (394 ASF/FTE), but 61% less space than the two institutions in the Aspirants category (604 ASF/FTE). When taken together the combined average of 453 ASF/FTE is 77 ASF per Student FTE greater than UVM’s College of Agriculture and Life Sciences. The analysis does not take into account the planned Marsh Life Sciences building addition, which will add another 8,513 ASF to UVM’s total ASF. If this building is added to the analysis, the UVM number increases to 388 ASF per Student FTE.
ASF per Student
College of Agriculture and Life Sciences
ASF per Student
Student
FTE TOTAL ASF Dept. Class-rooms Total Labs Teaching Labs Open Labs Research Labs Office &
Conf. Study Other
Aspirants
Pennsylvania State University - State College 611 1,770 1,082,204 7 133 11 4 118 104 1 366
University of Wisconsin - Madison 596 1,920 1,143,864 4 311 34 16 261 148 9 125
Aspirants Average 604 1,845 1,113,034 5 222 22 10 189 126 5 246
Peers
University of Connecticut - Storrs 518 730 377,949 1 121 16 12 93 82 4 310
University of Delaware - Newark 279 807 225,381 9 81 21 1 59 60 0 128
Kansas State University - Manhattan 365 1,863 680,000 2 191 37 10 144 83 6 84
Oklahoma State University - Stillwater 407 2,058 838,557 6 94 18 2 74 61 3 244
Peers Average 392 1,365 530,472 4 122 23 6 93 71 3 191
Private Universities
Cornell University - Ithaca 394 3,114 1,226,519 18 46 34 10 2 118 19 192
Private Universities Average 394 3,114 1,226,519 18 46 34 10 2 118 19 192
COMBINED AVERAGE 453 1,752 796,353 7 139 24 8 107 94 6 207
University of Vermont 376 675 253,588 2 109 28 4 77 57 2 206
UVM COMPARED TO ASPIRANTS AVERAGE (228) (1,170) (859,446) (3) (113) 5 (6) (112) (69) (3) (40)
UVM % COMPARED TO ASPIRANTS AVERAGE (61%) (173%) (339%) (161%) (104%) 20% (149%) (146%) (122%) (165%) (19%)
UVM COMPARED TO PEERS AVERAGE (17) (690) (276,884) (2) (13) 5 (2) (16) (15) (1) 15
UVM % COMPARED TO PEERS AVERAGE (4%) (102%) (109%) (109%) (12%) 18% (54%) (20%) (26%) (80%) 7%
UVM COMPARED TO PRIVATE UNIV. AVERAGE (18) (2,439) (972,931) (16) 63 (6) (6) 75 (61) (17) 14
UVM % COMPARED TO PRIVATE UNIV. AVERAGE (5%) (361%) (384%) (786%) 58% (22%) (153%) 97% (108%) (936%) 7%
UVM COMPARED TO COMBINED AVERAGE (77) (1,077) (542,765) (5) (31) 4 (4) (30) (37) (4) (1)
UVM % COMPARED TO COMBINED AVERAGE (21%) (160%) (214%) (220%) (28%) 13% (95%) (39%) (65%) (226%) (0%)
When room use categories were analyzed, the Aspirants had more space in seven of the eight categories, as compared to the Peers group. The largest differences, on average, were in Research Laboratories, where Aspirants had twice as much space as compared to institutions in the Peer group (189 vs. 93 ASF/FTE.) With the exception of Teaching Labs, UVM had less ASF/FTE in all other room use categories, as compared to the average of all benchmark institutions (labeled combined average in the table).
PAULIEN &ASSOCIATES,INC. Page 16 ASF per Faculty
College of Agriculture and Life Sciences
ASF per
Faculty FT Faculty TOTAL ASF Dept.
Class-rooms Total Labs Teaching
Labs Open Labs Research
Labs
Office &
Conf. Study Other
Aspirants
Pennsylvania State University - State College 3,458 313 1,082,204 40 753 63 24 666 585 8 2,071
University of Wisconsin - Madison 4,190 273 1,143,864 26 2,181 237 111 1,833 1,044 60 879
Aspirants Average 3,824 293 1,113,034 33 1,467 150 68 1,249 815 34 1,475
Peers
University of Connecticut - Storrs 6,631 57 377,949 12 1,548 201 154 1,193 1,044 50 3,976
University of Delaware - Newark 2,817 80 225,381 90 826 214 14 598 603 5 1,293
Kansas State University - Manhattan 2,857 238 680,000 13 1,493 287 76 1,130 653 44 654
Oklahoma State University - Stillwater 3,263 257 838,557 45 750 141 15 594 488 28 1,952
Peers Average 3,892 158 530,472 40 1,155 211 65 879 697 32 1,969
Private Universities
Cornell University - Ithaca 3,228 380 1,226,519 150 382 278 84 20 966 159 1,571
Private Universities Average 3,228 380 1,226,519 150 382 278 84 20 966 159 1,571 COMBINED AVERAGE 3,778 228 796,353 54 1,133 203 68 862 769 50 1,771 University of Vermont 4,226 60 253,588 23 1,226 314 45 867 638 21 2,318
UVM COMPARED TO ASPIRANTS AVERAGE 403 (233) (859,446) (10) (241) 164 (22) (383) (176) (13) 843
UVM % COMPARED TO ASPIRANTS AVERAGE 10% (388%) (339%) (42%) (20%) 52% (49%) (44%) (28%) (61%) 36%
UVM COMPARED TO PEERS AVERAGE 334 (98) (276,884) (17) 71 103 (19) (12) (59) (11) 349
UVM % COMPARED TO PEERS AVERAGE 8% (163%) (109%) (73%) 6% 33% (42%) (1%) (9%) (50%) 15%
UVM COMPARED TO PRIVATE UNIV. AVERAGE 999 (320) (972,931) (127) 844 36 (38) 846 (328) (138) 747
UVM % COMPARED TO PRIVATE UNIV. AVERAGE 24% (533%) (384%) (545%) 69% 11% (84%) 98% (51%) (654%) 32%
UVM COMPARED TO COMBINED AVERAGE 449 (168) (542,765) (31) 93 111 (23) 4 (131) (29) 547
UVM % COMPARED TO COMBINED AVERAGE 11% (280%) (214%) (132%) 8% 35% (50%) 1% (20%) (140%) 24%
Turning attention to ASF per faculty, UVM exceeded Aspirants by 10% and Peers by 8%. UVM’s 4,226 ASF per faculty is 449 ASF/Faculty or 11% greater than all benchmark institutions combined. If the Marsh Life Sciences building addition is included in the analysis, the number increases to 4,368 ASF per Faculty. The second highest overall ASF/Faculty ratio, as compared to all benchmark institutions, provided UVM with more space in Total Labs, Teaching Labs, Research Labs, and Other room use categories. As a note, the Other category included animal quarters, field buildings, greenhouses, and storage facilities.
As noted in the ASF/Student FTE table, space in the “Other” category at UVM accounted for 55% of the Total ASF per Student FTE (206 vs. 376 ASF/Student). Similar results were found at Penn State University, UConn, and Oklahoma State University, with 60% of the Total ASF/per Student space in the Other category. If the Other space is removed from the total ASF for each of the eight colleges in this analysis, a slightly different picture emerges. With respect to ASF/Student FTE and ASF/Faculty, UVM’s College of Agriculture and Life Sciences results were less favorable as compared to each of the groups.
PAULIEN &ASSOCIATES,INC. Page 17
4.4.2
C
OLLEGE OFA
RTS ANDS
CIENCESNine of the 12 benchmark institutions were consistent with UVM in having a College of Arts and Sciences. Two institutions were named slightly differently, but both had similar disciplines when compared to UVM. These included the University of Michigan with Literature, Science, and the Arts and the University of Wisconsin’s College of Letters and Science.
At Penn State University, the College of Liberal Arts, the Eberly College of Science, the College of Arts and Architecture, and the College or Earth and Mineral Sciences were combined to form one unit, with departments similar to the College of Arts and Sciences at UVM.
The table demonstrates that in general that the five aspirants (Michigan, North Carolina, Penn State, Virginia and Wisconsin) had larger enrollments and more physical space in ASF than institutions in the Peers or the Private Universities categories. In fact, Aspirants had more than twice as many students and total ASF as the Peers. Of all the benchmark institutions combined, UVM ranked the third lowest enrollment at 4,733 FTE, and ranked lowest in total space at 275,804 ASF. UVM, with 58 ASF per Student FTE, ranked lowest among the average of the twelve benchmark institutions, which had a combined average of 99 ASF per Student FTE. Overall, UVM has 35% less ASF per Student FTE when compared to the Peers average of 78 ASF per Student FTE. To be comparable to Aspirants averages, UVM would almost need to almost double its ASF per Student FTE to 110 ASF/FTE.
ASF per Student
College of Arts and Sciences
ASF per Student
Student
FTE TOTAL ASF Dept. Class-rooms Total Labs Teaching Labs Open Labs Research Labs Office &
Conf. Study Other
Aspirants
University of Michigan - Ann Arbor 102 17,660 1,800,727 14 33 8 0 25 35 2 18
University of North Carolina - Chapel Hill 200 7,510 1,501,954 3 75 16 13 46 70 8 45
Pennsylvania State University - State College 122 11,399 1,387,796 2 58 15 7 36 46 0 15
University of Virginia - Charlottesville 63 11,160 705,884 n/a 26 6 1 19 22 1 15
University of Wisconsin - Madison 65 21,961 1,426,791 2 26 8 5 13 28 2 8
Aspirants Average 110 13,938 1,364,630 5 44 11 5 28 40 2 20
Peers
University of Connecticut - Storrs 72 9,192 660,895 2 36 7 3 26 25 2 7
University of Delaware - Newark 78 7,617 590,337 8 32 13 2 17 25 1 11
Kansas State University - Manhattan 92 6,736 616,350 0 56 22 3 31 26 1 7
Oklahoma State University - Stillwater 86 5,222 447,485 3 42 16 4 22 30 3 8
University of Rhode Island - Kingston 66 4,549 298,378 2 24 12 3 9 26 1 13
Peers Average 78 6,663 522,689 3 38 14 3 21 26 1 9
Private Universities
Boston University 87 7,273 630,889 3 34 10 3 21 41 1 8
Cornell University - Ithaca 163 4,355 709,337 23 58 16 5 37 62 1 19
Private Universities Average 125 5,814 670,113 13 46 13 4 29 51 1 13
COMBINED AVERAGE 99 9,553 898,069 6 41 12 4 25 36 2 14
University of Vermont 58 4,733 275,804 2 28 9 5 14 21 1 6
UVM COMPARED TO ASPIRANTS AVERAGE (52) (9,205) (1,088,826) (3) (15) (2) 0 (13) (19) (2) (14)
UVM % COMPARED TO ASPIRANTS AVERAGE (89%) (194%) (395%) (197%) (53%) (19%) 0% (93%) (90%) (198%) (231%)
UVM COMPARED TO PEERS AVERAGE (20) (1,930) (246,885) (1) (10) (5) 2 (7) (5) (1) (3)
UVM % COMPARED TO PEERS AVERAGE (35%) (41%) (90%) (79%) (34%) (58%) 39% (48%) (24%) (64%) (53%)
UVM COMPARED TO PRIVATE UNIV. AVERAGE (67) (1,081) (394,309) (11) (18) (4) 1 (15) (30) (0) (7)
UVM % COMPARED TO PRIVATE UNIV. AVERAGE (114%) (23%) (143%) (650%) (62%) (42%) 22% (104%) (141%) (54%) (118%)
UVM COMPARED TO COMBINED AVERAGE (41) (4,820) (622,265) (4) (13) (3) 1 (11) (15) (1) (8)
UVM % COMPARED TO COMBINED AVERAGE (71%) (102%) (226%) (226%) (44%) (39%) 20% (76%) (71%) (118%) (138%)
With the exception of the University of Michigan and Cornell, departmental classrooms are negligible in most colleges of arts and sciences, as these programs use pooled or centralized classrooms. The Michigan facilities file placed classrooms with the College which is the primary user of a building. An analysis of pooled classrooms is found later in this report. When UVM is compared to combined benchmark averages in the space categories, all categories are deficits with the exception of Open Labs where UVM has 20% more ASF per Student FTE than the average of the benchmark institutions.