Operating on Quality, Access, and Cost: Managing Better
Health Systems
Aaron Hugh Ratclie
A dissertation submitted to the faculty of the University of North Carolina at Chapel Hill in partial fulllment of the requirements for the degree of Doctor of Philosophy in the Kenan-Flagler Business School (Operations).
Chapel Hill 2013
Approved by:
Dr. Ann Marucheck
Dr. Wendell Gilland
Dr. Vinayak Deshpande
Dr. Kristen Hassmiller
Dr. Vidyadhar Kulkarni
ABSTRACT
AARON HUGH RATCLIFFE: Operating on Quality, Access, and Cost -Managing Better Health Systems
(Under the direction of Dr. Ann Marucheck and Dr. Wendell Gilland)
ACKNOWLEDGMENTS
The completion of this dissertation would not have been possible without the assistance and support of a wide community of mentors, colleagues, family, and friends.
I would like to express my deepest gratitude and appreciation to my advisors, Dr. Wendell Gilland and Dr. Ann Marucheck, for their patience, guidance, and support in completing this research and the requirements of PhD program. You have shown great generosity by giving countless hours of your time, being available to answer any question, big or small, and helping me learn the ropes as a member of the academic community. Most importantly, you have served as trusted mentors. I am blessed to be able to model my career after you for many years to come.
I would like to thank the other committee members, Dr. Vinayak Deshpande, Dr. Kristen Hassmiller, Dr. Vidyadhar Kulkarni, Dr. Serhan Ziya for their time and eort in supporting the completion of this research and for their helpful questions and constructive feedback. I extend a special thanks to Dr. Serhan Ziya for his guidance during the completion of my M.S. program in the Statistics and Operations Research Department, his assistance in transitioning to this PhD program, and his collegial support throughout this program. I would like to thank Dr. Curtis McLaughlin for serving as an honorary member of the committee and for sharing his wisdom and experience over the past 3 years.
some of the greatest rewards I take with me upon completion of the degree. I would like to thank Sharon Parks, Holly Guthrie, and Erin Rimmer for their assistance throughout the program.
Table of Contents
1 Introduction . . . 1
2 Competition Between Health Providers: Impact on Quality, Access, Cost, and Social Welfare . . . 11
2.1 Introduction . . . 11
2.2 Literature Review . . . 16
2.3 Model Formulation . . . 21
2.3.1 Base Model Analysis: Duplication of Quality Eort . . . 26
2.3.2 Special Case,δ= 0 . . . 33
2.3.3 Sensitivity Analysis . . . 34
2.4 Fixed Price Competition: Quality Eort Reduction . . . 38
2.4.1 Utilization-Dependent Utility . . . 38
2.4.2 Technical vs. Functional Quality . . . 41
2.5 Fixed-Price Competition: Quality Eort Escalation . . . 45
2.5.1 Quality cost per arrival . . . 45
2.5.2 Capacity-Dependent Cost of Quality . . . 47
2.6 Single Decision Variable Model . . . 50
2.6.1 Special Case: δ= 0 . . . 56
2.6.2 Interpretation and Sensitivity Analysis . . . 58
2.7 Summary . . . 61
2.8 Conclusions & Future Work . . . 62
3.1 Introduction . . . 66
3.2 Literature Review . . . 73
3.3 Model Description . . . 77
3.3.1 Preliminary Analysis . . . 84
3.4 Model Analysis: Capacity Decision . . . 87
3.4.1 Cost-Minimizing Capacity . . . 87
3.4.2 Sensitivity Analysis . . . 90
3.5 Model Analysis: Choosing Average Time Between Screens for Fixed Capacity . . 94
3.5.1 Special Case,α= 0;θ= 0 . . . 94
3.6 Model Analysis: Joint Optimization for Capacity and Time Between Screens . . . 96
3.6.1 Special Case,α= 0;θ= 0 . . . 97
3.7 Numerical Study . . . 99
3.7.1 Estimating Parameters . . . 100
3.7.2 Capacity Decision, Fixed Time at Home . . . 104
3.7.3 Average Time at Home Decision, Fixed Capacity . . . 109
3.7.4 Joint Capacity and Average Time at Home Decisions . . . 112
3.8 Conclusions and Future Work . . . 118
4 Revenue Management for Outpatient Appointments . . . 124
4.1 Introduction . . . 124
4.2 Literature Review . . . 128
4.3 Model . . . 133
4.3.1 Setting and Notation . . . 133
4.3.2 Model Analysis . . . 139
4.3.3 Structural Properties . . . 142
4.3.4 Bounds on Optimal Solution . . . 145
4.3.5 Sensitivity Analysis . . . 147
4.4 Numerical Study . . . 150
4.4.2 Policy Performance . . . 155
4.4.3 Optimality of Pure Open Access . . . 159
4.4.4 Other Performance Measures . . . 159
4.4.5 Policy Sensitivity Analysis . . . 163
4.5 Conclusion . . . 166
A Competition . . . 170
A.1 Proofs of Key Results . . . 170
A.1.1 Proof of Proposition 2.1 . . . 170
A.1.2 Proof of Theorem 2.1 . . . 171
A.1.3 Proof of Proposition 2.2 . . . 171
A.1.4 Proof of Theorem 2.2 . . . 172
A.1.5 Proof of Proposition 2.3 . . . 172
A.1.6 Proof of Theorem 2.3 . . . 173
A.1.7 Proof of Proposition 2.4 . . . 173
A.1.8 Proof of Theorem 2.4 . . . 174
A.1.9 Proof of Proposition 2.5 . . . 174
A.1.10 Proof of Theorem 2.5 . . . 175
A.1.11 Proof of Proposition 2.6 . . . 175
A.1.12 Proof of Theorem 2.6 . . . 176
A.2 Extensions . . . 176
A.2.1 G/G/1 Queue . . . 176
B Cancer Screening . . . 177
B.1 Proofs of Key Results . . . 177
B.1.1 Proof of Lemma 3.1 . . . 177
B.1.2 Proof of Lemma 3.2 . . . 178
B.1.3 Proof of Proposition 3.1 . . . 179
B.1.4 Proof of Theorem 3.1 . . . 180
B.1.6 Proof of Theorem 3.2 . . . 180
B.1.7 Proof of Proposition 3.3 . . . 181
B.1.8 Proof of Theorem 3.3 . . . 181
C Revenue Management . . . 183
C.1 Proof of Proposition 4.1 . . . 183
C.2 Proof of Proposition 4.2 . . . 183
C.3 Proposition 4.3 . . . 183
C.4 Proof of Proposition 4.4 . . . 184
List of Figures
1.1 Iron Triangle: Tradeos of Quality, Access, and Cost of Care . . . 4
1.2 Multiple Stakeholders inuence health system design and delivery . . . 7
2.1 Competition Can Increase Social Welfare if Capacity Is Fixed . . . 59
3.1 Cost of Colonoscopy Varies Across the US (Rosenthal 2013) . . . 70
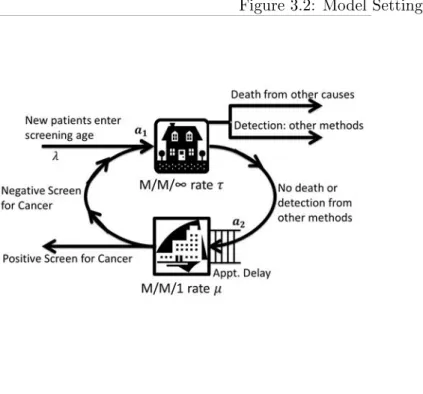
3.2 Model Setting . . . 79
3.3 Optimal Capacity Increases in Mean Time Until Onset of Cancer . . . 107
3.4 Optimal Cost Decreases in Mean Time Until Onset of Cancer . . . 108
3.5 Optimal Cost is Not Monotone in Mean Time Until Other Detection . . . 109
3.6 Optimal Cost Decreases in Mean Time Until Next Screening Request . . . 110
3.7 Cost Function Is Convex in Mean Time at Home in Feasible Region . . . 111
4.1 Attendance Rate by Appointment Delay . . . 125
4.2 Model Setting . . . 135
4.3 Unimodal and Multimodal Prot Functions . . . 145
4.4 Optimal Policy and Prot Sensitivity Analysis . . . 149
List of Tables
1.1 International Comparison of Health Expenditures and Outcomes . . . 2
2.1 Comparative Statics: Optimal Quality, Wait Time, Prot, and Social Welfare . . 34
2.2 Comparative Statics: Single Decision Model . . . 60
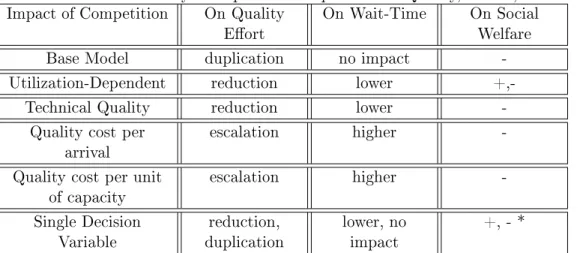
2.3 Summary of Impact of Competition on Quality, Access, Social Welfare . . . 61
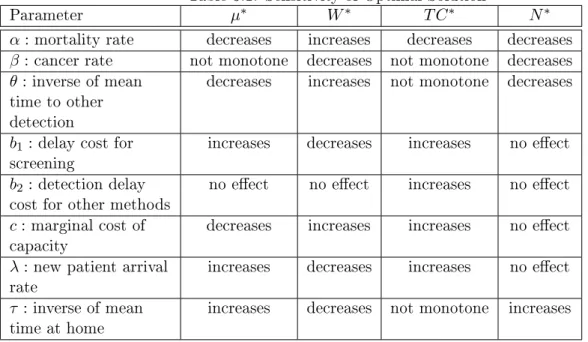
3.1 Sensitivity of Optimal Solution . . . 90
3.2 Sensitivity Analysis: Choose time at home for xed capacity, α= 0;θ= 0 . . . . 96
3.3 Sensitivity Analysis: Choose time at home and capacity,α = 0;θ= 0. . . 98
3.4 Optimal Capacity, Wait Time, and Total Cost . . . 105
3.5 Capacity Needed to Guarantee Low Wait Times . . . 106
3.6 Optimal Time at Home, Wait Time, and Total Cost . . . 111
3.7 Optimal Capacity, Time at Home, Wait Time, and Total Cost - 1 . . . 113
3.8 Optimal Capacity, Time at Home, Wait Time, and Total Cost - 2 . . . 116
3.9 Optimal Capacity, Time at Home, Wait Time, and Total Cost - 3 . . . 118
4.1 Summary Statistics of Percent Dierence from Optimal by policy . . . 156
4.2 Summary Statistics of Percent Increase over FCFS by policy . . . 157
4.3 Summary Statistics of Policy Rankings (1 highest expected prot, 9 lowest) . . . 158
4.4 Count of Scenarios (out of 198) . . . 158
4.5 Class 2 Booking Limit (left) and Class 1 Protection Level (right) by Policy . . . . 161
4.6 Alternative Performance Measures by Policy . . . 163
4.7 Avg. Percent Dierence from Optimal by Class 2 Attendance Rate . . . 164
4.8 Avg. Percent Dierence from Optimal by Mean Class 1 Demand . . . 165
4.9 Avg. Percent Dierence from Optimal by Mean Class 2 Demand . . . 165
Chapter 1
Introduction
Bour-Table 1.1: International Comparison of Health Expenditures and Outcomes
Country Health
Expenditure as % of GDP
(2011) Population Life Expectancy at Birth (2009) Infant Deaths per 1,000 (2009)
Deaths by Age 5 per 1,000
(2009)
USA 17.85 79 7 8
Netherlands 11.96 81 4 5
France 11.63 81 3 4
Canada 11.18 81 5 6
Denmark 11.15 79 3 4
Germany 11.06 80 3 4
Switzerland 10.86 82 4 4
Austria 10.64 80 4 5
Belgium 10.60 80 4 5
Portugal 10.36 79 4 4
Italy 9.50 82 3 4
Sweden 9.36 81 2 3
United Kingdom 9.32 80 5 5
Japan 9.27 83 2 3
Norway 9.07 81 3 4
*Source: WHO 2013: http://apps.who.int/nha/database/DataExplorerRegime.aspx
geois et al. (2008) estimate that 1.79% of all emergency department visits left without being seen from 2000-2006. Hsia et al. (2011) nd that this percentage ranged from 0% to 20.3% with a median percentage of 2.6% across 262 hospitals in California in 2007. These persistent challenges, marked by medical errors, long delays for health service, and healthcare resource shortages, are prevalent throughout other developed countries as well, but the high comparative costs and low comparative outcomes in the US raise the question of whether the US is spending more to get less and why (McLaughlin and McLaughlin 2008).
administered prices, diculty of measuring provider performance, and the role of the public sector. Porter and Teisberg (2006) argue that competition on the wrong levels has failed the US health system as evidenced by rising costs, high variation in quality across geographic areas, and slow technological innovation. The authors contend that the current zero-sum competition, where system participants work to gain bargaining power and shift costs to one another, leads to competition which rewards breadth of services as opposed to treatment of specic medical conditions, discrete interventions as opposed to the full cycle of care, and local bias as opposed to performance accountability. Bohmer (2009) proposes three main problems: 1) we don't know what to do, i.e. shortage of evidenced-based practice of medicine; 2) we don't do what we know, i.e. proper care is under or over-supplied; 3) when we do what we know, we don't do it right, i.e. medical errors and patient safety remain critical concerns. Green (2012) cites several causes of the medical dilemma including: misaligned payment systems, high levels of uninsured or under-insured patients, overloaded physicians, prot seeking insurers, inecient and highly fragmented health systems, and lack of communication and coordination.
Figure 1.1: Iron Triangle: Tradeos of Quality, Access, and Cost of Care
and patients focus on the cost of the insurance premium or out-of-pocket price of service.
The Iron Triangle of quality, access, and cost refers to a common paradigm for explaining how improving performance along any one of these three key dimensions may compromise per-formance on one or both of the other dimensions (Kissick 1994). For example, increasing access to care in a system may require investing in additional resources (higher costs) or faster service speed which could lead to lower quality. Such tradeos are not always required, for example changes to payment structures, technological innovation, or lean improvement eorts to reduce waste could provide higher value (higher quality at lower cost) (DOJ and FTC 2004). However, at some point tradeos between quality, access, and cost become fundamental to decisions made by stakeholders at the design, maintenance, and operational levels of health systems.
higher quality service (DOJ and FTC 2004). As stakeholders, patients balance quality, cost, and access through questions such as: Should I seek care with a lower ranked specialist who is more convenient or aordable? Should I follow guidelines for preventive cancer screening? Should I schedule an appointment well in advance or wait until I know better my availability? Patients often have little individual inuence within the system, leaving much of the decision-making power to larger stakeholders.
Providers are also stakeholders and face issues such as: How much should we invest in quality and process improvement eorts? How much capacity do we need to meet demand? What mix of services should we oer? Should we merge with another competing provider? How do we schedule patient encounters and resources? State and federal governments are also a key stakeholders and faces issues such as: Should hospitals be allowed to operate as monopolists or is provider competition better for society? Which services, e.g. preventive cancer screenings, should be covered by Medicare and Medicaid? Where should funds be invested in disease prevention, and healthy behaviors? Payers oer insurance and nancing options for patients and employers who rely on healthy, productive employees. Within the supply chain, stakeholders such as pharmaceutical companies and medical equipment suppliers inuence the cost of care, the rate of new product development, and the diusion of technological innovation. With so many stakeholders, movements such as patient-centered care attempt to unite stakeholders and actively involve, educate, and engage patients in decisions which respect their preferences.
plan accordingly for increased patient volume. The impact of an increased demand is a recurring question across dierent types of health services and levels of analysis.
A second signicant change is the set of provisions within the ACA which emphasize pre-ventive services. In particular, a new health insurance plan or insurance policy beginning on or after September 23, 2010, must cover 15 preventive services for adults, 22 for women, and 26 for children without the patient having to pay a co-payment or co-insurance or meet a deductible when the services are delivered by a network provider ( U.S. Department of Health & Human Services 2013). The increase in demand for preventive health services could therefore be even greater. Colonoscopy screening for patients over 50 is an example of such a preventive service which has seen a dramatic increase in volume in the past 10 years (Rosenthal 2013).
A third signicant development connected to the ACA is the emphasis on accountable care organizations (ACO) and the idea of a patient-centered medical home. In an ACO, a provider's reimbursement is linked to quality of care metrics for managing the overall health for a given population (Centers for Medicare & Medicaid Services 2013). The ACA authorizes the Center for Medicare and Medicaid Services (CMS) to create shared savings programs to contract with providers. The benets of ACOs are that they alter provider incentives so that there is a greater emphasis on value for the patient (higher quality at lower costs), and they support increased eciency and coordination across dierent levels of care (e.g. primary, specialty, etc.). ACOs are not without challenges. There are a lack of clear guidelines for implementation and issues concerning provider consolidation and competition. While the federal government indirectly encourages providers to form ACOs via consolidation under the ACA, the Federal Trade Commission (FTC) still encourages market competition and providers who form ACOs run the risk of anti-trust infringement due to consolidation. Better understanding of the impact of provider consolidation on quality, cost, and access to service is warranted in order to eectively balance these two opposing pressures relating to implementation of ACOs.
Figure 1.2: Multiple Stakeholders inuence health system design and delivery
between quality, cost and access described in the Iron Triangle, the patients must have access to accurate information about each of the dimensions across competing providers. It is unclear how patients will actually utilize public reporting of provider quality, cost, and service delivery metrics, but the general agreement is that improved consumer access to such information places greater pressure on providers to deliver higher quality service, with better access at lower cost.
for colorectal cancer. Lack of emphasis on prevention is another critical explanation for poor system. By examining a research problem related to colorectal cancer, we provide insight and contribute to research on planning supply and demand for preventive services. At the operations level, we employ stochastic modeling to analyze appointment allocation policies to improve out-patient clinics' responsiveness to out-patients' needs. These three research problems by no means represent the exhaustive resume of how operations research has been applied in healthcare, but they are a selection of problems which are united by 1) their focus on health service delivery and managing the associated operations as opposed to problems which emphasize medical decision making; and 2) their emphasis of the tradeos between quality, access, and cost and how to extend the boundaries of the Iron Triangle.
quality eort. When providers only choose quality eort (capacity is xed), competition may lead to lower quality and lower wait-time, and an increase in social welfare. The models which show a reduction of quality eort are signicant in that they counter previous economic theory and the Medical Arms Race argument that price-regulated competition always leads to higher quality.
In Chapter 3, at the health maintenance level, we examine screening policy and capacity allocation decisions for Colorectal Cancer (CRC) prevention. CRC is a signicant health concern both in the US and worldwide. The National Cancer Institute estimates 146,970 new cases in 2009 with 106,100 of those being colon cancer (National Cancer Institute 2013b). CRC is also the second leading cause of cancer death in the United States (National Cancer Institute 2013b). We examine two research questions: 1) How should screening providers or policy makers design their screening capacity to minimize the sum of capacity and detection delay costs? 2) What are the tradeos between the optimal guidelines for time between screening and the optimal capacity? We use a queueing network model to capture patient return behavior for cancer screenings. A social planner selects a capacity to optimize expected total cost per unit time which is the sum of expected detection delay costs (for all patients in the population) and the cost of capacity. We calculate the optimal capacity assuming the average time until the next screening request is exogenous. In order to better understand the tradeos between screening guidelines and screening capacity, we analyze a model where the provider optimizes the average time until the next screening request for xed capacity, and also investigate a joint model where the provider optimizes both the average time until the next screening request and the capacity. Given the ACA emphasizes colonoscopy as a preventive service which new insurance policies must cover at no expense to the patient, understanding capacity planning for colonoscopy is a relevant and noteworthy problem.
Simultaneously, clinics experience alarmingly high no-show rates, and research supports that no-show rates are higher when patients schedule further in advance (Gallucci et al. 2005, Green and Savin 2008, Liu et al. 2010). Clinics must balance scheduling advance requests at high no-show rates and holding appointments open for potential immediate requests at low no-show rates. Open Access is a popular paradigm for clinics to do today's work today by oering same-day appointments and encouraging short booking windows. As encountered by clinics in the UNC Health Care System Patient Access and Eciency Initiative, Open Access does not eliminate the underlying challenges of managing clinic capacity since some patients request advance appointments, due to preferences, medical condition, travel arrangements, or ease of scheduling follow-up visits. We analyze how a clinic should control bookings from two sequential patient classes with dierent no-show rates in order to maximize expected prot. We employ stochastic comparisons to establish structural properties and develop approximations for the optimal appointment allocation policy. Our numerical study compares our approximations with the optimal policy and policies used in practice and previous literature. On average, we nd that the optimal policy increases prots 17.8% over FCFS. A simple policy we develop performs 0.3% below optimal. Pure Open Access can achieve optimality in some situations but performs 23.0% below optimal on average. We provide methods for eectively implementing joint capacity control and overbooking for outpatient appointments.
Chapter 2
Competition Between Health Providers:
Impact on Quality, Access, Cost, and Social
Welfare
2.1 Introduction
US health expenditures are higher than any other country on a per-capita basis, reaching $8,361
per-capita in 2010, and exceed any other developed country in terms of percent of GDP, reaching
17.9% in 2010. (WHO 2012). While costs of care are high in the US, many standard outcome
measures of the quality of care, such as life expectancy and mortality, have fallen behind other
countries (WHO 2010). These numbers raise the question of whether the US is spending more
to get less and why. In the US, competition plays an important role in how providers balance
priorities of quality, access, and cost and which strategies they adopt in order to try and improve
performance on multiple dimensions. Features of the market for health services make it distinct
from other markets and can limit the benets of competition (Porter and Teisberg 2006). The
question remains whether competition within the US health care system is a problem or a
solution or both. We develop an analytical model of health provider competition to study
The iron triangle of quality, access, and cost refers to a common paradigm in health
policy analysis where improving performance along any of the three dimensions may compromise
one or both of the other dimensions (Kissick 1994). Some strategies and innovations break
the boundaries of these tradeos by improving performance in multiple dimensions, e.g. lean
improvement aims at providing higher quality at lower cost by eliminating waste in the provider's
delivery system; but ultimately, these tradeos are necessary to the design of the health system.
Additionally, these tradeos must be weighed across multiple levels and stakeholders; e.g. some
consumers may prefer nothing but the best while other consumers may be willing to exchange
lower quality service for lower prices or wait longer for higher quality service (DOJ and FTC
2004). To understand how competition impacts system performance as measured by these
dimensions, it is fundamentally important to incorporate such tradeos into our model of the
health service delivery market.
Healthy competition for health services is limited by unique features of the market
includ-ing: a highly regulated marketplace; distorted incentives due to third-party payment (health
insurance); information problems such as asymmetry, reliability, and lack of transparency;
soci-etal attitudes regarding medical care; and agency relationships (DOJ and FTC 2004).
Addition-ally health service consumption can be dened as a credence purchase in that consumers often
use perceptions and functional quality, experiential elements of service such as amenities and
reputation, as signals for technical quality, i.e. clinical outcomes (Gronroos 1993). Porter and
Teisberg (2006) contend that in a normal market competition drives relentless improvements
in quality and cost, whereas competition on the wrong levels has failed the US health care
system as evidenced by rising costs, high variation in quality across geographic areas, and slow
competition where system participants work to gain bargaining power and shift costs to one
another. This leads to competition which rewards breadth of services as opposed to treatment
of specic medical conditions, discrete interventions as opposed to full cycle of care, and local
bias as opposed to performance accountability standards set by competing providers in more
distant geographic regions. The authors argue, however, that while competition on the wrong
levels is the core problem, competition on services which create value for patients is the core
solution. As a result of the barriers to price competition in the health services market, health
economists and health policy researchers have argued for the existence of a Medical Arms Race
(MAR) which is characterized by an escalation of high-cost technology and capacity investments
due to provider competition on non-price elements of service such as advertising, amenities, and
reputation which may not lead directly to better medical outcomes (Joskow 1980, Robinson and
Luft 1985, 1987, Dranove et al. 1992).
The Medical Arms Race (MAR) argument was rst proposed in the 1970s and 1980s, when
prices were largely regulated by the government. Since that time several signicant changes
have occurred in the health care landscape. The rst signicant change is that the onset of
managed care in the mid-1990's gave more pricing power to payers to contract with health
service providers. As a result, consolidation amongst US health providers has surged since the
mid-1990's due to greater nancial pressure to cut costs and increase quality with the onset
of managed care. In theory, as payers developed more negotiating power, they could act as
agents for the consumers and leverage greater price competition between providers. . Many
urban areas are now dominated by 2-3 health systems. Levin Associates estimates 900 hospital
mergers and acquisitions from 1991 to 2000, and though the number dropped to 589 from 2001
Levin Associates, Inc. 2011). The debate continues regarding what happens to price, quality,
and access to care due to increased consolidation. Will consolidation lead to increased prices
and reduced access to care as providers exert monopoly power or will it create eciency gains
and reduce unnecessary duplication of services leading to lower costs and greater aordability?
By controlling the medical arms race through consolidation, will the overall quality of health
care improve and at what cost?
A second important change is that interventions have been enacted to limit competition
in healthcare markets, and debate continues regarding their usefulness. At rst on the federal
and then on the state level, Certicate of Need (C.O.N.) and other similar programs were
developed to coordinate planning of new capacity and technology adoption, and to control
high-cost expenditures deemed medically unnecessary. While C.O.N. was repealed on the federal
level in 1987, due to its ineectiveness in controlling costs, C.O.N. programs administered at
the state level may require health providers to obtain government authorization before oering
high-cost services (e.g. bone marrow transplant), investing in high-cost technologies (e.g. proton
beam therapy, gamma knife or Magnetic Resonance Imaging), or changing bed capacity.
A third change relates to the evolution of consumer access to information. The information
technology boom now makes it possible for consumers to access more information before selecting
a healthcare provider. Using websites such as The Department of Health and Human Service's
Compare Hospital tool, consumers may compare hospitals with respect to a variety of dierent
performance measures of process, outcomes, patient satisfaction, and Medicare reimbursement
(HHS.gov). Additionally, many health providers now provide real-time wait time information,
in particular for Emergency Departments, via billboards, text messages, and internet sites in
competitors (Fleisher 2011). The Aordable Care Act of 2010 (ACA) emphasizes information
transparency as an important part of health policy reform with the creation of health
infor-mation exchanges in order to provide patients with better inforinfor-mation to make health service
consumption decisions. Questions remain to be answered as to how health care consumers truly
use this information and how it aects their choices of providers.
In light of the changing landscape, some researchers have argued for the existence of a
new medical arms race. Devers et al. (2003) observe a shift in provider's strategic emphasis
between 1996-1997 and 2000-2001. They nd that in the mid-1990s hospitals primarily competed
on price by providing services attractive to managed care plans, but by 20002001, non-price
competition was becoming increasingly important and hospitals were reviving strategies which
provide services attractive to individual physicians and the patients they serve. They point out
some important dierences between the new medical arms race and that of the 1970s and 1980s:
the hospital market is more concentrated and price competition remains relatively important.
Numerous national and local news reports continue to provide anecdotal evidence of hospital
rivalry and non-price competition (Whelan and Langreth 2009, Warner 2011, Emanuel and
Pearson 2012, Wall 2012, Locke and Frank 2012).
In this work we analyze a competitive queuing model to examine how competition between
health providers impacts quality, wait-time access, and cost under xed prices. We compare
consumer surplus, industry prot, and social welfare between a monopoly and duopoly setting.
Previous economic theory consistently supports that quality will increase under xed-price
com-petition and lead to cost escalation. We seek to understand if the escalation is mitigated or
exacerbated in a model which incorporates consumer equilibrium waiting behavior. We also
such as an increasingly informed consumer population and growing demand, aect the role of
competition. The remainder of this study is organized as follows. In Section 2, we provide a
review of the relevant literature. In Section 3, we describe the model and provide results for the
base assumptions. In Section 4, we analyze variations of the model where xed-price
competi-tion leads to lower quality eort and lower wait time, a counter-argument to the Medical Arms
Race. In Section 5, we analyze variations of the model where xed-price competition leads to
higher quality eort and higher wait time, supporting the Medical Arms Race argument. In
Section 6, we consider a model where quality and service rate are linked by a single decision and
compare the results with the base model. In Section 7, we summarize the results of the various
models. In Section 8, we oer conclusions and insights from our work and discuss opportunities
for future research.
2.2 Literature Review
Our work is related to theoretical and empirical research from economics and health policy as
well as competitive queueing models from operations management literature.
Gaynor (2006) reviews the theoretical and empirical literature on the impact of competition
on quality. Under xed prices, he nds consistent support for higher quality and higher consumer
welfare but ambiguous eects on social welfare. White (1972) and Douglas and Miller (1974)
both develop models motivated by the regulated airline industry to show that when prices are
regulated, rms compete away prots by oering higher quality. Held and Pauly (1983) present
a simple model, motivated by study of the Medicare program for persons with end stage renal
(kidney) failure, to show a competitive amenity bias - i.e. the level of amenity can be aected
non-price competition in Medicare's Prospective Payment System and nds that hospitals raise
their quality to compete for Medicare patients. The higher quality expenditures lead to increased
costs, but simultaneously reduce slack. Allen and Gertler (1991) analyze a theoretical model
where consumers are heterogeneous and a rm can endogenously discriminate based on quality
under two pricing scenarios: 1) the consumer is the payer, 2) the payer is not the consumer.
The authors nd that xed-price regulation leads to distributional welfare loss and show that it
cannot induce providers to supply all consumer types with rst-best quality under either pricing
scenario. Calem and Rizzo (1995) develop a variant of the Hotelling location model where
reimbursement prices are exogenously determined by third-party payers to examine hospitals
which compete with respect to specialty mix and quality of service. They nd competing
hospitals dierentiate specialties too much or too little compared to the socially optimal service
mix chosen by the monopolist, thereby suggesting that hospital mergers lead to eciency gains
since the consolidated hospitals do not have to maintain excess capacity. They also nd that
higher reimbursement levels lead to intensied quality competition, and therefore higher costs,
but also to increased service dierentiation as hospitals try to relax quality rivalry. Brekke
et al. (2010) use a dierential-game approach to show this eect can be exaggerated in static
models. Our work contributes to this stream of economic theory by considering quality and
capacity competition in a xed-price market where consumers are sensitive to wait-time. We
study whether the wait-time dynamics mitigate or exacerbate the impacts of competition on
quality and social welfare. Many of the previous papers from this stream consider the impact of
competition on quality, but do not explicitly model access which we capture through queueing
elements of our model.
xed-price population, and show that competition, measured by the Herndahl-Hirschman Index
(HHI), improves quality, measured by decreased mortality (Gaynor 2006). Kessler and
McClel-lan (2000) nd that before 1991, hospital competition led to higher costs and, in some cases,
lower rates of adverse outcomes for elderly Medicare patients with heart disease; whereas after
1991, hospital competition led both to substantially lower costs and signicantly lower rates of
adverse outcomes. Shen (2003) studies how the number of hospitals interacting with Medicare
aects AMI mortality and nds no eect from 1985-90, but an increase in quality (decrease in
mortality) from 1990-94. Tay (2003) studies the impact of demand elasticity on mortality for
Medicare heart attack patients and nds an increase in quality (decrease in mortality). The
authors argue that this evidence supports the claim that hospital competition improved social
welfare. Kessler and Geppert (2005) nd that increased competition leads to lower readmission
rates for Medicare patients. Many such studies emphasize outcome-based metrics for quality
and make few conclusions regarding functional elements of quality. One exception is (Held and
Pauly 1983). While outcome measures of quality may be increased due to competition, it is still
unclear how value is aected, i.e. whether the higher quality comes at substantially higher cost.
When prices are set by rms, the eect of competition on quality and welfare is unclear.
Theoretical results suggest that competition may not necessarily lead to optimal quality eort.
Kamien and Vincent (1991) and Ma and Burgess (1993) show that unregulated competition
leads to suboptimal quality under exogenous product variety. Spence (1975) shows that the
monopolist supplies a socially optimal level of quality only when the marginal consumer is the
average consumer. Allard et al. (2009) derive conditions where physicians supply optimal eort
in a repeated game, but sub-optimal eort in a static game. The empirical literature also
of quality and competition are used. Propper et al. (2004) and Propper et al. (2008) show
increased competition, as measured by the number of competitors, leads to decreased quality as
measured by mortality. Ho and Hamilton (2000) show that decreased competition, as measured
by the number of hospital mergers, can lead to lower quality, as measured by the number of
readmissions for heart attack and stroke. Thus, the eect of competition on quality in health
care is an open question, particularly when prices are not xed.
Our work is also related to equilibrium queueing models from service operations. Hassin and
Haviv (2003) oer a comprehensive review of the literature on equilibrium behavior of customers
and servers in queueing systems. These models largely derive from seminal work by Naor (1969)
who nds that a levying toll can induce strategic customers in a queue to behave in a socially
optimal manner. More recent work expands upon that model by examining the tradeo between
service rate and service quality, which has been modeled both in terms of service value and in
terms of service outcomes. Kostami and Rajagopalan (2009) develop a model where a rm
may speed up a process to meet more demand with less congestion, but this may result in
decreased quality. They highlight the signicance of this tradeo in the healthcare sector. They
also characterize and compare the equilibrium outcomes for a single provider in a single period
and dynamic, multi-period setting. Anand et al. (2011) describe services where the
quality-speed tradeo is critical and demonstrate that the customer-intensity of the service is a critical
driver of equilibrium price, service speed, demand, congestion in queues and service provider
revenues. Pac and Veeraraghavan (2010) analyze expert service providers' pricing and diagnosis
strategies when there is information asymmetry between the expert and the consumer. The
expert prices two treatments, receives asymmetric information from a diagnosis, and then refers
and that experts charge high prices to signal honest diagnoses. Dai et al. (2012) model
test-ordering behavior for a single physician and a pool of insured patients in an outpatient setting
using an equilibrium queueing model. They model service quality as diagnostic certainty which
decreases in service rate (i.e. more diagnostic testing leads to diagnostic accuracy) and increases
patient utility. Under the baseline model, physician over-testing always occurs due to insurance
coverage and the authors also consider the eects of ve dierent service environments. We
consider similar quality-speed tradeos but our model takes a higher-level perspective in order
to gain insights into health operations strategy; therefore, service providers represent health
systems or competing clinics, either independent or from across competing health systems.
Other research from competitive queuing models examines competition between the service
providers. Chen and Wan (2005) study how market size aects market structure when service
providers choose price and capacity with homogeneous customers. They characterize the Nash
equilibrium and show that when it is protable for both providers to enter, there exists a
con-tinuum of equilibria where providers split the full market and adjust their respective capacity
decisions accordingly. They also show that a monopoly is socially optimal and that a duopoly
results in a loss of social welfare due to the dominance of economies of scale. Allon and
Fed-ergruen (2008) compare three models of competition based on the timing of price and delay
decisions (delay rst, price rst, simultaneous) and nd that choosing delay rst leads to
high-est wait time and lowhigh-est prices. Afanasyev and Mendelson (2010) compare a generalized delay
cost structure with a traditional additive delay cost structure in a model with heterogeneous
customers where two competing service providers choose arrival rates and capacities. They show
that when customer service valuations are additive (i.e. independent of disutility from waiting),
always indierent between the providers, i.e. there is no market segmentation. Under the
gen-eralized delay cost structure, where service valuations and delay costs are interdependent, they
nd value-based segmentation in the market when the service providers have dierent costs,
i.e. one provider gives fast service to high-value consumers and the other gives lower price and
slower service to low-value consumers. Many of the previous papers from this stream examine
models with provider pricing. Our work is a contribution to previous papers on service provider
competition, as it considers a xed price model where consumers are insured, and in our model,
the provider chooses its quality eort and service rate with possible inter-dependencies between
the two decisions.
2.3 Model Formulation
We formulate a two-stage competitive queueing model with 2 service providers and a population
(enrollment) ofN potential consumers of a medical service. Here providers represent competing
health systems or competing clinics, either independent or across health systems. In the rst
stage, Provider i = 1,2 maximizes its long-run expected prot per unit time, πi, by selecting
its quality eort, xi, and capacity, µi. Each provider incurs variable costsCi(xi, µi) which are
jointly convex in quality eort and service capacity, respectively. Each provider earns a
reim-bursement priceri per consumer served. The quality eort decision represents per-period eorts
made by the provider over a base quality level which may increase consumer service valuation
(e.g. higher functional/experiential quality, or fewer side-eects associated with treatment) or
the probability of a successful service outcome (e.g. higher technical/clinical quality), or both.
However, quality eort comes with a cost. This cost can be either the nancial cost associated
see below, associated with safety inspections or spending more face-time with the patient. The
service rate represents the aggregate capacity of the provider (clinic/facility), not necessarily
the service rate of an individual resource. Therefore, in this model, the queue does not describe
a short-term imbalance for a given resource, but an approximation for access to the service in
terms of aggregate provider utilization. The variation in arrivals and service described by the
queueing model then refers to an aggregate for the provider (e.g. patients per day, per week,
etc.). The provider can increase its capacity through means such as process improvement, hiring
additional sta, or leasing or amortizing payments on additional equipment, all of which are
aggregated under an cost of service capacity in each period.
In a given time period, consumers from the xed enrollment require (seek) medical service
independently with probabilitysand generate a Poisson arrival process with arrival rateΛ =N s.
We assume that consumers are able to observe whether or not they need medical service and the
probability of seeking service, s, is independent of any decision made by the provider, i.e. the
provider cannot induce demand from patients who are not ill (enough to seek care). Arriving
consumers observe the quality eort, the expected wait-time, and the out-of-pocket payment
at each provider a priori. For our analysis, we assume all consumers are homogenous but
specify a general model where consumer valuation for service may vary within the population.
The expected utility that consumer n receives from service at Provider i= 1,2 is denoted by
Uin = Vin(xi)−hWi(µi, λi, xi)−pi where Vin(xi) is the service valuation of consumer n at Provider i = 1,2, Wi(µi, λi, xi) is the expected throughput time at Provider i = 1,2, and h
is the disutility per unit time spent in the system. For simplicity we assume the out-of-pocket
payment paid by the consumer at Provider i= 1,2is the same for all consumers and this price
and identically distributed across the population, stochastically increasing in the quality eort
decision, xi,and follows a known distribution with c.d.f. Fxi(v). We assume that consumers
know their own service valuation as well as the service value distribution of other consumers.
Given this information, consumers maximize their expected utility by deciding to join a queue
(e.g. take the rst available appointment) or take an outside option which has exogenous utility
b. While the provider valuations may be heterogeneous across patients, we assume the value of
the outside option is constant across all patients. In the healthcare context, the outside option
might refer to emergency care for those who cannot access primary care services, destination
providers such as Mayo Clinic for those who cannot access local specialty services, or home
remedies for non-acute services. We are modeling healthcare settings, such as outpatient care
or scheduled surgeries, where a patient's condition is not so emergent that there is no time to
choose between providers or the outside option. The consumer joining decisions lead to the
eective arrival rates at each provider denoted by λi fori= 1,2.
Using the above assumptions and notation we write the objective function for Provider
i= 1,2 as:
maxπi =riλi−Ci(xi, µi) (2.1)
The consumer choice model is given by:
Before proceeding to the model analysis, we introduce some simplifying base case
assump-tions and discuss limitaassump-tions of our model. First we assume that costs are linear, i.e. Ci(xi, µi) =
qixi+ciµi+kwhereqi ≥0 denotes the linear cost of quality eort per period, ci ≥0 denotes the linear cost of capacity per period, and k ≥ 0 denotes a xed operating cost per period. This assumption is primarily made for convenience as either economies of scale or
dependen-cies between the costs of quality eort and capacity may exist in reality which could mean the
variable costs could be non-linear or the capacity operating cost be quality-eort dependent.
We assume that both quality eort and capacity are unbounded continuous decision variables.
Though it has limitations, discussed below, the linear cost function assumption is common in
previous literature on service provider competition. (Chen and Wan 2005).
Second, we assume that service times are exponential so that each provider may be modeled
as an M/M/1 queue. We assume that the eective mean service rate,τi, is linear in the provider's
chosen service rate and quality eort, i.e. τi=µi−δxi, whereδ denotes the correlation between quality eort and eective service rate. When δ = 0, the service rate is independent of the
quality eort decision. If δ > 0, then higher quality eort may require the provider to slow
its eective service rate, e.g. by spending more time serving the consumer, which may be
true of amenities like noise abatement and educational programs. If δ < 0, then increasing
the quality eort further increases the provider's service rate, e.g. the provider expands its
quality eort by operating clinic management technology, such as Electronic Medical Records
and computer based ordering which increase service rate and consumer service valuation. Given
this assumption, we write Wi(µi, λi, x1) = µi−δx1i−λi. The exponential service assumption is
made for mathematical tractability, however, since we are using the queueing model to represent
variation in capacity. As discussed by Green and Savin (2008), there likely is some variation in
provider capacity. This variation is not only variation due to time spent with individual resources
(e.g. check-in, nurse, physician etc.), but also variation in supply due to wasted appointments
(no-shows, late cancellations and reschedules) and variation in number of appointment slots
requested. We can generalize the results to M/G/1 queues and approximately to G/G/1 queues
using the PollaczekKhinchine and Kingman's formulas, respectively.
There are several limitations of the model which should be discussed before proceeding. First,
we assume that the out-of-pocket payment at a given provider is the same for all consumers.
In reality, consumers may pay dierent prices because they are on dierent plans (even with
same insurer) or have dierent amounts of deductible remaining. A second limitation is that
our model does not incorporate into patient preferences any disutility from switching providers
which may exist when patients seek service for multiple episodes of care from the same facility.
Also, our modeling of the endogeneity of demand for health service is limited. In reality, the
quality of service a patient receives today may aect their future health state and demand for
health services tomorrow. Consumers who receive high quality care may be more likely to return
to a given provider due to a positive experience, but may not return for service for a longer period
of time if the care received keeps them well longer. A third limitation is that consumers may be
heterogeneous on multiple components of their utility, for instance some classes of patients may
have higher sensitivity to waiting or higher expected service times. Additionally, there may exist
correlations between the components of the utility function, e.g. consumers who value service
more may be more sensitive to waiting. Lurking variables such as a consumer's underlying
health state might also impact multiple components of the utility function. A nal limitation
scheduling systems used by many outpatient providers in practice. Appointment systems help
providers balance variation of in-clinic waiting time, reserve capacity for urgent requests, and
match supply with patient preferences. We assume a FCFS service discipline though in reality
consumers may not always prefer the rst available appointment. Since we are concerned with
overall expected wait-time, we do not model the appointment schedule exactly, but acknowledge
it as an important component in many healthcare contexts. See Green and Savin (2008) for
further discussion of using FCFS queueing model for appointment delay in the outpatient setting.
Several of these limitations will be revisited by relaxing model assumptions in later sections or
extensions. While relaxing assumptions to consider various extensions provides for interesting
problems, the base case assumptions allow for a simple model to address our core research
question regarding the impact of competition.
2.3.1 Base Model Analysis: Duplication of Quality Eort
We assume that consumers are homogenous with linear quality sensitivity. This assumption
implies that the consumer service valuation at provider i = 1,2 is identical for all consumers
and takes the form Vin = ai +βxi ∀n. The base service valuation at provider i= 1,2 when quality investment is zero is given by ai ≥ 0, and the linear coecient β > 0 represents the consumers' sensitivity to quality eort and is constant across all consumers. The expected
consumer utility,Uin=ai+βxi−hWi(λi, µi, xi)−pi, does not depend onn, i.e. the individual consumer. Given the arrival rate, all consumers receive the same expected utility from service.
For convenience, we let zi = (pi+b−ai) denote the base eective out-of-pocket cost for service to the consumer (when accounting for the base service value and the value of the outside
Common results from competitive queueing models provide the following market clearing
condition as an equilibrium solution to the consumer choice model when consumers are
homo-geneous. Consumers play a mixed strategy such that in equilibrium all consumers are indierent
between joining a local queue or taking the outside option (Chen and Wan 2005, Afanasyev and
Mendelson 2010).
Incorporating our base assumption of consumer homogeneity, we rewrite this consumer choice
equilibrium condition as
a+βx−hWi(λi, µi)−pi=b (2.3)
Proceeding by backward induction and writing zi = (pi+b−ai) , we can rewrite the provider's optimization problem as follows:
max xi≥0,µi≥0
πi = riλi−qixi−ciµi−k (2.4)
βxi−
h µi−δxi−λi
−zi = 0 ∀i= 1,2 (2.5)
λ1+λ2 ≤ Λ (2.6)
λi ≥ 0 ∀i= 1,2 (2.7)
λi < µi−δxi ∀i= 1,2 (2.8)
In the above problem statement, Equation (2.5) represents the consumer equilibrium
con-straint (or market clearing concon-straint); Equation (2.6) is a demand concon-straint which states that
po-tential; Equation (2.7) is a straightforward non-negativity constraint on the arrival rate at each
provider, and Equation (2.8) is the stationarity constraint required for stability of the queuing
model.
We make some assumptions on the parameters to eliminate trivial cases for our model. First,
we assume ri > ci such that an entering provider will choose a non-zero service rate. We also
assumeqi+ciδ≥0 to eliminate the case where the cost tradeo for the quality eort is trivial and the provider pushes its quality eort to innity.
To examine the impacts of competition we will compare the duopoly equilibrium with the
monopoly equilibrium. These comparisons of monopolistic and oligopolistic environments seem
reasonable for a health care market which, as we mentioned in the Introduction, is largely
con-solidated with many urban areas dominated by a few major health systems. For the monopoly
case we drop the subscripts and optimize with respect to the service capacity,µ, and the quality
eort,x, to obtain the following proposition.
Proposition 2.1. Assuming q +cδ ≥ 0, if it is protable for the monopolist to enter, the optimal quality and capacity for the monopolist are given by x∗ =qβ(qch+cδ)+βz, µ∗ = Λ +δzβ + (2cδ+q)qβc(cδh+q), λ∗ = Λ
Proof. All proofs in the appendix.
The above result shows that if the monopolist can enter the market protably, it will choose
to serve the full market potential (average arrival rate of those requiring medical service from
the population). The monopolist chooses a quality eort and service rate such that the eective
given byW =
q
βc h(q+cδ).
We write the optimal prots for the monopoly as
π∗(Λ) = (r−c) Λ−z(cδ+q)
β −2
s
ch(cδ+q)
β −k (2.9)
We dene social welfare, SW, as the sum of industry prots and consumer welfare. We can
write the social welfare for the optimal monopolist decisions as
SWmon=π∗(Λ) + Λb= (r−c) Λ−
z(cδ+q)
β −2
s
ch(cδ+q)
β −k+ Λb (2.10)
Now we transition to an asymmetric competitive duopoly market structure with two providers.
Let π∗i (Λ) denote the optimal prots of Provider i = 1,2 if operating as a single provider in
the market. We can deriveπi∗(Λ)from Equation (2.9) by making the appropriate substitutions.
Note thatπi∗(Λ)is linearly increasing inΛ. LetΛidenote the breakeven arrival rate for Provider
i when it operates as a monopolist (the value of Λ such that Provider i = 1,2 may enter the
market and earn non-negative prots). Assume without loss of generality thatΛ1 ≤ Λ2. This
assumption implies that Provider 1 has a lower breakeven market arrival rate than Provider 2.
Using this notation we write the duopoly equilibrium as follows
Theorem 2.1. The duopoly equilibrium of the above optimization problem can be described by
the following four scenarios:
If Λ<Λ1, then neither provider operates in the market.
If Λ2 ≤Λ<Λ1+ Λ2,then either provider can operate as monopoly, capturing the full market
(λi = Λ).
If Λ1+ Λ2 ≤Λ then either provider operates as a monopoly or both rms enter such that
• λ1+λ2 = Λ;λi≥Λi • xi =
q
cih
β(qi+ciδi)+
zi
β,µi= Λ + δizi
β + (2ciδi+qi)
q
h
βci(ciδi+qi), λi = Λ
• Wi =
q
βci
h(qi+ciδi).
Comparing the duopoly equilibrium with the monopoly equilibrium, we obtain several key results
regarding the impacts of competition. First, we observe that if any provider enters the market,
the full market potential is captured by the entering provider(s), i.e. competition does not impact
the total number of consumers served by the market because 1) consumers are homogenous and
2) any provider can increase its capacity to meet its demand. Second, the optimal quality
decision at a given provider is unchanged regardless of whether the competitor enters. Though
a competitor will claim some market share, a provider will choose the same quality eort under
competition that it would choose with no competitor. Quality does not escalate at a given
provider but will increase within the industry due to competition. Third, each provider adjusts
its capacity to match its relative demand such that wait time remains the same at a given
provider whether or not the competitor enters the market. From these results we see that
competition does not impact quality or wait-time at a given provider. From the consumers'
point of view, there is no change in the overall service received as the quality and wait-time
are not aected by competition. Whether there are one or two providers in the market, the
When two providers are in the market, both invest in quality and capacity, yet no additional
consumers are served and the utility consumers receive from service is unchanged. When the
rms have symmetric cost and price parameters, i.e. ci = c, qi = q, zi = z, ri = r, then
competition will lead to duplication but not escalation of investments in quality and capacity
buers. This supports the Medical Arms Race argument that overall industry expenditure on
quality and capacity will increase, but it may happen via duplication as opposed to strictly
escalation.
As with the monopolist case, we can write the equilibrium expected prots for Provider
i= 1,2 when capturingλi share of the market as:
πi∗(λi) = (ri−ci)λi−
zi(ciδi+qi)
β −2
s
cih(ciδi+qi)
β −k (2.11)
If only a single provider enters the market, we can write the social welfare as in the monopolist
case above. When both providers enter the market, we write the social welfare as
SWduo = π1∗(λ1) +π2∗(λ2) + Λb (2.12)
= (r1−c1)λ1−
z1(c1δ1+q1)
β −2
s
c1h(c1δ1+q1)
β +−k
+ (r2−c2)λ2−
z2(c2δ2+q2)
β −2
s
c2h(c2δ2+q2)
β +−k+ Λb
Note that the consumer surplus does not change because the full market is served and
consumers receive the same utility regardless of competition due to wait-time eects. LetSWi
in social welfare due to simultaneous competition with Providerj6=ias
SWi−SWduo= (ri−ci)λj−π∗j(λj) (2.13)
=λj((ri−ci)−(rj−cj)) +
zj(cjδj+qj)
β + 2
s
cjh(cjδj+qj)
β +k
=λj((ri−ci)−(rj−cj)) +
cj
Wj∗ +qjx ∗
j +k
Assume without loss of generality that r1−c1≥r2−c2 (i.e. Provider 1 is the high margin
rm). The above equation states that a social welfare loss will always occur when both rms
enter the market compared to when Provider 1 alone operates in the market. The reason is
that the sum of the second and third terms must be positive forx∗j ≥0. However, the equation also shows that compared to a market with a low-margin monopolist, a duopoly market with
an additional high-margin competitor may have higher social welfare. The implications for
health care policy is that a monopoly market leads to higher social welfare unless adding an
additional provider means adding a higher margin (i.e. lower capacity cost) provider, in which
case competition may be benecial in terms of social welfare. Adding a second provider at lower
cost could happen in cases where a new provider has a disruptive innovation which allows it to
enter the market at low cost, or the new provider is another major health system which benets
from even greater economies of scale and scope.
Note that Theorem 1 and the above interpretation does not apply to a market-entry game.
When we refer to entry, we simply refer to any simultaneous equilibrium where both providers
2.3.2 Special Case, δ = 0
For convenience, we consider the symmetric case where ri =r, ci =c, qi =q, and pi = p and
δ = 0 for the remainder of this section. The assumption that δ = 0 simply implies there is no
correlation between quality-eort and eective capacity; i.e. the provider can increase quality
eort without slowing its service speed.
Now let Λ1 = Λ2 = Λ0 where Λ0 denotes the breakeven prot for the symmetric provider.
From Theorem 1 we know that if Λ < Λ0, then neither provider operates in the market, and
if Λ0 ≤ Λ < 2Λ0, then either Provider can operate as monopoly, capturing the full market
(λi = Λ). If 2Λ0 ≤ Λ then either provider operates as a monopoly or both rms enter such
thatλ1+λ2 = Λ;λi≥Λ0 and xi =
q
ch βq +
z
β,µi =λi+
q
hq
βc. The equilibrium prots for the symmetric case are given by
π∗(λi) = (r−c)λi−2
s
chq
β −
qz
β −k (2.14)
The change in social welfare for the symmetric case can then be written as
SWmon−SWduo= 2
s
chq
β +
qz
β +k (2.15)
Since the xed operating cost is non-negative, i.e. k >0, then there will be a loss in social
welfare due to competition, because2
q hcq β + qz β = c
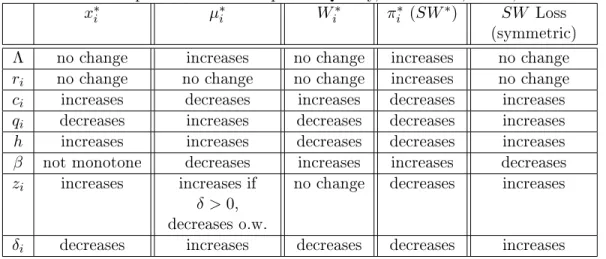
Table 2.1: Comparative Statics: Optimal Quality, Wait Time, Prot, and Social Welfare
x∗i µ∗i Wi∗ πi∗ (SW∗) SW Loss
(symmetric) Λ no change increases no change increases no change
ri no change no change no change increases no change
ci increases decreases increases decreases increases
qi decreases increases decreases decreases increases
h increases increases decreases decreases increases β not monotone decreases increases increases decreases zi increases increases if
δ >0, decreases o.w.
no change decreases increases
δi decreases increases decreases decreases increases
2.3.3 Sensitivity Analysis
To gain further insight into how the optimal decisions behave with respect to the parameters, we
perform comparative statics on the optimal decisions and key outputs of the model. Table 2.1
summarizes the monotonicity of the optimal quality eort, wait time, prot, and social welfare
loss. Since the structure of the optimal solution is the same whether one or two rms compete
in the market, the comparative statics are the same for both cases (except at the boundaries).
We obtain several key insights into the providers' optimal quality eort and capacity decisions
from the table.
The rst insight obtained is that in equilibrium providers balance the tradeo between
costs of quality eort and capacity. When the cost of capacity increases and all else remains
equal, capacity becomes more expensive relative to quality eort, and the provider invests less
in capacity and more in quality eort. The reverse is true for when the cost of quality eort
increases. Given xed prices, a provider will balance the costs of a quality eort increase and a
wait time reduction in order to capture the respective market share. The managerial implication
with one another relative to their costs. Intuitively, these tradeos can be thought of as moving
along the respective edge of the Iron Triangle. This explains why a provider located in a
downtown area where capacity expansion is limited, would spend more on quality eorts such
as infrastructure or facility renovation. The policy implication is that higher costs lead to lower
provider prots without impacting consumer welfare, therefore contributing to a greater loss
of social welfare. To maximize social welfare, policy should continue to emphasize innovation
which lowers marginal costs of capacity expansion and quality-improvement eort.
The second insight is that changes in either price or out-of-pocket payment do not impact
wait-time, but quality eort increases with out-of-pocket price. According to Table 2.1, a
change in the price does not aect the quality eort or wait time, it only aects the providers'
prots, the industry prot, and social welfare. On the other hand, if the out-of-pocket payment
increases, thereby increasingzi, consumers are paying more for service and the provider increases
the quality eort accordingly to compensate for the utility lost, which leads to higher costs.
Adjusting the out-of-pocket payment has no eect on optimal wait time. Higher prices generate
higher prots for the provider but do not impact the quality eort or wait time seen by the
consumer unless we assume the out-of-pocket payment is a function of the price. For example,
if consumers paypi =p0+αri wherep0 is the xed co-pay andαis the percent of the price paid
by the consumer, then increasing the price would lead to an increase in quality eort, but no
impact on the optimal wait time. Higher prices lead to higher social welfare because industry
prot increases. Higher prices do not impact the loss of social welfare, unless a correlation exists
between price and out-of-pocket payment. For example, if consumer out-of-pocket payment is
structured as above, then higher prices lead to greater loss of social welfare. These results have
out-of-pocket made by third-party payers or policy makers may impact equilibrium quality eort
and wait time. One might hypothesize that if out-of-pocket payments drop, moral hazard would
increase and wait times would go up. In this model, however, quality eort is the lever used
by the provider(s) to adjust to such a change in payments, as the provider would decrease its
quality eort in order to leave wait times unchanged.
The third insight is that higher wait sensitivity leads to higher quality and lower wait,
whereas higher quality sensitivity may lead to lower quality eort. From Table 2.1 we see that
increasing wait time sensitivity leads to lower wait times and higher quality eort. The
com-plement is not true with regard to quality eort sensitivity. Increasing quality eort sensitivity
always leads to higher wait times because consumers are willing to wait longer for a service which
gives them higher value. Increasing quality sensitivity does not necessarily lead to higher quality
eort. While optimal quality eortx∗is not always increasing in quality eort sensitivity,β, the
optimal utility consumers earn from quality eort, βx∗, is increasing in β. Equilibrium quality
eort at a given provider is increasing in quality eort sensitivity if and only if β ≤ 4z2(chq+cδ) and decreasing otherwise. The result may seem counter-intuitive as it states that under certain
conditions, namely when the consumer sensitivity to quality is low, an increase in consumer
quality sensitivity may cause the provider to invest less in quality eort. If quality
sensitiv-ity increases, the consumers are willing to wait longer for service. If the optimal wait-time is
relatively high, the provider would prefer to decrease quality eort so that consumers receive
the same eective value from service and wait times do not increase too dramatically. Optimal
(equilibrium) service rate at a given provider is increasing in quality eort sensitivity if and only
the value consumers in the market receive from service relative to the disutility they receive
from wait time.
From Table 2.1 we also nd that the loss of social welfare due to competition is higher when
costs are higher. The implication for policy makers is that programs, such as Certicate of Need,
aimed at limiting competition in health care markets should continue to emphasize controlling
high-cost medical services where the loss to society due to competition is greater, e.g. transplant
services, cardiac surgery services, advanced radiation and imaging equipment. Social welfare
loss is higher when the out-of-pocket payment is higher. The loss of social eciency due to
competition can be mitigated if government regulation or insurers reduce the out-of-pocket
payment. However, this reduction in social welfare loss will be connected to a reduction in
quality eort. Social welfare loss is also increasing in consumer sensitivity to wait-time and
decreasing in consumer sensitivity to quality. Previous economic theory suggests that a loss of
social welfare will occur when prices are xed and rms compete on quality, but as discussed
in the Literature Review section of this chapter, these papers have not explicitly incorporated
wait-time dynamics. Our analysis shows that including consumer sensitivity to wait-time only
increases the loss of social welfare as the loss is present even when the wait-time sensitivity, h,
is zero. The loss of social welfare increases as wait-time sensitivity increases because a single
provider can more eciently invest in service capacity as a buer against arrival and service
variation in the market.
It is also important to understand the eect of the parameterδ which represents the
correla-tion between quality eort and eective capacity. One key nding from these results is that the
loss of social welfare is higher whenδis higher (higherδimplies a greater reduction in capacity).