Virus Type 1 in Japan: a Collaborative Study
Madoka Kuramitsu,aKazu Okuma,aTadanori Yamochi,bTomoo Sato,cDaisuke Sasaki,dHiroo Hasegawa,dKazumi Umeki,e Ryuji Kubota,fRieko Sobata,gChieko Matsumoto,gNoriaki Kaneko,hIsao Naruse,hMakoto Yamagishi,bMakoto Nakashima,b Haruka Momose,aKumiko Araki,aTakuo Mizukami,aSaeko Mizusawa,aYoshiaki Okada,aMasaki Ochiai,iAtae Utsunomiya,j Ki-Ryang Koh,kMasao Ogata,lKisato Nosaka,mKaoru Uchimaru,nMasako Iwanaga,oYasuko Sagara,pYoshihisa Yamano,c Masahiro Satake,gAkihiko Okayama,eManabu Mochizuki,qShuji Izumo,fShigeru Saito,rKazuo Itabashi,sShimeru Kamihira,t Kazunari Yamaguchi,aToshiki Watanabe,bIsao Hamaguchia
Department of Safety Research on Blood and Biological Products, National Institute of Infectious Diseases, Tokyo, Japana
; Department of Medical Genome Sciences, Laboratory of Tumor Cell Biology, Graduate School of Frontier Sciences, The University of Tokyo, Tokyo, Japanb
; Department of Rare Diseases Research, Institute of Medical Science, St. Marianna University School of Medicine, Kawasaki, Japanc
; Department of Laboratory Medicine, Nagasaki University Graduate School of Biomedical Sciences, Nagasaki, Japand
; Department of Rheumatology, Infectious Diseases and Laboratory Medicine, University of Miyazaki, Miyazaki, Japane
; Division of Molecular Pathology, Center for Chronic Viral Diseases, Graduate School of Medical and Dental Sciences, Kagoshima University, Kagoshima, Japanf
; Central Blood Institute, Blood Service Headquarters, Japanese Red Cross Society, Tokyo, Japang
; Department of Special Testing, SRL Inc., Tokyo, Japanh
; Department of Quality Assurance and Radiological Protection, National Institute of Infectious Diseases, Tokyo, Japani
; Department of Hematology, Imamura Bun-in Hospital, Kagoshima, Japanj
; Department of Hematology, Osaka General Hospital of West Japan Railway Company, Osaka, Japank
; Blood Transfusion Center, Oita University Faculty of Medicine, Oita, Japanl
; Department of Hematology, Kumamoto University of Medicine, Kumamoto, Japanm
; Department of Hematology/Oncology, Research Hospital, Institute of Medical Science, The University of Tokyo, Tokyo, Japann
; Department of Frontier Life Science, Nagasaki University Graduate School of Biomedical Sciences, Nagasaki, Japano
; Japanese Red Cross Kyushu Block Blood Center, Fukuoka, Japanp
; Department of Ophthalmology and Visual Science, Graduate School of Medical and Dental Sciences, Tokyo Medical and Dental University, Tokyo, Japanq
; Department of Obstetrics and Gynecology, University of Toyama, Toyama, Japanr
; Department of Pediatrics, Showa University School of Medicine, Tokyo, Japans
; Nagasaki Harbor Medical Center, ITREC, Nagasaki, Japant
Quantitative PCR (qPCR) analysis of human T-cell leukemia virus type 1 (HTLV-1) was used to assess the amount of HTLV-1 provirus DNA integrated into the genomic DNA of host blood cells. Accumulating evidence indicates that a high proviral load is one of the risk factors for the development of adult T-cell leukemia/lymphoma and HTLV-1-associated myelopathy/tropical spastic paraparesis. However, interlaboratory variability in qPCR results makes it difficult to assess the differences in reported proviral loads between laboratories. To remedy this situation, we attempted to minimize discrepancies between laboratories through standardization of HTLV-1 qPCR in a collaborative study. TL-Om1 cells that harbor the HTLV-1 provirus were serially diluted with peripheral blood mononuclear cells to prepare a candidate standard. By statistically evaluating the proviral loads of the standard and those determined using in-house qPCR methods at each laboratory, we determined the relative ratios of the measured values in the laboratories to the theoretical values of the TL-Om1 standard. The relative ratios of the laboratories ranged from 0.84 to 4.45. Next, we corrected the proviral loads of the clinical samples from HTLV-1 carriers using the relative ratio. As expected, the overall differences between the laboratories were reduced by half, from 7.4-fold to 3.8-fold on average, after applying the correction. HTLV-1 qPCR can be standardized using TL-Om1 cells as a standard and by determining the rela-tive ratio of the measured to the theoretical standard values in each laboratory.
H
uman T-cell leukemia virus type 1 (HTLV-1) is present in certain regions of endemicity, including sub-Saharan Af-rica, the Caribbean, parts of South AmeAf-rica, the Middle East, Melanesia, and southwest Japan (1,2). HTLV-1 mainly infects vertically from infected mothers to children through breast-feeding and horizontally between adults by sexual intercourse and transmission through transfusions with blood products. Although the majority of infected people live without any symptoms, some HTLV-1 carriers suffer from adult T-cell leu-kemia (ATL), HTLV-1-associated myelopathy/tropical spastic paraparesis (HAM/TSP), and HTLV-1 uveitis/HTLV-1-associ-ated uveitis after a long period of latency (3).HTLV-1 mainly infects CD4-positive peripheral blood cells, and the provirus is integrated into the host genome. Generally, HTLV-1 infection is determined by serological testing. Detection of proviral DNA in peripheral blood mononuclear cells (PBMCs) by PCR is one of the methods to detect the infection. Quantitation of both the provirus and a cellular gene in PBMCs by TaqMan quantitative PCR (qPCR) enables calculation of the percentages of
Received24 June 2015 Returned for modification16 July 2015
Accepted17 August 2015
Accepted manuscript posted online19 August 2015
CitationKuramitsu M, Okuma K, Yamochi T, Sato T, Sasaki D, Hasegawa H, Umeki K, Kubota R, Sobata R, Matsumoto C, Kaneko N, Naruse I, Yamagishi M, Nakashima M, Momose H, Araki K, Mizukami T, Mizusawa S, Okada Y, Ochiai M, Utsunomiya A, Koh K-R, Ogata M, Nosaka K, Uchimaru K, Iwanaga M, Sagara Y, Yamano Y, Satake M, Okayama A, Mochizuki M, Izumo S, Saito S, Itabashi K, Kamihira S, Yamaguchi K, Watanabe T, Hamaguchi I. 2015. Standardization of quantitative PCR for human T-cell leukemia virus type 1 in Japan: a
collaborative study. J Clin Microbiol 53:3485–3491.doi:10.1128/JCM.01628-15.
Editor:Y.-W. Tang
Address correspondence to Isao Hamaguchi, [email protected].
Supplemental material for this article may be found athttp://dx.doi.org/10.1128
/JCM.01628-15.
Copyright © 2015, American Society for Microbiology. All Rights Reserved.
on May 16, 2020 by guest
http://jcm.asm.org/
infected cells in the peripheral blood (proviral load [PVL] [copies per 100 cells]). Accumulating evidence shows that a high PVL is a risk factor for the development of ATL and HAM/TSP. Therefore, it is expected that HTLV-1 qPCR can be an effective tool to assess the risk for development of these diseases (4,5).
Several in-house qPCR methods to quantitate the PVL are used in many laboratories in Japan. However, the materials for the qPCR standard curve and primers for the HTLV-1 provirus and cellular control genes vary among laboratories. There are at least five cellular internal control (IC) genes used in Japanese laborato-ries (albumin gene,-actin gene,-globin gene, CD81 gene, re-combination-activating gene 1, and RNase P gene). These condi-tions give rise to difficulty in direct comparison of PVLs across laboratories. For example, when the PVL was analyzed in the same samples among laboratories in Japan, there were up to 5-fold dif-ferences between the laboratories (6). For this reason, standard-ization of HTLV-1 qPCR is required to predict the risk for devel-opment of HTLV-1-associated diseases correctly.
WHO international standards (ISs) of nucleic acid amplifica-tion techniques (NATs) have been established for human immu-nodeficiency virus type 1, hepatitis B virus, and hepatitis C virus, and positive plasma samples that have been assigned international units for these viruses are available (7–9). However, a defined IS has not been established for HTLV-1 NATs. Because the target material of HTLV-1 qPCR is genomic DNA obtained from cells, we considered that a specific cell type would be a desirable mate-rial for the HTLV-1 qPCR standard.
Previously, we found that the HTLV-1 provirus copy number in TL-Om1 cells, an ATL cell line, is 1.8 copies/cell, and its karyo-type is polyploidy of 4N (10). These precise genomic properties are useful for TL-Om1 cells to be a candidate material for the HTLV-1 qPCR standard.
In this study, we hypothesized that standardization of HTLV-1 qPCR could be achieved by using TL-Om1 cells as a standard material for HTLV-1 qPCR. To minimize the differences between laboratories, we tried to correct PVLs by adjusting the results of laboratories to absolute values of the standard prepared with the TL-Om1 cell line. A collaborative study was conducted with the participation of eight laboratories that perform HTLV-1 qPCR routinely in Japan.
MATERIALS AND METHODS
Plasmid, cells, and cell culture.The plasmid used in this study (pUC-HTLV-1) has been reported previously (6). In brief, pUC-HTLV-1 was prepared by ligating a SacI-digested fragment of HTLV-1 (equivalent to the region from nucleotide [nt] 503 to 8780 of ATK-1; NCBI accession numberJ02029) into the SacI cloning site of pUC18.
TL-Om1 cells were a kind gift from Kazuo Sugamura (Miyagi Cancer Center Research Institute) (11). Jurkat clone E6-1 cells were obtained from the American Type Culture Collection (Manassas, VA, USA). PBMCs were purchased from AllCells Inc. (Alameda, CA, USA). TL-Om1 cells were maintained in RPMI 1640 (Sigma, St. Louis, MO, USA) supple-mented with 10% fetal bovine serum (FBS), 100 U/ml penicillin-strepto-mycin (Invitrogen, Carlsbad, CA, USA), 2 mmol/literL-glutamine, and 10 ng/ml interleukin-2 (PeproTech, London, United Kingdom). Jurkat cells were maintained in RPMI 1640 supplemented with 10% FBS containing 100 U/ml penicillin-streptomycin and 2 mmol/literL-glutamine. Cryo-preserved PBMCs were resuspended in RPMI 1640 supplemented with 10% FBS at 37°C according to the protocol provided by AllCells Inc.
Clinical samples and extraction of genomic DNA.The study was approved by the ethical review boards at the National Institute of Infec-tious Diseases (IRB approval no. 392). HTLV-1-positive peripheral blood
samples were obtained from healthy HTLV-1 carriers registered in the Joint Study on Predisposing Factors of ATL Development (JSPFAD) as follows. PBMCs were separated from the blood samples by Percoll density gradient centrifugation at the National Institute of Infectious Diseases. The PBMCs were resuspended in Cellbanker (TaKaRa Bio, Osaka, Japan) at 1⫻106cells per 100l and frozen at lower than⫺80°C. Frozen PBMCs packed in dry ice were then provided to the laboratories by the National Institute of Infectious Diseases. Genomic DNA was extracted using QIAamp blood DNA mini-, midi-, or maxikits (Qiagen, Hilden, Ger-many) according to the manufacturer’s instructions or by SDS-proteinase K digestion and phenol-chloroform extraction followed by ethanol pre-cipitation. The concentration of purified DNA was measured with a NanoDrop 2000 spectrophotometer (Thermo Scientific, Yokohama, Ja-pan) or a Qubit fluorometric quantitation kit (Life Technologies, Tokyo, Japan).
Preparation of HTLV-1 qPCR standards.To evaluate candidate ma-terials for HTLV-1 qPCR standardization, we prepared TL-Om1 cells di-luted with PBMCs at 20, 4, 0.8, and 0.16% and TL-Om1 cells didi-luted with Jurkat cells at 10, 2, 0.4, and 0.08%. TL-Om1 cells diluted with PBMCs were prepared at laboratory B, and TL-Om1 cells diluted with Jurkat cells were prepared at laboratory A. TL-Om1 cells, PBMCs, and Jurkat cells suspended in Cellbanker at 1⫻107cells/ml were serially diluted at each of
the indicated concentrations. The cells were then resuspended at 1⫻106
cells per 100l and frozen at lower than⫺80°C until use.
To confirm whether TL-Om1 cells were diluted correctly, a serial di-lution of TL-Om1 cells with uninfected PBMCs was prepared as follows. TL-Om1 cells were stained with carboxyfluorescein diacetate succinimi-dyl ester (CFSE) (Sigma) according to the manufacturer’s protocol. Briefly, TL-Om1 cells suspended at 1⫻106cells/ml in 0.1% bovine serum
albumin–phosphate-buffered saline were stained with CFSE at a final concentration of 1M and then incubated for 10 min at 37°C. The cells were resuspended in a 5-fold volume of RPMI 1640 supplemented with 10% FBS and incubated at 4°C for 5 min. The cells were then washed three times with RPMI 1640 supplemented with 10% FBS at 4°C. Stained TL-Om1 cells were cultured for 3 days and then harvested. TL-TL-Om1 cells and PBMCs were washed twice with RPMI 1640 supplemented with 10% FBS at 4°C. The TL-Om1 cells were serially diluted with PBMCs at 20, 4, 0.8, and 0.16%. The concentrations of TL-Om1 cells were calculated from the percentages of CFSE-positive cells analyzed at the National Institute of Infectious Diseases using flow cytometry with a JSAN flow cytometer (Bay Bioscience, Kobe, Japan). The plasmid (pUC-HTLV-1) used as a reference was prepared by diluting with purified genomic DNA from PBMCs.
qPCR and correction of PVLs.Eight Japanese laboratories (one na-tional institute laboratory, five university laboratories, one Japanese Red Cross laboratory, and one diagnostic test company laboratory) partici-pated in this study. The protocols for HTLV-1 qPCR performed in the eight laboratories have been reported previously (5,12–18) (see Table S1 in the supplemental material). To evaluate candidate materials for the HTLV-1 standard, the laboratories extracted DNA from the panel of di-lutions and measured the PVL once. To standardize HTLV-1 qPCR, PVLs (copies per 100 cells) were measured with purified DNA in laboratories independently three times on different days. To evaluate all steps of the preparation, each measurement began with extraction of genomic DNA from new frozen samples, and testing was performed once with the ex-tracted DNA. The analyses were performed in 2011 and again in 2013. Results were statistically analyzed at the National Institute of Infectious Diseases with the parallel-line assay (PLA), and relative ratios to the the-oretical values of PVLs in TL-Om1 cell dilutions were calculated for each laboratory (19). The PLA is a statistical method used to evaluate the po-tency of international or national standards for biologics. The PVLs mea-sured in each laboratory were then corrected based on the relative ratio. Correction of clinical PVLs was made by dividing the measured PVLs by the relative ratio of each laboratory.
on May 16, 2020 by guest
http://jcm.asm.org/
RESULTS
Evaluation of candidate materials for HTLV-1 qPCR standards. For standardization of HTLV-1 qPCR, we tried to fit measured values from the various laboratories to the theoretical values of the standard. In addition, to avoid differences because of specific con-centrations, we analyzed the measured values at several concen-trations of diluted cells.
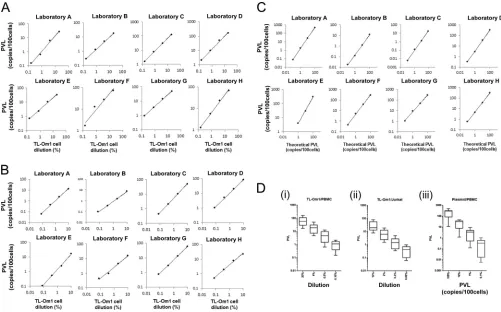
To determine appropriate candidate materials for standardiza-tion of HTLV-1 q-PCR, we prepared three different types of ma-terials. Two sets were prepared from TL-Om1 cells diluted with PBMCs (TL-Om1 cell concentrations of 0.16, 0.8, 4, and 20%) or Jurkat cells (TL-Om1 concentrations of 0.08, 0.4, 2, and 10%), and the other set was a plasmid diluted with genomic DNA from hu-man PBMCs (0.1, 1, 10, and 100 copies per cells). Genomic DNA was extracted from these samples, and the PVL was measured by the eight laboratories with their in-house qPCR methods (see Ta-ble S1 in the supplemental material). All three candidate materials showed linear correlations between the concentration of the stan-dard material and the measured values in a dose-dependent man-ner in all laboratories (Fig. 1AtoC; see Table S2 in the supplemen-tal material).
By focusing on each dilution, the PVLs obtained from
measur-ing the plasmid dilutions showed a larger variation between labo-ratories at all concentrations (differences ranged from 39- to 173-fold) than those from the other two cell dilution panels (9.5- to 19.7-fold for Om1 cells/PBMCs and 10.5- to 15.7-fold for TL-Om1 cells/Jurkat cells) (Fig. 1D; see Table S3 in the supplemental material).
Based on these results, we found that TL-Om1 cells diluted with PBMCs or Jurkat cells are suitable standard materials, be-cause the use of these standards by the laboratories to measure PVLs was more accurate than use of the plasmid candidate.
Preparation and determination of PVLs in cell dilution stan-dards.Because the karyotype of PBMCs is strictly 2N, we considered that PBMCs would be more appropriate than Jurkat cells to prepare the standard in this study. Therefore, to normalize the results of HTLV-1 qPCR obtained by different methods and laboratories, we prepared a panel of TL-Om1 cell dilutions. The concentrations for the standard were 0.16, 0.8, 4, and 20% TL-Om1 cells in PBMCs. These concentrations were chosen to cover the range of PVLs that were observed in HTLV-1 carriers (4). PVLs of these TL-Om1 cell dilutions were calculated from both the percentage of TL-Om1 cells in PBMCs, which was analyzed by flow cytometry, and the copy number of HTLV-1 provirus and karyotype of TL-Om1 cells as
re-FIG 1Evaluation of TL-Om1 cell dilution panels for HTLV-1 qPCR standardization. (A to C) Proviral loads (PVLs) (copies/100 cells) of candidate standards for HTLV-1 qPCR were measured by eight Japanese laboratories (laboratories A to H) as TL-Om1 cell dilutions with PBMCs (A), TL-Om1 cell dilutions with Jurkat cells (B), and plasmid DNA dilutions with PBMC genomic DNA (C). Results of each dilution are plotted in the log-log graphs. The horizontal axis shows the percent dilution of TL-Om1 cells. The vertical axis shows the measured values in each laboratory. Lines show evaluation of the linear correlation between TL-Om1 cell dilutions (percent) and measured values (PVL, copies/100 cells) in each laboratory. (D) Distribution of results from laboratories using the candidate standards. Data are shown as box plots. The horizontal bar in the box of the graph shows the median. Error bars show the maximum to minimum scores. (i) TL-Om1 cells diluted with PBMCs; (ii) TL-Om1 cells diluted with Jurkat cells; (iii) HTLV-1 plasmid DNA diluted with PBMC genomic DNA. For detailed statistical data, see Table S3 in the supplemental material.
on May 16, 2020 by guest
http://jcm.asm.org/
[image:3.585.40.541.66.378.2]ported previously (10) (Fig. 2AandTable 1). These prepared aliquots of cells were frozen and provided to the eight laboratories.
Standardization of HTLV-1 qPCR using TL-Om1 cell dilu-tions.First, we evaluated differences in the laboratories against the
theoretical values of the TL-Om1 cell dilutions. Genomic DNA of these TL-Om1 cell dilutions was extracted in each laboratory, and the PVL of each dilution was measured by in-house qPCR methods.
To assess accuracy, the panel of TL-Om1 cell dilutions was measured three times independently on different days to deter-mine the day-to-day variation. Additionally, to assess reproduc-ibility, these procedures were performed twice across years. The results were statistically analyzed with the PLA. As shown inTable 2, the relative ratio of the value obtained in each laboratory to the theoretical value was calculated. The majority of laboratories had a small range of 95% confidence intervals, indicating that the lab-oratories could measure the PVL accurately. The relative ratio for each laboratory varied from 0.84 to 4.45 in 2011. A maximal 5.3-fold difference was observed between laboratories. In addition, a maximal 2.8-fold difference was observed in 2013. The relative ratios for each laboratory measured in 2011 and 2013 were similar, indicating high reproducibility over time.
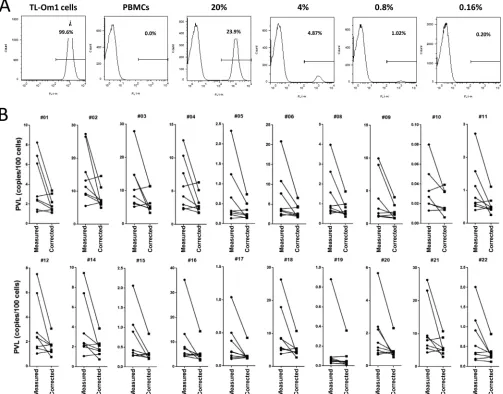
[image:4.585.42.545.70.464.2]FIG 2Standardization of HTLV-1 qPCR with standard materials prepared from cells. (A) Analysis of the concentrations of TL-Om1 cells diluted with uninfected PBMCs by flow cytometry. TL-Om1 cells stained with CFSE were diluted with unstained PBMCs at 20, 4, 0.8, and 0.16%. The percentage of CFSE-positive cells was defined as the concentration of TL-Om1 cells. (B) PBMCs from HTLV-1 carriers (registered in JSPFAD) were analyzed for their PVLs by the eight laboratories. Panels show the PVLs (copies/100 cells) of measured values and corrected values. Corrections were made by dividing measured values by the relative ratio for each laboratory, which is shown inTable 1. Among 22 samples, two samples (07 and 13) were eliminated from the analyses because they had negative qPCR results in several laboratories. In addition, the PVLs of these two samples measured in other laboratories were extremely low.
TABLE 1Calculation of theoretical values of the TL-Om1 cell dilutionsa
Sample name
% of TL-Om1 cells
Copies/100 cells
HTLV-1
gene IC gene
Theoretical PVL
20% 23.9 43.5 247.8 35.1
4% 4.87 8.86 209.7 8.45
0.8% 1.02 1.86 202.0 1.84
0.16% 0.20 0.37 200.4 0.37
aCalculations were performed by setting the HTLV-1 gene copy number in TL-Om1
cells as 1.8 copies/cell, the IC (RNase P) gene copy number in TL-Om1 cells as 4 copies/ cell, and the IC gene copy number in PBMCs as 2 copies/cell.
on May 16, 2020 by guest
http://jcm.asm.org/
Next, we examined the usefulness of the TL-Om1 cell line to stan-dardize HTLV-1 qPCR for clinical samples. Twenty PBMC samples isolated from the blood of healthy HTLV-1 carriers who were regis-tered in JSPFAD (see Materials and Methods) were subjected to DNA extraction in each laboratory. The PVLs in these DNA samples were measured by in-house HTLV-1 qPCR methods in each laboratory. Next, the carrier PVLs were corrected by dividing by the relative ratio of each laboratory. After the correction, as shown inFig. 2B, the dif-ference between laboratories became apparently smaller for all sam-ples. The average of maximum interlaboratory differences was re-duced by half, from 7.4- to 3.8-fold. In addition, the PVLs measured at seven laboratories coincided for some samples (for example, sam-ples 15, 16, 17, 18, and 20) after the correction, indicating that these
laboratories would be able to perform testing with high accuracy. These results strongly indicated that HTLV-1 qPCR could be stan-dardized by applying this method.
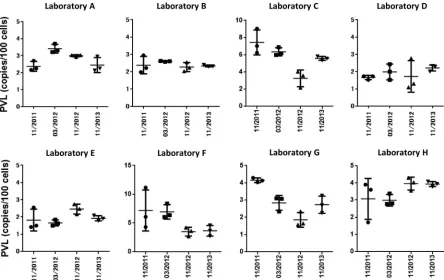
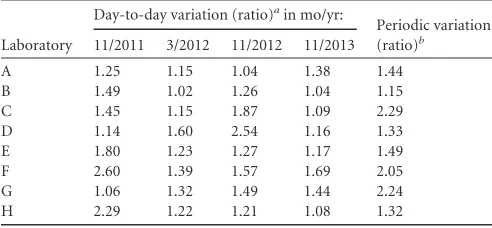
Evaluation of intralaboratory differences in HTLV-1 qPCR by day-to-day and periodic analysis.Although the results from the majority of laboratories were consistent after the correction, slight differences were still observed in some laboratories. We analyzed the sequences of the qPCR target regions in the HTLV-1 genome in 18 out of 20 carrier samples, but there were no critical mutations that could cause the differences (data not shown). Last, to evaluate and monitor the long-term reproducibility of the test methods, the same samples were measured as a run control by all laboratories for 3 years periodically, followed by evaluation of day-to-day and periodic re-producibility (Fig. 3). Day-to-day variations were 2.6-fold between maximum and minimum values in laboratory F in November 2011, although the day-to-day variations in all laboratories were extremely small throughout the study (Table 3). In addition, similar results were obtained in the evaluation of reproducibility. We compared the means of three independent measurements across four testing peri-ods. Variations of about 2-fold were observed in laboratories C, F, and G, whereas extremely small variations were found throughout the testing periods for the majority of laboratories (Table 3). These results strongly indicated that laboratories could obtain reproducible results with the same samples.
DISCUSSION
[image:5.585.40.287.87.209.2]As JSPFAD investigators have found that a high PVL is a risk factor for the development of ATL (4), measurement of the PVL by qPCR has become an important test to predict and control the
TABLE 2Relative ratios of laboratory values to the theoretical values of the PVLs of TL-Om1 cell dilutions
Laboratory
First study (2011) Second study (2013)
Relative ratioa
95% confidence interval
Relative ratio
95% confidence interval
A 1.38 1.13–1.70 1.38 1.09–1.75
B 1.27 1.11–1.46 1.25 1.10–1.41
C 4.45 3.53–5.65 2.94 2.57–3.38
D 0.84 0.72–0.96 1.30 0.91–1.87
E 0.91 0.65–1.26 1.05 0.97–1.13
F 3.16 2.05–5.00 2.35 1.49–3.84
G 2.45 1.90–3.20 1.62 1.27–2.06
H 1.58 1.07–2.35 2.04 1.87–2.23
aThese values were used for correction in the multicenter study.
FIG 3Day-to-day and periodic variations of measured values in the eight laboratories All laboratories measured the PVL of 0.8% TL-Om1 cells in PBMCs as a run control for 3 years. In each testing period, measurements were performed three times independently on different days. Dots show the PVL (copies/100 cells) for each laboratory in each testing period. The bars indicates the averages of the results.
on May 16, 2020 by guest
http://jcm.asm.org/
[image:5.585.70.514.411.691.2]disease. A method that can accurately measure a PVL of at least 4% is indispensable. However, the major problem in monitoring PVLs so far is difficulty in comparing the qPCR results across laboratories, because there is at most a 5-fold difference among laboratories in Japan (6). To standardize HTLV-1 qPCR, we con-sidered that standardization could be achieved if all materials and methods were unified in all laboratories. However, unifying these methods might affect further development or improvement of HTLV-1 qPCR. In this study, using a panel of serial dilutions of TL-Om1 cells with PBMCs as the standard, we successfully matched the results of laboratories to the theoretical values by using correction factors determined by analysis of differences in the results of laboratories from the standard. Our standardization method minimized the differences in clinical PVL data between laboratories, which would greatly contribute to reliable measure-ments of PVLs and evaluation of PVLs.
Although our approach to standardization with a cell reference worked well in the majority of laboratories, some laboratories showed slight differences in the relative ratio between two inde-pendent years (Table 2). These laboratories also showed a rela-tively wide range of variations in the evaluation of periodic varia-tions compared with the other laboratories (Fig. 3). Based on these results, one of the possible causes of the discrepancy between lab-oratories after the correction may be intralaboratory variability. A solution to improve the periodic reproducibility would be a run control that could monitor the trend of results over time.
To standardize HTLV-1 qPCR, it was important to prepare a suitable standard from a specific cell type. An example of a cell-based IS has been previously reported for quantitation of BCR-ABL mRNA to monitor the therapeutic response in patients with chronic myelogenous leukemia, in which the standard is prepared from K562 cells diluted in HL60 cells (20). Similar to the IS for quantitation of BCR-ABL mRNA, the formula of target samples for HTLV-1 qPCR and our TL-Om1 cell candidate standard are extremely similar. Thus, the TL-Om1 cell standard would behave similarly even though different measurement procedures are ap-plied. Moreover, because the precise genomic properties of the HTLV-1 provirus and IC genes in TL-Om1 cells have been defined previously (10), the experiments in this study could be accom-plished with absolute gene copy numbers.
There are several HTLV-1 molecular subtypes, including Cos-mopolitan subtype A, Central African subtype B, Australo-Mela-nesian subtype C, and Central African/Pygmies subtype D. Rare cases found in Central Africa are classified as subtypes E, F, and G
(2). Cosmopolitan subtype A is divided into four subsubtypes: Transcontinental (A), Japanese (B), West African (C), and North African (D). HTLV-1 subtypes in Japan include Cosmopolitan subtype A subsubtype Japanese (B) and subsubtype Transconti-nental (A) (2). The sequences of HTLV-1 primers and probes used in Japanese laboratories are also completely homologous with the genomic sequence of HTLV-1 in TL-Om1 cells (NCBI accession numberAB979451). The majority of laboratories use primers for the pX region of the HTLV-1 genome in their qPCR methods. Similarly, a comparison of primer sequences for HTLV-1 subtypes and TL-Om1 cells may be required at first. Otherwise laboratories can use primer and probe sets that have been specially developed to detect all HTLV-1 subtypes as well as HTLV-2 and HTLV-3 (21). However, we believe the standardization of HTLV-1 qPCR in a variety of areas would be achieved by using TL-Om1 cells as a standard material, because the sequence of the pX region is well conserved among HTLV-1 strains.
In this study, we analyzed four TL-Om1 cell dilutions. Relative ratios to the theoretical values were calculated by PLA. Although PLA is a major method to evaluate the potency of biological ma-terials, the relative ratio calculated statistically by PLA and those simply calculated by data obtained at only one dilution of 0.8% TL-Om1 cells were extremely similar in all laboratories (Tables 2 and4). The intralaboratory variations between testing periods in a laboratory were much larger than the differences in calculation methods (Fig. 3). This result shows that the standard is applicable to a wide range of concentrations for HTLV-1 qPCR. In the future, international or national standards for HTLV-1 qPCR could be possible using either a serial dilution or single dilution of TL-Om1 cells.
In conclusion, we confirmed that standardization of HTLV-1 qPCR can be achieved using a standard material prepared from TL-Om1 cells.
ACKNOWLEDGMENTS
This work was supported by grants-in-aid for scientific research and a Health and Labor Sciences research grant (H23-shinkou-ippan-016 and H26-shinkoujitsuyouka-ippan-013) from the Ministry of Health, Labor and Welfare of Japan.
REFERENCES
1.Satake M, Yamaguchi K, Tadokoro K. 2012. Current prevalence of HTLV-1 in Japan as determined by screening of blood donors. J Med Virol
84:327–335.http://dx.doi.org/10.1002/jmv.23181.
2.Gessain A, Cassar O.2012. Epidemiological aspects and world
distribu-TABLE 3Day-to-day and periodic variations of measured values in the eight laboratories
Laboratory
Day-to-day variation (ratio)ain mo/yr:
Periodic variation (ratio)b 11/2011 3/2012 11/2012 11/2013
A 1.25 1.15 1.04 1.38 1.44
B 1.49 1.02 1.26 1.04 1.15
C 1.45 1.15 1.87 1.09 2.29
D 1.14 1.60 2.54 1.16 1.33
E 1.80 1.23 1.27 1.17 1.49
F 2.60 1.39 1.57 1.69 2.05
G 1.06 1.32 1.49 1.44 2.24
H 2.29 1.22 1.21 1.08 1.32
aRatio between maximum and minimum PVLs in a time period. b
[image:6.585.40.286.87.201.2]Ratio between maximum and minimum mean PVLs among four time periods.
TABLE 4Relative ratios of laboratory to theoretical values determined simply by comparison of the 0.8% TL-Om1 single dilution
Laboratory
First study (2011) Second study (2013)
Relative ratio
95% confidence interval
Relative ratio
95% confidence interval
A 1.28 0.95–1.73 1.31 0.85–2.04
B 1.28 0.76–2.13 1.27 1.21–1.35
C 4.00 2.49–6.41 3.01 2.73–3.35
D 0.90 0.75–1.08 1.27 0.98–1.46
E 0.95 0.42–2.14 0.97 0.86–1.26
F 3.61 1.09–11.97 1.48 1.01–3.72
G 2.26 2.09–2.44 1.22 0.93–2.33
H 1.57 0.50–4.89 2.06 1.95–2.35
on May 16, 2020 by guest
http://jcm.asm.org/
[image:6.585.297.545.87.209.2]tion of HTLV-1 infection. Front Microbiol3:388.http://dx.doi.org/10 .3389/fmicb.2012.00388.
3.Watanabe T.2011. Current status of HTLV-1 infection. Int J Hematol
94:430 – 434.http://dx.doi.org/10.1007/s12185-011-0934-4.
4.Iwanaga M, Watanabe T, Utsunomiya A, Okayama A, Uchimaru K, Koh KR, Ogata M, Kikuchi H, Sagara Y, Uozumi K, Mochizuki M, Tsukasaki K, Saburi Y, Yamamura M, Tanaka J, Moriuchi Y, Hino S, Kamihira S, Yamaguchi K, Joint Study on Predisposing Factors of ATL Development Investigators.2010. Human T-cell leukemia virus type I (HTLV-1) proviral load and disease progression in asymptomatic HTLV-1 carriers: a nationwide prospective study in Japan. Blood116:
1211–1219.http://dx.doi.org/10.1182/blood-2009-12-257410.
5.Takenouchi N, Yamano Y, Usuku K, Osame M, Izumo S.2003. Use-fulness of proviral load measurement for monitoring of disease activity in individual patients with human T-lymphotropic virus type I-associated myelopathy/tropical spastic paraparesis. J Neurovirol9:29 –35.http://dx .doi.org/10.1080/13550280390173418.
6.Kamihira S, Yamano Y, Iwanaga M, Sasaki D, Satake M, Okayama A, Umeki K, Kubota R, Izumo S, Yamaguchi K, Watanabe T.2010. Intra-and inter-laboratory variability in human T-cell leukemia virus type-1 proviral load quantification using real-time polymerase chain reaction assays: a multi-center study. Cancer Sci101:2361–2367.http://dx.doi.org /10.1111/j.1349-7006.2010.01720.x.
7.Fryer JF, Heath A, Wilkinson DE, Minor PD, Collaborative Study Group.2011. Collaborative study to evaluate the proposed 4th WHO international standard for hepatitis C virus (HCV) for nucleic acid ampli-fication technology (NAT)-based assays. WHO ECBS report WHO/BS/ 2011.2173. WHO, Geneva, Switzerland.
8.Fryer JF, Heath A, Wilkinson DE, Minor PD, Collaborative Study Group.2011. Collaborative study to evaluate the proposed 3rd WHO international standard for hepatitis B virus (HBV) for nucleic acid ampli-fication technology (NAT)-based assays. WHO ECBS report WHO/BS/ 2011.2170. WHO, Geneva, Switzerland.
9.Davis C, Berry N, Heath A, Holmes H.2008. An international collaborative study to establish a replacement World Health Organization international standard for human immunodeficiency virus 1 RNA nucleic acid assays. Vox Sang95:218 –225.http://dx.doi.org/10.1111/j.1423-0410.2008.01086.x. 10. Kuramitsu M, Okuma K, Yamagishi M, Yamochi T, Firouzi S, Momose
H, Mizukami T, Takizawa K, Araki K, Sugamura K, Yamaguchi K, Watanabe T, Hamaguchi I.2015. Identification of TL-Om1, an adult T-cell leukemia (ATL) cell line, as reference material for quantitative PCR for human T-lymphotropic virus 1. J Clin Microbiol53:587–596.http://dx .doi.org/10.1128/JCM.02254-14.
11. Sugamura K, Fujii M, Kannagi M, Sakitani M, Takeuchi M, Hinuma Y.
1984. Cell surface phenotypes and expression of viral antigens of various human cell lines carrying human T-cell leukemia virus. Int J Cancer34:
221–228.http://dx.doi.org/10.1002/ijc.2910340213.
12. Sobata R, Matsumoto C, Uchida S, Suzuki Y, Satake M, Tadokoro K.
2015. Estimation of the infectious viral load required for
transfusion-transmitted human T-lymphotropic virus type 1 infection (TT-HTLV-1) and of the effectiveness of leukocyte reduction in preventing TT-HTLV-1. Vox Sang109:122–128.http://dx.doi.org/10.1111/vox.12263.
13. Miyazato P, Yasunaga J, Taniguchi Y, Koyanagi Y, Mitsuya H, Mat-suoka M.2006. De novo human T-cell leukemia virus type 1 infection of human lymphocytes in NOD-SCID, common gamma-chain knockout mice. J Virol80:10683–10691.http://dx.doi.org/10.1128/JVI.01009-06. 14. Watanabe M, Ohsugi T, Shoda M, Ishida T, Aizawa S,
Maruyama-Nagai M, Utsunomiya A, Koga S, Yamada Y, Kamihira S, Okayama A, Kikuchi H, Uozumi K, Yamaguchi K, Higashihara M, Umezawa K, Watanabe T, Horie R.2005. Dual targeting of transformed and untrans-formed HTLV-1-infected T cells by DHMEQ, a potent and selective in-hibitor of NF-kappaB, as a strategy for chemoprevention and therapy of adult T-cell leukemia. Blood106:2462–2471.http://dx.doi.org/10.1182 /blood-2004-09-3646.
15. Tanaka G, Okayama A, Watanabe T, Aizawa S, Stuver S, Mueller N, Hsieh CC, Tsubouchi H.2005. The clonal expansion of human T lym-photropic virus type 1-infected T cells: a comparison between serocon-verters and long-term carriers. J Infect Dis191:1140 –1147.http://dx.doi .org/10.1086/428625.
16. Kamihira S, Dateki N, Sugahara K, Hayashi T, Harasawa H, Minami S, Hirakata Y, Yamada Y.2003. Significance of HTLV-1 proviral load quan-tification by real-time PCR as a surrogate marker for HTLV-1-infected cell count. Clin Lab Haematol25:111–117.http://dx.doi.org/10.1046/j.1365 -2257.2003.00503.x.
17. Nagai M, Yamano Y, Brennan MB, Mora CA, Jacobson S.2001. In-creased HTLV-I proviral load and preferential expansion of HTLV-I Tax-specific CD8⫹T cells in cerebrospinal fluid from patients with HAM/TSP. Ann Neurol50:807– 812.http://dx.doi.org/10.1002/ana.10065. 18. Kamihira S, Dateki N, Sugahara K, Yamada Y, Tomonaga M, Maeda T,
Tahara M.2000. Real-time polymerase chain reaction for quantification of HTLV-1 proviral load: application for analyzing aberrant integration of the proviral DNA in adult T-cell leukemia. Int J Hematol72:79 – 84. 19. Finney DJ.1978. Statistical method in biological assay, 3rd ed. Hodder
Arnold, London, United Kingdom.
20. White HE, Matejtschuk P, Rigsby P, Gabert J, Lin F, Lynn Wang Y, Branford S, Muller MC, Beaufils N, Beillard E, Colomer D, Dvorakova D, Ehrencrona H, Goh HG, El Housni H, Jones D, Kairisto V, Kamel-Reid S, Kim DW, Langabeer S, Ma ES, Press RD, Romeo G, Wang L, Zoi K, Hughes T, Saglio G, Hochhaus A, Goldman JM, Metcalfe P, Cross NC.
2010. Establishment of the first World Health Organization international ge-netic reference panel for quantitation of BCR-ABL mRNA. Blood116:e111– 117.http://dx.doi.org/10.1182/blood-2010-06-291641.
21. Moens B, Lopez G, Adaui V, Gonzalez E, Kerremans L, Clark D, Verdonck K, Gotuzzo E, Vanham G, Cassar O, Gessain A, Vandamme AM, Van Dooren S.2009. Development and validation of a multiplex real-time PCR assay for simultaneous genotyping and human T-lymphotropic virus type 1, 2, and 3 proviral load determination. J Clin Microbiol47:3682–3691.http://dx.doi.org/10.1128/JCM.00781-09.