Megan Joseph Freeman
A dissertation submitted to the faculty of the University of North Carolina at Chapel Hill in partial fulfillment of the requirements for the degree of Doctor of Philosophy in the
Department of Psychology (Clinical Psychology).
Chapel Hill 2012
Approved by:
Eric A. Youngstrom, Ph.D. Deborah J. Jones, Ph.D.
ABSTRACT
MEGAN JOSEPH FREEMAN: Gene-Environment Interaction in Early Onset Bipolar Disorder
(Under the direction of Eric A. Youngstrom, PhD)
TABLE OF CONTENTS
LIST OF TABLES……….v
LIST OF FIGURES………..vi
ABBREVIATIONS……….vii
GENE-ENVIRONMENT INTERACTION IN EARLY ONSET BIPOLAR DISORDER….1 EOBD is Increasingly Diagnosed and is Associated with Significant Functional Impairment…….………...2
The Importance of Genes and Environment...………...3
Gene-Environment Research in EOBD is Sparse……….………7
Role of Expressed Emotion in the Developmental Psychopathology of Bipolar Disorder………..8
The Serotonin Transporter Promoter Polymorphism is a Vulnerability Marker for Mood Disorders and Is Associated With Earlier Age of Onset of Bipolar Disorder ………...11
GxE Involving the HTTLPR Are Significant Mechanisms in the Etiology of Mood Disorders…….……….………15
The Importance of Mechanisms………...19
Hypotheses.………..22
METHODS………..………...….……25
Participants………..………....25
Materials and Measures …….……….………...26
ANALYSES..………..………...….……31
Descriptive Statistics………....………....31
Missing Data Analyses …….……….…..……….………...31
Regression …….……….……….………...32
Alpha………..………..………...32
Moderated Mediation …….………….….……….………...33
Power …….……….………....33
RESULTS……….………...34
Demographics and Descriptive Statistics………..………..34
Family Environment, HTTLPR, and Gene-Environment Interaction: Regressions………..………....37
Moderated Mediation Models.………...…………..43
DISCUSSION.………...………...44
Gene-Environment Interaction………....46
Negative Expressed Emotion & Conflictual Family Environment………….47
Positive Expressed Emotion & Positive Family Functioning..………..48
Direct Effect of HTTLPR….………..50
Role of Biased Attention to Emotional Stimuli………..50
Limitations……….….………...51
Future Directions………...52
Conclusion……….….………...54
TABLES………...56
FIGURES……….63
LIST OF TABLES
Table
1. Family history of mental health problems, percent of sample reporting……….56 2. Genotypic frequencies and comparison to worldwide distribution rates, in
percent.………. ………...57 3. Descriptive statistics for mood and family environment questionnaires, scaled as
percent of maximum possible (POMP)…..………..58 4. Affective memory task, average percent correctly recalled……….59
LIST OF FIGURES
Figure
LIST OF ABBREVIATIONS
ADHD Attention Deficit/Hyperactivity Disorder
ANOVA Analysis of variance
BDNF Brain-derived neurotrophic factor
COMT Catechol-O-methyltransferase
DNA Deoxyribonucleic acid
DRD4 Dopamine receptor D4
EE Expressed emotion
EOBD Early-onset bipolar disorder
FAD Family Assessment Device
FES Family Environment Scale
GBI General Behavior Inventory
GxE Gene-environment interaction
HTTLPR, 5-HTTLPR Serotonin transporter promoter polymorphism
MAF Minor allele frequency
MAOA Monoamine oxidase A
PCS Perceived Criticism Scale
POMP Percent of maximum possible
SES Socioeconomic status
SLC6A4 Serotonin transporter gene
Early onset bipolar disorder (EOBD) is a serious psychiatric disorder characterized by marked shifts in energy (Angst, 2009) as well as mood swings involving depression,
irritability, and mania (Youngstrom, Birmaher, & Findling, 2008). Associated symptoms and behaviors include irritability, decreased need for sleep, hypersexuality, and poor judgment that in adults is characterized by risk taking behaviors such as substance abuse,
overspending, and promiscuous sex. EOBD is associated with increased risk for
hospitalization, psychosis, and suicide and decreases in healthy school, peer, and family functioning (Birmaher & Axelson, 2006; Geller, Bolhofner, et al., 2000; Goldstein, et al., 2005). Bipolar disorder is the seventh leading cause of years lost to disability worldwide (World Health Organization, 2008), and in the US, total economic burden has been estimated at over 150 billion dollars per year for bipolar I and bipolar II disorders alone (2009 estimate; Dilsaver, 2011).
Although it is recognized that both genetic makeup inherited from parents as well as environmental experiences contribute to risk for onset of psychiatric disorders and shape the course of these disorders (Rutter, 2009), it is only recently that we have begun to understand the ways in which this might happen. Recent work in gene-environment interaction suggests that genes and environmental experiences make not only unique contributions to mental illness, but also that they interact in complex ways to influence development and
interaction effect that could change risk for EOBD symptomatology. A hostile and conflictual early family environment (“expressed emotion” or EE) combined with a risk allele of a serotonin gene is hypothesized to contribute to elevated symptoms of bipolar disorder in late adolescence. Given the high rates of diagnosis (Blader & Carlson, 2007; Moreno, et al., 2007) and the suffering associated with EOBD (Geller, et al., 2001; Geller, Zimerman, et al., 2000; Goldstein, et al., 2009; Lin, et al., 2006), highly attractive potential outcomes of this study include improved detection of factors that are associated with a heightened risk of developing mood disorders in childhood and a better understanding of how risk factors interact to produce greater or lesser levels of bipolar disorder
symptomatology. On the other hand, negative findings will narrow the field of potential contributing factors to the development and maintenance of bipolar disorder in childhood and adolescence, allowing for a more streamlined approach to detection and treatment. These findings have not only public health implications, but also implications for the many families caring for an individual with bipolar disorder.
Subsequent sections of this paper will expand upon the basis for the proposed hypotheses.
EOBD Is Increasingly Diagnosed and Is Associated With Significant Functional
Impairment
of 1.8% in youth (Van Meter, Moreira, & Youngstrom, 2011). In contrast to this report, several highly publicized reports of increasing rates in the community have elevated concerns of over-diagnosis of early-onset bipolar disorder (EOBD). Between 1996 and 2004, there was an over 400% increase in the number of children discharged from psychiatric hospitals with a diagnosis of bipolar disorder, and a nearly 300% increase for adolescents being given the diagnosis; it is now the most common discharge diagnosis of psychiatrically hospitalized youth based upon chart review studies using clinical diagnoses (Blader & Carlson, 2007). Rates of diagnosis are increasing in outpatient care as well; up to a 40-fold increase between 1994 and 2003 has been reported (Moreno, et al., 2007). Significantly, approximately 60% of adults with bipolar disorder experience the onset of their illness in childhood or adolescence (Lish, Dime-Meenan, Whybrow, Price, & Hirschfeld, 1994).
The early-onset phenotype (illness onset before age 21) may represent an especially genetically driven form of the disorder (Lin, et al., 2006; Rende, et al., 2007) and is
30% had had more than two episodes (Birmaher, et al., 2009). Furthermore, participants had experienced symptoms during 60% of the follow-up period. A five-year follow-up of youth with bipolar disorder not otherwise specified showed that 45% converted to bipolar I or II disorder, and those that converted spent a median of only 32% of follow-up weeks with no or minimal mood symptoms (Axelson, et al., 2011).
Perhaps most concerning, nearly one-third of youth with bipolar disorder have a lifetime history of attempting suicide (Goldstein, et al., 2005), and up to 15% of individuals with bipolar disorder will go on to complete suicide at some point in their lives (Frank & Thase, 1999). In fact, early age of onset is a risk factor for subsequent suicidal behavior in adulthood (Slama, et al., 2004). Youth with bipolar disorder are also at increased risk for substance abuse, and for behavioral, academic, social, and legal problems (Birmaher, 2007). Additionally, youth with EOBD experience greater impairment in relationships with parents, family, and peers than do youth with ADHD or typically developing youth (Geller,
Bolhofner, et al., 2000).
Though a diagnosis of bipolar disorder suggests a lifelong illness that will need to be constantly monitored and managed, there is good evidence that early identification and treatment lead to better outcomes longitudinally (Berk, et al., 2007; Hirschfeld, Lewis, & Vornik, 2003; Lish, et al., 1994; c.f. Cicero, Epler, & Sher, 2009). Identifying and diverting or mitigating the course of a mood disorder beginning in childhood or adolescence could reduce the impact of the psychological, emotional, family, and financial burdens that are associated with bipolar disorder as the illness progresses.
The Importance of Genes and Environment
Although both genetic makeup (McGuffin, et al., 2003) and environment (Sameroff & Seifer, 1983) clearly make unique contributions to the etiology of mental illnesses, it is becoming evident that the interaction between the two may be of equal or greater importance (Moffitt, Caspi, & Rutter, 2006; Neiderhiser, 2001). Gene-environment interaction (GxE) is defined by the effect of an environmental stressor differing depending upon genotype. The concept of GxE is much like the classic “diathesis-stress” model of psychopathology: A pre-existing biological vulnerability to a particular disorder heightens response to an
The study of GxE in mental illness has been called “vital” (Craddock & Russell, 2006). Whereas in the 1980s and early 1990s most scientists dismissed GxE as uncommon and unimportant (Rutter, 2007), molecular geneticists now recognize that GxE is proving to be a pivotal mechanism in the development of many human diseases (Hunter, 2005). Indeed, scientists have been puzzled by the lack of significant findings when genome-wide
association studies of complex medical and psychiatric disorders have been undertaken (Manolio, et al., 2009). This has been called “the case of the missing heritability” (Maher, 2008). Despite thorough, large-scale studies, direct effects of genes are explaining only tiny amounts of the variance in statistical models (e.g., Zeggini, et al., 2008). One of the largest findings to date is in Crohn’s disease, where a meta-analysis of three genome-wide
association studies identified 32 genetic loci which explain just 10% of the overall variance in disease risk and only one fifth of the genetic risk (Barrett, et al., 2008). Though this may seem small, the magnitude dwarfs previous findings for any human disease (except age-related macular degeneration, for which several genes of large effect account for 50% of the heritability; Maller, et al., 2006). Typical findings in psychiatric genetics are tenths of a percent of the variance in risk, or odds ratios of around 1.2 (e.g., Fan & Sklar, 2008; Faraone, et al., 2005), though odds ratios between 2 and 6 can be observed (Hettema, Neale, &
Kendler, 2001; Sullivan, Neale, & Kendler, 2000). The current prevailing belief is that we will never see large effects for single (candidate) genes (Clayton, 2009), and that gene-environment interplay is crucial in explaining complex human behavior such as psychiatric disorders (Narusyte, et al., 2008).
& Hannan, 2007; Rusk & Rusk, 2007; Rutter, 2007). Experts have gone so far as to suggest that the role of genes, especially with regard to psychiatric illnesses, may be to influence the response to the environment (Insel & Collins, 2003)—in other words, that GxE is at the core of the etiology of mental illness. Some have suggested that in any instance in which there is variation in reactions to a major environmental pathogen implicated in a psychiatric disorder (such as childhood maltreatment), GxE must be involved to some extent (Gray & Hannan, 2007; Moffitt, et al., 2006). Gottlieb and Lickliter (2007) proposed that the widespread failure to replicate seen across linkage and association studies in psychiatric genetics is due to failing to consider the effect of “intervening life experiences” (p. 4; i.e., interaction with environment).
Without utilizing techniques exploring gene-environment interplay in genetics research, we cannot be certain that a failure to replicate is due to noneffect of a gene (Hoffmann, Lange, Vansteelandt, & Laird, 2009). Measuring and analyzing the impact of environmental risk factors and known pathogens will lend clarity to the debate over
candidate genes and has the potential to greatly inform etiological models of mental illness. Gene-Environment Research in EOBD is Sparse
Savitz and colleagues (2007) found gene-environment interactions in adults with bipolar disorder: Polymorphisms in the brain derived neurotrophic factor (BDNF) gene and the alipoprotein E gene interacted with a history of sexual abuse, resulting in impaired performance on a memory test. The authors suggest that effects on memory performance related to these gene-environment interactions may represent an endophenotype
(intermediate phenotype) of bipolar disorder. In adults with major depression and bipolar disorder, Mandelli and colleagues (2007) found higher levels of depression in those with a certain form of the catechol-O-methyltransferase (COMT) gene and self-reported history of stressful life events in the past year. More recently, Vinberg and colleagues (2009)
demonstrated increased cortisol response in healthy individuals with familial risk for bipolar disorder and who carried a “met” (risk) allele.
It is likely that GxE also plays a significant role in bipolar disorder symptoms in youth, though to this author’s knowledge current research remains nonexistent in this area. This study will make a significant contribution to the literature as it is the first study examining the important role of gene-environment interplay in pediatric bipolar disorder. Role of Expressed Emotion in the Developmental Psychopathology of Bipolar Disorder
The term “expressed emotion” (EE) denotes high levels of hostility, conflict, and emotional overinvolvement within a family. EE predicts relapse in adults with many
Nuechterlein, Snyder, & Mintz, 1988). Though EE was first described in schizophrenia (Vaughn & Leff, 1976), meta-analysis has demonstrated that EE has a larger effect size for relapse in mood disorders than in schizophrenia (r = .45 vs .31, respectively; Butzlaff & Hooley, 1998).
It is important to note that EE is not always predictive of course or outcome of bipolar disorder in adults. Bipolar individuals’ ratings of severity of criticism by relatives was not predictive of mood disorder symptoms at one-year follow-up in study done by Miklowitz and colleagues (2005); however, those who were more distressed by their relatives’ criticism did experience more severe manic and depressive symptoms as well as fewer days well during the study than less-distressed participants. That is, subjective response to the criticism explained predictions of manic and depressive symptoms, rather than the severity of the criticism itself. In a small sample of remitted patients who had been on lithium prophylaxis for three years, little EE was observed, nor were probands more severely ill over the course of treatment (Priebe, Wildgrube, & Muller-Oerlinghausen, 1989). However, this sample is not likely to be representative of the general bipolar population due to the symptom-free status of the bipolar participants. Finally, individuals in a first-episode schizophrenia and major mood disorders study in Finland failed to show associations between EE and variables such as premorbid and present level of functioning, acuteness of illness onset, and symptom severity (Heikkila, et al., 2002).
outcomes when returning home from psychiatric hospitalization: Those returning to a low EE home were more likely to have recovered one year later, while those returning to a high EE home were more likely to continue to show mood disorder symptoms (Asarnow, Goldstein, Tompson, & Guthrie, 1993). In another study, over the course of two years during which participants received psychotherapy addressing bipolar disorder symptoms, youth with high EE relatives experienced more depressive symptoms regardless of treatment condition (family focused intervention versus treatment as usual) than youth with low EE relatives (Kim & Miklowitz, 2004). In the latter study, more frequent critical comments within the family predicted higher levels of depression and mania in probands at the two-year follow-up, particularly among those not receiving the family treatment intervention. Also in youth with bipolar disorder, those from high conflict families experienced persistent depressive symptoms despite pharmacological treatment (Townsend, Demeter, Youngstrom, Drotar, & Findling, 2007). Another study suggests, however, that among adolescents with bipolar disorder, high-EE attitudes in parents are not associated with current functioning and illness severity (Coville, Miklowitz, Taylor, & Low, 2008).
Thapar, 2006; Sjoberg, et al., 2006; Taylor, et al., 2006). Although these studies considered family stress, they did not use the construct of expressed emotion. Furthermore, there have been no such studies in youth with bipolar disorder, making the proposed study novel in this respect. There are many reasons to suspect that GxE is at work in childhood mood disorders, and the specific serotonin gene chosen for this study has been linked to earlier age of onset bipolar disorder (Bellivier, et al., 2002).
The Serotonin Transporter Promoter Polymorphism Is a Vulnerability Marker for Mood Disorders and Is Associated With Earlier Age of Onset of Bipolar Disorder
Although clear candidate genes have yet to consistently replicate (Barnett & Smoller, 2009), there is a strong case for genetic vulnerabilities to bipolar disorder (Kato, 2007; McInnis, et al., 2003; McQueen, et al., 2005; Potash & DePaulo, 2000). Rates of concordance in monozygotic twins are as high as 79%, versus 19% in dizygotic twins (McGuffin, et al., 2003), strongly suggesting genetic pathways. A 44 base pair (bp) insertion/deletion in the promoter region of the serotonin transporter gene (SLC6A4) has recently garnered attention as one such potential candidate genetic polymorphism (anomaly) (Cho, et al., 2005; Furlong, et al., 1998; Lasky-Su, Faraone, Glatt, & Tsuang, 2005). The serotonin transporter is a logical candidate gene, as serotonergic drugs both effectively treat depression and could be associated with mania in mood disordered patients (Furlong, et al., 1998; Truman, et al., 2007).
produced by varying genotypes of the HTTLPR have demonstrated that the transporters do act differently across genotypes (Fox, Hane, & Pine, 2007).
The S allele of the serotonin transporter has been linked to many interesting psychological and neurobiological correlates, such as poorer response to SSRI treatment (Serretti & Artioli, 2004), increased startle response (Armbruster, et al., 2009), mothers’ lower levels of sensitive responsiveness to toddlers (Bakermans-Kranenburg & van Ijzendoorn, 2008), increased risk for infant insecure attachment (Barry, Kochanska, & Philibert, 2008), and elevated levels of brain activity in response to food stimuli (Kaurijoki, et al., 2008). Additionally, it has been implicated in neuropsychiatric outcomes such as depression (for a review see Brown & Harris, 2008), ADHD (Kopeckova, et al., 2008) and adult ADHD (Muller, et al., 2008), increased risk for depression in psychotic individuals (Contreras, et al., 2009), increased negative affect after acute tryptophan depletion
(Brummett, Muller, et al., 2008; Firk & Markus, 2009), decreased hippocampal volume in depressed individuals (Frodl, et al., 2008), increased production of cortisol in response to stress in females (Gotlib, Joormann, Minor, & Hallmayer, 2008), amygdala activation (for a meta-analysis see Munafo, Brown, & Hariri, 2008) particularly in response to fearful stimuli (Hariri, et al., 2002; Lau, et al., 2009), cognitive processing of fearful stimuli (Osinsky, et al., 2009), and suicidal behavior (Neves, et al., 2008).
Importantly, there is some evidence that there are additional HTTLPR alleles with varying degrees of functionality that may have confounded the results of previous studies (Nakamura, Ueno, Sano, & Tanabe, 2000). Hu et al. (2006) recently reported that among individuals of European descent the HTTLPR is functionally triallelic: There is a single nucleotide polymorphism (SNP) within the long allele, resulting in two different forms of that allele. One form of the long allele (LA) does behave in the manner that geneticists had previously ascribed to the long allele. The other, LG, has a SNP from adenosine (A) to guanine (G) within the allele, and is associated with lower rates of transcriptional activity, as is the S allele. Therefore, the HTTLPR has two low-activity alleles (S and LG) and one high-activity allele (LA). Some have suggested that the pattern of equivocal results seen in the literature for the HTTLPR is due to what have essentially been comparisons of low activity to a group that combines both low and high activity, rather than a clean comparison of low to high (Gunthert, et al., 2007; Kato, 2007). To date, no studies to this author’s knowledge have compared biallelic and triallelic approaches to inform a data-based comparison of the extent to which the triallelic approach may improve classification and identification of risk.
Although there has been considerable investigation involving the serotonin transporter in adult bipolar disorder, there are no studies to this author’s knowledge that examine the HTTLPR short allele or low-activity alleles in the etiology of the early-onset form of bipolar disorder. Two studies have examined the association of the HTTLPR with EOBD diagnosis (Geller & Cook, 1999; Mick & Faraone, 2009); both found that the S allele was not associated with the diagnosis in parent-child trios. However, understanding
Importantly, S allele genotype has been associated with younger age of onset of bipolar disorder (Bellivier, et al., 2002; Ospina-Duque, et al., 2000; Smeraldi, Benedetti, & Zanardi, 2002), underscoring the need to investigate this polymorphism in youth.
Additionally, recent research exploring cortisol stress response by HTTLPR genotype in multiple age cohorts provides strong evidence for a sensitive period in young childhood during which the experience of an endocrine stress response in those with risk genotypes may be particularly pathogenic (Mueller, et al., 2011). An interaction between HTTLPR genotype and stressful life events significantly predicted a larger cortisol response only in younger adults (18-31 years) and only when the stressful life events had occurred during the first five years of life. Interestingly, this interaction was not significant in 8-12 year olds, suggesting that the expression of the stressful life events came to full fruition later in development, perhaps during another sensitive period. Notably, while the experience of early life stress has not been defined as a specific factor in the etiology of EOBD, it has been implicated in an overall gestalt that places genetically and biologically vulnerable individuals further at risk (Miklowitz & Chang, 2008).
To date, the role of the S/low activity alleles in EOBD remains unclear. It may be that S allele genotype is a vulnerability marker for EOBD, or that youth are more affected by the serotonin transporter underactivity associated with the S allele, or that youth are especially vulnerable to GxE involving the S allele. Importantly, in an eight-year follow-up study of youth with bipolar disorder, younger age at study entry predicted more weeks ill,
associated with younger age of onset of bipolar disorder (e.g., Bellivier, et al., 2002), it appears crucial that these relationships be further elucicated.
GxE Involving the HTTLPR Are Significant Mechanisms in the Etiology of Mood Disorders
Despite the identification of GxE as essential for understanding the etiology of mood disorders (Cho, et al., 2005), there is a scarcity of empirical literature in this area. The
following is a review of GxE studies with the HTTLPR in mood disorders, the large majority of which focuses on depression. Although these results may be somewhat generalizable to bipolar disorder, it is likely that risk factors differ (Alloy, Abramson, Walshaw, & Neeren, 2006; Johnson, 2005; Wals & Verhulst, 2005). Therefore, it is imperative that GxE be more closely examined in bipolar disorder.
In 2003, in a landmark study published in Science, Caspi and colleagues (2003) became the first to suggest that interactions between the HTTLPR and stressful life events are related to the development of depressive symptoms. In a sample of 847 young adults who had been followed since birth, they demonstrated prospectively that stressful life events occurring between ages 21 and 26 had a greater effect on self-reported symptoms of depression in those carrying an S allele versus those homozygous for the L allele.
Furthermore, stressful life events predicted the development of Major Depressive Disorder (MDD) by age 26 in S carriers, but not in LL homozygotes.
of 1.85 for risk for depression in this group. Furthermore, the effect of the S allele was additive, such that the risk was higher for those with SS genotype versus SL genotype. It is important to note, however, that a recent study failed to find the hypothesized GxE in a large longitudinal birth cohort (Araya, et al., 2008).
Particularly relevant to the current study is the work of Hammen and colleagues (2009), who prospectively demonstrated GxE occurring in females, with chronic family stress at age 15 predicting depressive symptoms at age 20 in women who carried at least one S allele of the HTTLPR. Additionally, Taylor and colleagues (2006) reported that in a young adult non-clinical sample, individuals who were both homozygous for the HTTLPR S allele and who had experienced early family stress demonstrated significantly higher levels of depressive symptomatology than those who did not experience early adversity or who were of the SL or LL genotype. Similarly, Sjoberg and colleagues (2006) found that among females only, those who had the SS genotype and had been exposed to traumatic conflict within the family had higher levels of depression. Finally, Laucht and colleagues (2009) found family adversity and life stressors to be associated with depression in 19-year-olds. However, moderation was seen in the LL genotype only: These individuals had higher levels of depressive symptomatology as well as greater numbers of depressive and anxiety
diagnoses than individuals of other genotypes. It is unclear why this study resulted in findings contrary to the rest of the literature. However, other studies done in adults
examining life stress via questionnaire have found opposite results as well (Chorbov, et al., 2007; Surtees, et al., 2006; Zhang, et al., 2009).
(2009), including noted epidemiologist Kathleen Merikangas, published a meta-analysis of a restricted subset of the replications published to date and found no effect of the HTTLPR in depression GxEs. This meta-analysis was highly publicized in the popular press and was quickly followed by a similar publication by Munafo and colleagues (2009). In 2011, Karg and colleagues (2011) published a third meta-analysis that included all replications to date with no restrictions, utilizing a different meta-analytic technique. They found a strong overall effect for increased risk of developing depression under stress in S allele carriers, and
stratified the analyses by individual type of stressor as well. There were strong effects for childhood maltreatment and medical stressors and a marginal effect for stressful life events. They did not find an effect for the subsets of papers included in the Risch (2009) meta-analysis or the Munafo (2009) meta-meta-analysis, suggesting that the latter results were due to restriction of studies rather than meta-analytic techniques used. Overall, it appears that when a broad spectrum of phenotypes and life stressors are included, there is a strong role of the HTTLPR in moderating the effect of various life stress experiences on depression-related outcomes.
did find an effect for chronic, ongoing family stress. The prospective design of this study as well as the fairly large sample size (N=346) lend credibility to the findings.
Additionally, studies done in youths have consistently yielded replications, while there is more variability among replication studies with middle aged and elderly samples (Uher & McGuffin, 2008). As previously noted, there may be something about experiencing family stress during childhood or adolescence that results in a more potent effect than if the family conflict were experienced later in life (Mueller, et al., 2011). One might also speculate that the changing roles of an individual within a family across the lifespan could be related (e.g., transitioning from being a subordinate member of the family to having more power within the family dynamic; c.f. Chipman, et al., 2007).
of any kind while focusing specifically on youth with bipolar disorder. As a field, we are very much in need of studies that can help elucidate the role of GxE in models of risk for childhood mood disorders, particularly bipolar disorder.
The Importance of Mechanisms
Leading researchers in the field of GxE research now suggest that while further research into GxE is necessary, the prevailing need is no longer to identify that GxE occur (Caspi, 2009). This has been well-established and researched from a number of angles within developmental psychopathology (Caspi, et al., 2005; Kim-Cohen, et al., 2006; Mill, et al., 2006). What is needed is an understanding of the mechanisms underlying GxE (Hariri, 2009; Rutter, 2009), particularly mechanisms that “make sense” given the gene of interest. Some work of this nature has already begun in childhood affective disorders (Mechelli, et al., 2009).
The mechanism behind vulnerability to depressive and manic symptoms in HTTLPR low-activity allele carriers may be increased amygdala response to emotional stimuli, leading to biased attention when confronted with such stimuli. This constellation of responses to emotional stimuli present in the environment that is driven by the amygdala could confer a greater sensitivity to critical and hostile family environments (i.e., EE) in youth with certain genotypes. For example, if a child or adolescent with an HTTLPR low-activity allele
experiences hostility and criticism at home, he or she may attend more to those negative events than the average person (biased attention), causing him or her to have persistent, intrusive thoughts such as “Why is Mom always yelling at me?” or “Why is it always so terrible around here?” or “What did I do to make Dad mad?” It follows that depressive symptoms could result. Additionally, negative events can precipitate mania/hypomania (Alloy, et al., 2005). However, it is important to note that a study done on EE in bipolar disorder failed to find significant differences in affective reactivity to criticism, although there was a trend for participants with bipolar disorder to react more negatively to criticism than controls (Cuellar, Johnson, & Ruggero, 2009).
Significantly, the S allele of the HTTLPR has been tied to sensitivity to punishment-related (versus reward-punishment-related) processing (Blair, et al., 2008), suggesting a potential mechanism for feeding biased attention towards negative emotional stimuli. Low-allele genotype has been tied to increased limbic system reactivity in response to affectively
who in turn showed a more prominent effect than those with zero low-activity alleles). In seven-year-old children who had experienced a negative mood prime, only those
homozygous for the S allele displayed biased memory for negative adjectives after being presented with negative and positive self-referent adjectives (Hayden, et al., 2008). Similarly, children with at least one S allele showed greater depressogenic attributional styles, tending to attribute negative events to internal, stable, and global factors, even though level of depression did not vary by genotype (Sheikh, et al., 2008). A recent meta-analysis across all age groups shows a significant association of medium effect size between homozygous low-activity genotypes of the HTTLPR and selective attention for negative information
(Pergamin-Hight, Bakermans-Kranenburg, van Ijzendoorn, & Bar-Haim, 2012). It follows that punishment-related processing, negative cognitive biases, and
vigilance towards anger would be highly maladaptive in a high-conflict environment such as a high-EE or high-discord family, and that the effects of these maladaptive cognitive biases could increase as the number of low-activity alleles the person carried increased. However, one study revealed an attentional bias for anxious word stimuli, but not dysphoric word stimuli, in S carriers (Beevers, Gibb, McGeary, & Miller, 2007).
Children with certain HTTLPR genotypes have also demonstrated a lack of a protective effect, rather than the presence of a detrimental effect of biased attention.
Finally, biased attention may not be limited to EE and negative aspects of the
environment; adolescents may also attend more strongly to positive events in their lives and environments than negative ones and may “dwell” on these events, predisposing them to symptoms of hypomania or mania. Beevers and colleagues (2009) found that individuals with low-activity alleles of the HTTLPR (i.e., S and LG alleles) had difficulty disengaging their attention not only from negatively-valenced emotional stimuli such as sad and fearful faces, but also from positive stimuli such as happy faces.
Although there appears to be good evidence for a link between HTTLPR genotype and biased attention for emotional stimuli, there has been less work done in this area in bipolar disorder (for a full review, see Johnson, Gruber, & Eisner, 2007). Most work that has been done is related more to reactivity to emotional stimuli than cognitive or memory biases, although one study found biased attention towards positive or negative (versus neutral) words (Elliott, et al., 2004). Nonreferred participants at increased risk for mania have shown
elevated levels (versus low-risk participants) of positive emotion in response to not only positive but also negative and neutral film clips; they also showed increased irritability in response to the film clips (Gruber, Johnson, Oveis, & Keltner, 2008). Children and adults with bipolar disorder have shown increased cortical activity in response to emotional stimuli (Chang, et al., 2004; Kruger, Seminowicz, Goldapple, Kennedy, & Mayberg, 2003).
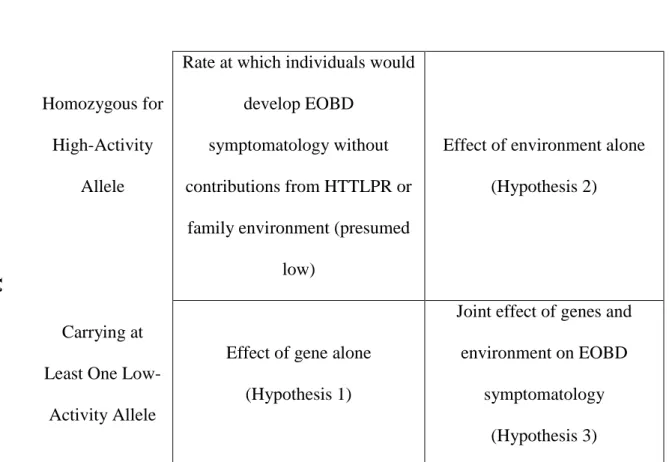
Hypotheses
Hypothesis 1. HTTLPR non-LA-homozygote genotype will predict increased EOBD
symptomatology as measured by the General Behavior Inventory (GBI; Depue, et al., 1981). The GBI has two subscales: Depression and Hypomanic/Biphasic. Outcomes will be tested using both. Additionally, exploratory sub-analyses will probe for a linear effect of low-activity allele status, i.e., does level of EOBD symptomatology increase in a linear fashion based upon genotype (LALA < one LG or S allele < two LG or S alleles)?
I predict increased EOBD symptomatology in low-activity allele carriers because meta-analyses suggest there is a main effect of the HTTLPR in bipolar disorder (Cho, et al., 2005; Furlong, et al., 1998; Lasky-Su, et al., 2005). Additionally, in the previous literature, consideration of heterozygotes vs. homozyotes for the S/low activity allele has not been consistent (Uher & McGuffin, 2008); exploratory sub-analyses will contribute to our
understanding of whether simply carrying a low-activity allele is sufficient to increase one’s risk (e.g., Caspi, et al., 2003; Eley, Liang, et al., 2004), or whether two low-activity alleles (i.e., homozygosity) are necessary to confer risk (e.g., Kaufman, et al., 2004; Sjoberg, et al., 2006; Taylor, et al., 2006).
Hypothesis 2. Self-reported level of EE during childhood and adolescence will
predict increased EOBD symptomatology. Support for this hypothesis comes from decades of research showing that increased family discord and EE are associated with increased symptomatology (Asarnow, et al., 1993; Kim & Miklowitz, 2004; Townsend, et al., 2007) and rate of relapse (Miklowitz, et al., 1988; Rosenfarb, et al., 2001) in individuals with bipolar disorder.
Hypothesis 3. The presence of a pathogenic environment (high EE) will show
(e.g., high activity allele * low EE < low activity allele * high EE), and this interaction will provide a significant increment in prediction of EOBD symptomatology over genes alone or environment alone. Additionally, exploratory sub-analyses will probe for sex effects as well as a linear effect of low-activity allele status, i.e., does the effect of the gene-environment interaction vary depending upon whether individuals have one or two copies of a low-activity allele (Uher & McGuffin, 2008)?
I predict a GxE involving a conflictual family environment and HTTLPR low-activity alleles on the basis of multiple prior studies showing similar effects (Hammen, et al., 2009; Laucht, et al., 2009; Sjoberg, et al., 2006; Taylor, et al., 2006). Additionally, I plan to probe for sex effects because past research has found the hypothesized interaction in females only (Brummett, Boyle, et al., 2008; Eley, Liang, et al., 2004; Sjoberg, et al., 2006), suggesting that sex may be an important factor in this GxE equation. Finally, I will again test for
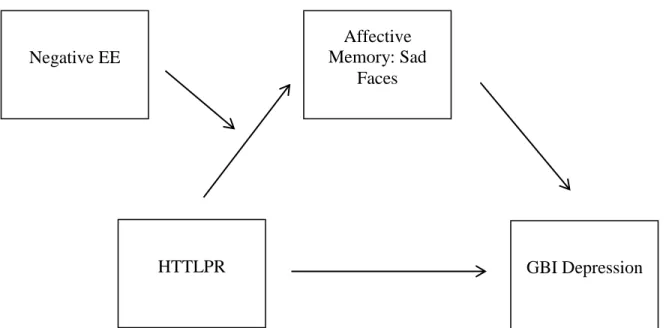
incremental effects of the low-activity alleles (see Hypothesis 1) within the GxE framework. Hypothesis 4. A measure of biased attention to emotional stimuli will significantly
partially mediate the EE * HTTLPR genotype interaction with EOBD symptomatology as the dependent variable. I anticipate partial mediation, rather than full, because within a system this complex it is unlikely that biased attention to emotional stimuli would fully account for the relationship between the GxE and either depressive or manic symptomatology.
In keeping with recent recommendations by experts in GxE (Caspi, 2009; Rutter, 2008), I will explore biased attention to emotional stimuli as a mediator of the family environment-HTTLPR interaction. Prior work has demonstrated that both carriers of S/low activity
Pavuluri, West, Hill, Jindal, & Sweeney, 2009); show biased attention, subjectively increased affective response, and/or related neural correlates when confronted with happy, sad, or angry stimuli (e.g., words, faces). I propose that in a hostile and critical family environment, individuals who are predisposed to orient towards and have difficulty disengaging from emotional stimuli will be at risk for increased mood disorder symptomatology.
Methods
Participants
Recruitment and demographics. Participants were recruited through the UNC
Chapel Hill participant pool. Participants were 101 undergraduate students enrolled in an introductory psychology course at UNC. Students received research credit for their participation, consistent with the established guidelines and procedures for the participant pool. Although the prevalence of the HTTLPR S allele varies by ancestry (Esau, Kaur, Adonis, & Arieff, 2008), all participants will be included in the analyses.
Bipolar status of participants. A substantial portion of individuals with bipolar
disorder will experience the onset of their illness between ages 18 and 21 (i.e., college age). In the National Comorbidity Study – Revised, the lifetime prevalence of age of onset of 17 or later for Bipolar I and Bipolar II subjects was 75% (Kessler, et al., 2005). Particularly salient is the stress associated with a transition to college during the age of risk; many individuals will get to college before their mood problems escalate and will experience exacerbation of the underlying illness as stressors increase: Up to three times as many individuals with bipolar disorder start college as finish college (Kessler, et al., 2006). Prior research suggests that significant degrees of bipolar disorder symptomatology are found within undergraduate populations (Alloy, et al., 2008; Knowles, Tai, Christensen, & Bentall, 2005) and that between 6% and 12% of undergraduates participating in psychological research would meet criteria for a bipolar spectrum disorder if given a diagnostic interview (Grandin, Alloy, & Abramson, 2007). In fact, the median age of onset of bipolar disorder is 18 (Berk, et al., 2007), which is also the modal age of an individual in the participant pool. More support comes from recent epidemiological analyses which suggest that bipolar disorder has a prevalence of 5.5%-6.2% in adolescents and young adults (age 18-24; Cicero, et al., 2009). Although diagnostic interviews were not performed, it was reasonable to assume that a substantial proportion of the sample would be experiencing significant mood
symptomatology during the study. Materials and Measures
Demographics and family history. Demographics were collected, including
marital status (and if no longer together, age of participant when breakup, separation, or divorce occurred); and self-reported psychiatric illness status. Participants also provided information about family history of psychiatric illness using a brief, one page grid (Youngstrom, et al., 2009).
General Behavior Inventory (GBI). Participants filled out a General Behavior
Inventory (GBI; Depue, et al., 1981), a research instrument that has demonstrated reliability and validity for assessing bipolar disorder symptomatology in youth (Danielson,
Youngstrom, Findling, & Calabrese, 2003; Findling, et al., 2002; Youngstrom, Findling, Danielson, & Calabrese, 2001). The GBI was chosen because it was developed specifically to identify subsyndromal cases of mood disorder (Depue, et al., 1981) and because it has been validated extensively (Depue, et al., 1981; Klein, Depue, & Slater, 1985) and in college populations (Alloy, et al., 2008; Depue, Krauss, Spoont, & Arbisi, 1989). The GBI has adequate sensitivity (.78) and high specificity (.99; Depue, et al., 1989). The GBI can either be used as a total composite score, or as two subscales: Depression and Hypomanic/Biphasic. Internal consistency when used with a non-clinical sample ranges from .90 to .96 for the total score and two subscales, with higher alphas corresponding to the total GBI score (Depue, et al., 1989; Depue, et al., 1981).
Perceived Criticism Scale (PCS). To obtain a measure of EE, participants filled out
(Hooley & Teasdale, 1989). For the PCS and other family assessment measures, the participant was directed to think back on family dynamics from age eight to present. This time period was chosen because encompasses both middle childhood, of which participants were likely to have memories, as well as adolescence, a common period of family discord.
In order to obtain a measure of positive family functioning, I created several items modeled after the Perceived Criticism Scale. Questions such as “How supportive was your caregiver of you?” and “When your caregiver expressed their love for you, how loved did you feel?” were rated on a scale from 1 (not at all supported/loved) to 10 (very
supported/loved). I chose to create my own items because I wanted to have an analogue to the PCS to use in models testing positive and negative family environment simultaneously. This is consistent with the work of Jay Belsky, who writes of “differential susceptibility to the environment” (Belsky & Pluess, 2009). He argues that so-called “risk” genes are actually sensitivity genes, and that we happen to only look at negative environments most of the time. In this sample, the EE Positive items showed an internal consistency coefficient of .91.
Family Assessment Device (FAD) and Family Environment Scale (FES). To
assess overall family functioning, participants completed the Problem Solving, Communication, and General Functioning subscales of the FAD (range of internal
consistencies of subscales = .71-.92; Epstein, Baldwin, & Bishop, 1983). They also filled out the Cohesion, Conflict, and Expressiveness subscales of the FES (range of internal
Calabrese, & Findling, 2008). For all family environment measures in this study, high scores indicate impaired family functioning.
Faces task. In order to understand mediation effects of biased attention to emotional
stimuli, participants were asked to complete a memory task involving faces with affectively positive, negative, and neutral expressions. The task was modeled on the “Faces” subtest of the Children’s Memory Scale (Cohen, 1997), but was modified for length and used different faces. The faces are from the NimStim face stimulus set, a set of reliable and valid
multiracial stimuli depicting a range of emotional expressions (Tottenham, et al., 2009). The set includes photos of Asian-American, African-American, European-American, and Latino-American individuals photographed under identical conditions. The NimStim set was chosen because it has been used successfully in prior GxE research with the HTTLPR (Pérez-Edgar, et al., 2009), and because the faces have been validated in a population of untrained
individuals who were chosen in order to approximate average research participants
(Tottenham, et al., 2009). In the latter study, Cohen’s kappas for concordance between the participant’s response and the intended facial expression ranged from .64 to .97, with the majority of kappas in the .8 to .9 range; test-retest reliability ranged from .77 to .94 (Tottenham, et al., 2009). These values suggest good reliability and validity.
well as neutral distracter faces – and were asked to identify which of the faces they had seen before. Number of correctly recalled faces was recorded, along with the type of each face correctly recalled (e.g., happy, angry, neutral).
DNA collection and HTTLPR sequencing. Participants were required to provide
genetic material via saliva sample. The specimens were collected using Oragene, a saliva sample collection method popular for its painlessness, simplicity, and ease of use. Oragene also captures greater quantities of DNA and has a low bacteria content compared with other oral collection methods such as cheek swab or mouthwash (Genotek, 2010). Oragene provides high-quality DNA (Rylander-Rudqvist, Hakansson, Tybring, & Wolk, 2006) and has been used previously at UNC to collect DNA from over 2,000 undergraduates (Guo & Tillman, 2009). The samples were sent to the UNC Biospecimen Processing Facility for DNA extraction under the supervision of Patricia Basta, PhD. HTTLPR genotyping was done at Duke University through the laboratory of Ahmad Hariri, PhD. Please see Appendix for sequencing details. BDNF, COMT, and DRD2 genotyping was done at the UNC Mammalian Genotyping Core under the supervision of Jason Luo, PhD.
Procedures
physical and dependency abuse for adults and youth. These are extremely confidential studies that have passed the highest level of scrutiny from human subjects committees.
Participants then provided the DNA sample via saliva collection. Participants were then debriefed and provided with contact and psychoeducational information.
Analyses
Descriptive Statistics
Data were aggregated in Predictive Analytics Software (PASW) Version 18.0 (also known as Statistical Package for the Social Sciences). Descriptive statistics quantified age, sex, race/ethnicity, ancestry, HTTLPR genotype, and level of family functioning as measured by the PCS, positive EE items, FES, and FAD. Descriptive statistics also quantified mean number of happy, sad, angry, and neutral faces recalled on the faces task, as well as percentage of participants remembering significantly more positive or negative faces than neutral faces. Analysis of variance determined whether recall of affectively laden faces differed by genotype or by family functioning status.
Missing Data Analyses
Missing data were scarce overall, likely due to the online data collection format. Among items making up the independent variables, missing data ranged from 0% to 2%. Among items making up the dependent variables, missing data ranged from 0% to 2%. Among the affective memory task (faces) items, missing data ranged from 0% to 2%. Two participants are missing data in the latter half of the protocol because the program
Unfortunately, four participants did have to be excluded from the study entirely due to a research assistant making a labeling error on their DNA samples during two consecutive data collection sessions such that the samples could not be connected with the questionnaires. All of these participants carried at least one risk gene and two had both copies of the gene. Regression
Differences by race/ethnicity were assessed and covaried in all models. I assessed for main effects and interactions using multiple linear regression. EE (as measured by the PCS and positive EE items), HTTLPR genotype (number of low-activity alleles), and their interaction were independent variables; level of bipolar disorder symptomatology as measured by a GBI subscale was the dependent variable. Regression diagnostics (Cook’s distance, Mahalanobis distance, Student’s deleted residual) were run with each regression model in order to assess for influential outliers.
Family environment variables were mean-centered, and an interaction term was created using the EE, FAD, or FES variable and dummy-coded variables for three levels of HTTLPR genotype: Zero, one, or two copies of a low activity allele. Covariates entered into the regression models first, followed by main effects, and then the interaction term. Using the procedures recommended by Preacher, Curran, and Bauer (2006), I probed interactions using an online tool available at www.quantpsy.org.
Alpha
secondary to multiple comparisons, I used an alpha of .01 for the main analyses and an alpha of .005 for the exploratory analyses. This yielded a probability of at least one Type I error of 7.7% for the main analyses (8 models at .01) and 7.0% for the exploratory analyses (12 models at .005). Since many of the analyses conducted in this paper are novel, I wanted to optimize the tradeoff between Type I and Type II error and avoid being too conservative, while preserving scientific rigor.
Moderated Mediation
I tested for moderated mediation, or “conditional indirect effects,” which occur when the strength of a mediation effect varies depending upon the level of some other variable (Preacher, Rucker, & Hayes, 2007). Biased attention to emotional stimuli during the faces task was included in the model as a mediator of the interaction between genotype and family functioning. Using procedures recommended by Preacher and colleagues (2007), I tested the moderated mediation using an SPSS macro developed by the authors (available at
http://www.afhayes.com/). Power
from a t-value for a similar interaction between the HTTLPR and early family stress measured in a college sample (Taylor, et al., 2006); this yielded an R2 of .22, indicating a large effect. Because Taylor and colleagues (2006) used a different family stress construct in their study, I chose to use a more conservative estimate of a medium effect (R2 = .10).
Although initial power analyses were calculated for an N of 500 (power approaching 1.0 for the total model), funding constraints only allowed for recruitment of 101 participants providing DNA (four of whom were mislabeled and had to be excluded; details below). Posthoc power analyses indicated that I had 75-80% power to detect EE main effects, between 5% power (for positive EE) and 30% power (for negative EE) to detect GxE involving EE, and less than 10% power to detect the direct effect of HTTLPR.
Results
Demographics & Descriptive Statistics
Participants took an average of 27.45 minutes to complete the protocol (SD = 6.31, range = 16 to 45 minutes). Only 1% of participants came from a family where the annual family income was less than $20,000. Eighty percent of participants came from a family where the annual family income was at least $60,000. Ninety-two percent of participants came from a family where the highest level of education was an associate’s degree or
beyond. Ninety-seven percent of participants were raised by a biological parent. Ninety-four percent of participants were raised by a primary caregiver who was married when the
participant was ages 8 through 18.
abuse, 6% a history of sexual abuse, and none reported neglect. Please see Table 1 for description of extended family history of mental health problems.
Genotyping. The genotyping lab was not able to determine the genotype for two
samples, resulting in a 98% “call rate” or success rate, which is very good. There were 198 total alleles in the sample. Ninety were the LA allele (.45 allele frequency), 88 were the traditional S allele (.44 allele frequency), and 20 were the LG allele (.10 allele frequency). One individual was homozygous for the rare SG allele, the function of which is currently undocumented but is best understood to cluster with the other low-activity alleles (S, LG). I tested for Hardy-Weinberg equilibrium (probability of random mating in the population; Hardy, 1908; Weinberg, 1908) by adding the products of the frequencies of the alleles in their various combinations (homozygous, heterozygous, etc). The equation demonstrated that the genotypic distribution was indeed in Hardy-Weinberg equilibrium, suggesting that it is appropriate to continue analysis.
Twenty-five percent of participants did not carry a risk gene of the HTTLPR polymorphism, i.e., they carried two copies of the high-activity allele. Forty-two percent carried one low-activity allele, while 33 percent carried two copies of a low-activity allele. This is slightly higher than typical rates for European populations, but lower than typical rates for Asian populations, which is consistent with the mixed ethnic makeup of the sample. See Table 2 for genotype frequencies in this sample as well as a comparison to worldwide genotypic distribution rates. Worldwide rates are based on biallelic LL/LS/SS models and not tri-allelic models, but provide a rough basis for comparison.
Questionnaire results. Participants scored an average of 18% of the maximum
also scored an average of 18% of the maximum possible on the GBI Hypomanic/Biphasic scale (min = 1%, max = 73%, median = 14%). Please see Table 3 for a summary of percent of maximum possible (POMP) scores for mood and family environment questionnaires.
Participants scored an average of 52% of the maximum possible on the Negative Expressed Emotion scale (min = 10%, max = 95%, median = 55%). Participants scored an average of 90% of the maximum possible on the Positive Expressed Emotion scale (min = 20%, max = 100%, median = 98%).
Participants scored an average of 36% of the maximum possible on the FAD Problem Solving scale (min = 0%, max = 94%, median = 33%). Participants scored an average of 37% of the maximum possible on the FAD Communication scale (min = 0%, max = 89%, median = 33%). Participants scored an average of 28% of the maximum possible on the FAD
General Functioning scale (min = 0%, max = 100%, median = 25%). Participants scored an average of 33% of the maximum possible on the FAD Total scale (min = 0%, max = 90%, median = 31%).
Participants scored an average of 25% of the maximum possible on the FES Cohesion scale (min = 0%, max = 89%, median = 22%). Participants scored an average of 41% of the maximum possible on the FES Expressiveness scale (min = 0%, max = 89%, median = 44%). Participants scored an average of 37% of the maximum possible on the FES Conflict scale (min = 0%, max = 89%, median = 33%). Participants scored an average of 34% of the maximum possible on the FES Total scale (min = 11%, max = 81%, median = 30%).
Participants showed variable rates of success with the affective memory task. (See Table 4 for a complete listing of descriptive statistics by type of face.) Participants
mean recall). ANOVA showed no significant differences between or within HTTLPR groups for memory for faces. A programming glitch resulted in the purpose of the distraction
condition becoming revealed to participants, who correctly identified on average 80% of distractor faces.
Family Environment, HTTLPR, and Gene-Environment Interaction: Regressions
Covariates. Gender did not predict outcomes for any regression model, but it
remained a covariate in every model. Race was not a significant predictor in any model; however, dummy codes for race were included as covariates in every model. Participant-reported history of parental depression or mania/bipolar disorder was also included in every model, and was predictive in some models.
Influential outliers. There was a group of seven influential outliers who repeatedly
different from the overall sample on FAD or FES Total scores, and they were representative of the sample on demographic characteristics.
It is likely that these individuals represent my target population, and that within a larger sample, they would simply denote extremes of a gradient of mood and family
functioning with additional individuals along the continuum at middle points as well. In order to increase the generalizability of the results, and in order to completely represent the
spectrum of mood disorder symptoms and family environment function and dysfunction reported in the sample, I decided to include these seven individuals in all regression models.
Expressed emotion questionnaire.
Negative EE and Depressive Symptoms. Participants’ self-reported parental history
of depression problems significantly predicted GBI depression score, t = 2. 15, B = 13.22, p = .01. After controlling for parental depression and positive EE, higher scores on the negative EE measure significantly predicted increases in GBI depression scores, t = 2.43, B = 0.61, p = .02, R2 = .05 (p = .02). However, after posthoc correction, this was no longer significant. Genotype alone did not predict depression scores. There was no significant
gene-environment interaction, and adding GxE to the model did not produce a significant change in R2.
Please see Table 5 for regression coefficients for all models.
Positive EE and Depressive Symptoms. After controlling for parental depression and negative EE, higher scores on the positive EE measure significantly predicted decreases in GBI depression scores, t = -2.63, B = -0.94, p = .01, R2 = .06 (p = .01). Genotype alone did not predict depression scores. There was no significant gene-environment interaction, and adding GxE to the model did not produce a significant change in R2.
Positive EE and Hypomanic/Biphasic Symptoms. After controlling for parental history and negative EE, higher scores on the positive EE measure significantly predicted decreases in GBI Hypomanic/Biphasic score, t = -2.37, B = -0.55, p = .02, R2 = .05 (p = .02). However, after posthoc correction, this was no longer significant. Genotype alone did not predict hypomanic/biphasic scores. There was no significant gene-environment
interaction, and adding GxE to the model did not produce a significant change in R2. Family Assessment Device
FAD Problem Solving and Depressive Symptoms. After controlling for parental mental health history and the other FAD subscales, FAD Problem Solving did not
significantly predict lower GBI Depression scores, t = -1.73, B = -34.97, p = .09. Genotype alone did not predict depression scores. There was no significant gene-environment
interaction, and adding GxE to the model did not produce a significant change in R2.
FAD Problem Solving and Hypomanic/Biphasic Symptoms. After accounting for control variables, FAD Problem Solving did not have a significant effect on GBI
Hypomanic/Biphasic scores, t = -1.53, B = -19.87, p = .13. Genotype alone did not predict hypomanic/biphasic scores. There was no significant gene-environment interaction, and adding GxE to the model did not produce a significant change in R2.
variables, FAD Communication did not have a significant effect on GBI Depression scores, t = -1.26, B = -16.08, p = .21. Genotype alone did not predict depression scores. There was no significant gene-environment interaction, and adding GxE to the model did not produce a significant change in R2.
FAD Communication and Hypomanic/Biphasic Symptoms. After entering control variables, FAD Communication significantly predicted decreases in GBI
Hypomanic/Biphasic scores, t = -2.01, B = -25.51, p = .05, R2 = .04 (p = .05). However, after posthoc correction, this was no longer significant. Genotype alone did not predict
hypomanic/biphasic scores. There was a marginally significant gene-environment interaction, t = 1.83, B = 15.85, p = .07, R2 = .03 (p = .07). Upon probing, it appeared that the slopes were indeed different but not at a magnitude that would be clinically meaningful, suggestive of potentially spurious findings. Posthoc power analyses indicated that there was
approximately 51% power to detect an interaction for this model. If the effect I found is accurate, a future study would need a sample size of 193 to have 80% power to detect a similar effect.
FAD General Functioning and Depressive Symptoms. After entry of the control variables, FAD General Functioning significantly predicted increases in GBI Depression scores, t = 3.52, B = 78.51, p = .001, R2 = .10 (p = .001). Genotype alone did not predict depression scores. There was no significant gene-environment interaction, and adding GxE to the model did not produce a significant change in R2.
FAD General Functioning and Hypomanic/Biphasic Symptoms. After entry of the control variables, FAD General Functioning significantly predicted increases in GBI
alone did not predict hypomanic/biphasic scores. There was no significant gene-environment interaction, and adding GxE to the model did not produce a significant change in R2.
FAD Total and Depressive Symptoms. After accounting for control variables, FAD Total significantly predicted increases in GBI Depression scores, t = 4.61, B = 51.94, p <.001, R2 = .18 (p <.001). Genotype alone did not predict depression scores. There was no significant gene-environment interaction, and adding GxE to the model did not produce a significant change in R2.
FAD Total and Hypomanic/Biphasic Symptoms. After accounting for control variables, FAD Total significantly predicted increases in GBI Hypomanic/Biphasic scores, t = 2.95, B = 22.07, p = .004, R2 = .09 (p = .004). Genotype alone did not predict
hypomanic/biphasic scores. There was no significant gene-environment interaction, and adding GxE to the model did not produce a significant change in R2.
Family Environment Scale
FES Cohesion and Depressive Symptoms. After entering the parental mental health history and the other FES subscales, FES Cohesion did not have a significant effect on GBI Depression scores, t = -0.61, B = -7.50, p = .54. Genotype alone did not predict depression scores. There was no significant gene-environment interaction, and adding GxE to the model did not produce a significant change in R2.
FES Conflict and Depressive Symptoms. After entry of control variables, FES Conflict significantly predicted increases in GBI Depression scores, t = 3.85, B = 34.59, p <.001, R2 = .11 (p < .001). Genotype alone did not predict depression scores. There was no significant gene-environment interaction, and adding GxE to the model did not produce a significant change in R2.
FES Conflict and Hypomanic/Biphasic Symptoms. After entry of control variables, FES Conflict significantly predicted increases in GBI Hypomanic/Biphasic scores, t = 2.66, B = 15.54, p = <.001, R2 = .06 (p <.001). Genotype alone did not predict
hypomanic/biphasic scores. There was no significant gene-environment interaction, and adding GxE to the model did not produce a significant change in R2.
FES Expressiveness and Depressive Symptoms. After accounting for control
variables, FES Expressiveness significantly predicted increases in GBI Depression scores, t = 2.35, B = 23.13, p = .02, R2 = .04 (p = .02). However, after posthoc correction, this was no longer significant. Genotype alone did not predict depression scores. There was no
significant gene-environment interaction, and adding GxE to the model did not produce a significant change in R2.
FES Expressiveness and Hypomanic/Biphasic Symptoms. After entry of control variables, FES Expressiveness did not significantly predict increases in GBI
Hypomanic/Biphasic scores, t = 1.79, B = 11.51, p = .08. Genotype alone did not predict depression scores. There was no significant gene-environment interaction, and adding GxE to the model did not produce a significant change in R2.
= .24 (p < .001). Genotype alone did not predict depression scores. There was no significant gene-environment interaction, and adding GxE to the model did not produce a significant change in R2.
FES Total and Hypomanic/Biphasic Symptoms. After accounting for control
variables, FES Total significantly predicted increases in GBI Hypomanic/Biphasic scores, t = 5.09, B = 34.60, p < .001, R2 = .22 (p < .001). Genotype alone did not predict
hypomanic/biphasic scores. There was no significant gene-environment interaction, and adding GxE to the model did not produce a significant change in R2.
Moderated Mediation Models
Results for EE, both positive and negative, suggested that there was no moderated mediation present. That is, pathways from HTTLPR through the affective memory task (biased attention to happy, sad, or angry faces) were not moderated by expressed emotion. Please see Figure 2 for an example of a moderated mediation model tested. Additional exploratory models using the FES and FAD Total scores in place of EE as the family environment variable also did not show significant moderated medication.
Notably, biased attention to sad faces significantly predicted GBI Depression scores in all models, p’s = .002 to .03, as well as GBI Hypomanic/Biphasic score in the FES Total model (p = .04). No other faces demonstrated significant prediction value.
Discussion
Bipolar disorder is lifelong diagnosis associated with significant psychosocial impairment (Birmaher & Axelson, 2006; Geller, Bolhofner, et al., 2000; Goldstein, et al., 2005). Onset often occurs in childhood or adolescence (Kessler, et al., 2005), and may be associated with the experience of acute or chronic life stressors (Grandin, et al., 2007). Experts agree that both genetic and environmental risk factors contribute to the development and maintenance of bipolar disorder (Miklowitz & Chang, 2008) and other
psychopathologies, and that it is unlikely that these work in isolation (Moffitt, et al., 2006; Neiderhiser, 2001).
serotonin transporter promoter polymorphism (HTTLPR). Additionally, they participated in an affective memory task designed to measure biased attention to emotional stimuli, a
putative marker of amygdala reactivity. Regression analyses tested for main effects and gene-environment interactions (GxE), and moderated mediation analyses tested whether biased attention to emotional stimuli mediated the relationship between the GxE and the mood outcomes.
The gene chosen for this study, HTTLPR, has been the subject of some controversy recently (Caspi, Hariri, Holmes, Uher, & Moffitt, 2010; Karg, et al., 2011; Risch, et al., 2009). Initially just two alleles were identified: A “low activity” S allele, and a “high activity” L allele, which lead to greater and lesser amounts of serotonin in the synapse, respectively. Individuals who are S carriers or who are homozygous for (have two copies of) the S allele demonstrate greater degrees of negative effects such as increased anxiety
sensitivity (Gotlib, et al., 2008) and increased risk for depression (Brown & Harris, 2008). However, after a substantial amount of HTTLPR research had been published—some of it contradictory—it became apparent that there are actually two versions of the L allele, one of which mimics the activity of the S allele (Hu, et al., 2006). Studies that choose to genotype this variant of the L allele now characterize individuals as “low activity” or “high activity” allele carriers (e.g., Pérez-Edgar, et al., 2009). However, not all researchers are either aware of this development or have the resources to genotype their samples in this manner.