TALAR CARTILAGE DEFORMATION FOLLOWING STATIC AND DYNAMIC LOADING IN THOSE WITH AND WITHOUT CHRONIC ANKLE INSTABILITY
Kyeongtak Song
A dissertation submitted to the faculty at the University of North Carolina at Chapel Hill in partial fulfillment of the requirements for the degree of Doctor of Philosophy in the Department
of Interdisciplinary Human Movement Science in the School of Medicine.
Chapel Hill 2019
ABSTRACT
Kyeongtak Song: Talar Cartilage Deformation Following Static and Dynamic Loading in Those With and Without Chronic Ankle Instability
(Under the direction of Erik A. Wikstrom)
Chronic ankle instability (CAI) has been linked with the development of ankle post-traumatic osteoarthritis. To date, compositional changes have been noted using advanced MR-based imaging techniques which are not clinically accessible or cost-effective. Ultrasonography (US) is a valid and reliable technique to assess cartilage thickness, but it remains unknown if CAI influences the magnitude of cartilage deformation relative to uninjured healthy controls during static and/or dynamic loading. Therefore, the purpose of this study was to establish the acute response of talar cartilage to a standardized static and dynamic loading protocol in individuals with CAI compared to uninjured healthy controls. Also, the aims of this study to identify patient-, clinician, and laboratory-oriented correlates of talar cartilage thickness (at rest) and deformation in those with CAI.
Thirty CAI and 30 uninjured controls completed the patient-, clinician-, and laboratory-oriented assessment during the first session. In the second and third sessions, participants
completed the US assessments before and after static and dynamic loading protocol based on the counterbalanced order of testing sessions. Normalized cross-sectional area of the medial, lateral, and overall talar cartilage and percentage change scores were calculated.
The results from this study indicate that a greater magnitude of talar cartilage
reaction force components during a single leg hop were correlated with increased cartilage deformation after a dynamic loading protocol. Similarly, decreased dorsiflexion range of motion and worse performance on the side hop test were correlated with greater cartilage deformation in those with CAI. Also, our data illustrates relationships among inversion laxity and poor static postural control with increased talar cartilage deformation following a static loading protocol.
TABLE OF CONTENTS
LIST OF TABLES ... ix
LIST OF FIGURES ... xi
LIST OF ABBREVIATIONS ... xii
CHAPTER 1: INTRODUCTION ... 1
Primary Aims ... 4
Specific aim 1 ... 4
Specific aim 2 ... 4
Specific aim 3 ... 6
Secondary Research Questions to Be Addressed ... 9
CHAPTER 2: REVIEW OF LITERATURE ... 11
Introduction ... 11
The pathway from ankle sprain to ankle PTOA ... 13
Talar Condral Lesions ... 13
Altered Loading ... 13
Quantifying ankle cartilage health ... 20
Conclusion ... 25
Experimental Design ... 29
Methods... 30
Participants ... 30
Power analysis ... 31
Procedures ... 32
Statistical analysis ... 41
CHAPTER 4: GENERAL RESULTS ... 46
Specific Aim 1 ... 46
Results ... 46
Specific Aim 2 ... 49
Results ... 49
Specific Aim 3 ... 54
Results ... 54
Plans for Secondary Research Analysis ... 60
CHAPTER 5: MANUSCRIPT 1 ... 61
Introduction ... 61
Methods... 63
Experimental design ... 63
Participants ... 63
Data collection procedures ... 64
Statistical analysis ... 67
Results ... 68
Conclusion ... 73
CHAPTER 6: MANUSCRIPT 2 ... 75
Introduction ... 75
Methods... 77
Participants ... 77
Procedures ... 77
Statistical analysis ... 81
Results ... 81
Discussion ... 84
Conclusion ... 87
CHAPTER 7: MANUSCRIPT 3 ... 88
Introduction ... 88
Methods... 89
Participants ... 89
Statistical analysis ... 93
Results ... 93
Discussion ... 95
Conclusion ... 98
APPENDIX 1: IDENTIFICATION OF FUNCTIONAL ANKLE INSTABILITY ... 99
APPENDIX 2: THE FOOT AND ANKLE ABILITY MEASRUES ... 100
APPENDIX 3: THE INTERNATIONAL PHSYICAL ACTIVITY QUESTIONNAIRE ... 103
APPENDIX 4: THE FOOT AND ANKLE OUTCOME SCORE ... 104
LIST OF TABLES
Table 4.1.1. Pre-post talar cartilage thickness changes following a 60-hop
protocol. ... 48 Table 4.1.2. Pre-post talar cartilage thickness changes following a 2-min standing
protocol. ... 48 Table 4.2.1.1. Pearson correlation coefficients (r) between AOS and FAOS and
cartilage thickness and deformation ... 49 Table 4.2.1.2. Pearson correlation coefficients (r) between SF-36 scores and
cartilage thickness and deformation ... 50 Table 4.2.1.3. Pearson correlation coefficients (r) between PROMIS scores and
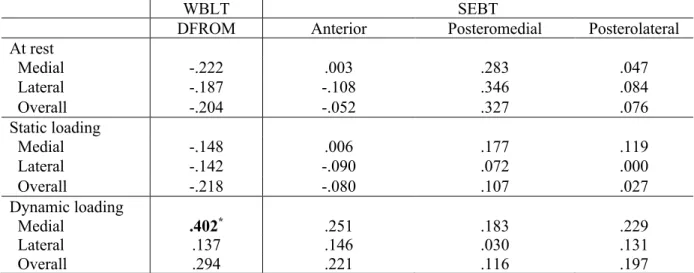
cartilage thickness and deformation ... 51 Table 4.2.2. Pearson correlation coefficients (r) between WBLT and SEBT scores
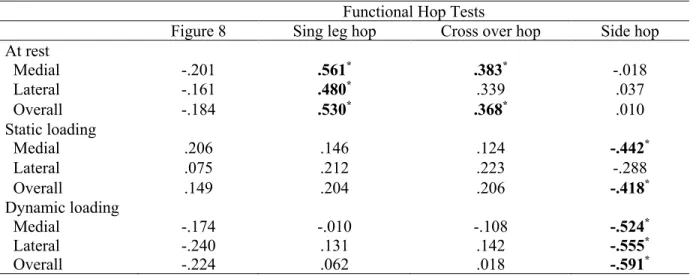
and cartilage thickness and deformation ... 52 Table 4.2.3. Pearson correlation coefficients (r) between functional hop test
scores and cartilage thickness and deformation ... 53 Table 4.3.1. Pearson correlation coefficients (r) between ankle joint laxity and
cartilage thickness and deformation ... 54 Table 4.3.2. Pearson correlation coefficients (r) between static postural control
and cartilage thickness and deformation ... 55 Table 4.3.3.1. Pearson correlation coefficients (r) between standing kinematics
and cartilage thickness and deformation ... 56 Table 4.3.3.2. Pearson correlation coefficients (r) between walking kinematics
and kinetics and cartilage thickness and deformation ... 57 Table 4.3.3.3. Pearson correlation coefficients (r) between hopping kinematics
and kinetics and cartilage thickness and deformation ... 58 Table 4.3.3.4. Pearson correlation coefficients (r) between landing kinematics and
kinetics and cartilage thickness and deformation ... 59 Table 5.1. Participant demographics, injury history characteristics, and
self-reported function. ... 68 Table 5.2. Raw changes and minimal detectable changes (MDCs) for hopping and
Table 6.1. Participant demographics, injury history characteristics, and
self-reported function. ... 83 Table 6.2. Dependent variable descriptive statistics. ... 83 Table 7.1. Participant demographics, injury history characteristics, and
self-reported function. ... 94 Table 7.2. Dependent variable descriptive statistics ... 94 Table 7.3. Pearson correlation coefficients (p-values) between ankle joint laxity
and balance and cartilage deformation ... 95
LIST OF FIGURES
Figure 2.1. The plausiblepathway from ankle sprain to ankle post-traumatic
osteoarthritis. ... 27 Figure 2.2. Summary of factors influencing ankle joint loading in those with
lateral ankle sprain, chronic ankle instability, and ankle osteoarthritis. ... 28 Figure 3.1.Overall study design diagram. ... 30 Figure 3.2.Ultrasonography set up and participants positioning for A) talar and B)
femoral cartilage. Ultrasonography outcome measures for C) talar and D)
femoral cartilage. ... 35 Figure 4.1.1. Talar cartilage thickness changes following a 60-hop protocol. ... 47 Figure 4.1.2.Talarcartilage thickness changes following a 2-min standing
protocol. ... 47 Figure 5.1. Study design. Each of the two data collection sessions were separated
by at least 1 week. The loading conditions were counterbalanced for each
participant. ... 66 Figure 5.2. Ultrasonography image analysis. (A) positioning of participants and
ultrasound transducer. (B) Cross-sectional area and length of each region
of interest. ... 67 Figure 5.3. Pre-post talar cartilage thickness changes following a 60-hop protocol. ... 70 Figure 5.4. Pre-post talarcartilage thickness changes following a 2-min standing
protocol. ... 70 Figure 6.1. Scatter plot for (a) weight bearing lunge test and medial cartilage
deformation and (b) peak vertical ground reaction force and overall
cartilage deformation. ... 84 Figure 7.1. Scatter plots for (a) between inversion laxity and medial cartilage
deformation and (b) time-to-boundary mean in mediolateral direction and
LIST OF ABBREVIATIONS ATFL Anterior Talofibular Ligament
CAI Chronic Ankle Instability FAAM Foot and Ankle Ability Measure
IdFAI Identification of functional ankle instability LAS Lateral Ankle Sprain
MR Magnetic Resonance OA Osteoarthritis
OCD Osteochondritis dissecans PTOA Post-Traumatic Osteoarthritis SEBT Star Excursion Balance Test US Ultrasound
CHAPTER 1: INTRODUCTION
Lower extremity injury is a leading cause for the cessation of physical activity participation.1 Decreased physical activity results in decreased quality of life, and significant long-term negative sequelae.2 Ankle sprains are the most common musculoskeletal injury
associated with physical activity and athletic participation, accounting for approximately 60% of all injuries that occur during interscholastic and intercollegiate sports.3, 4 Up to 75% of
individuals who sprain their ankle subsequently develop chronic ankle instability (CAI); a condition characterized by life-long residual symptoms, recurrent injury, and decreased physical activity.5-7 Further, as many as 78% of those with CAI develop ankle post-traumatic
osteoarthritis (PTOA).8, 9 Just a single lateral ankle sprain causes talar degeneration in human10 and has been demonstrated to reduce knee joint space in an animal model.11
The exact mechanisms of how ankle sprains and CAI contribute to the development of PTOA throughout the lower extremity is unknown. However, sensorimotor,12 structural,13, 14 and biomechanical15-19 alterations likely increase joint contact strain and lead to degenerative
changes.8, 9, 20 For example, Bischof et al21 found that the talar peak contact strain translated anteriorly and medially with increasing weight acceptance in the involved ankle of those with unilateral CAI. Similarly, Bae et al22 found that talar cartilage strain was increased while walking in those with a history of ankle injury. Golditz et al23 also showed that longer time to
thickness, measured via ultrasonography, correlates with the increased vGRF loading rates during walking gait in those with CAI24 and 2) postural instability correlates with declines in cartilage composition (T1rho).25 These results suggest that sensorimotor dysfunction and/or biomechanical alterations represent plausible mechanisms for declines in cartilage health in those with CAI. Fully elucidating the underlying mechanisms responsible for cartilage health declines in those with CAI is crucial for refining intervention strategies that athletic trainers can use to slow the progression of PTOA following lateral ankle sprains.
No effective PTOA treatment exists, particularly once joint disease becomes severe. Thus, the most promising approach for slowing PTOA progression is early interventions that address the sensorimotor12 and biomechanical alterations15-19 caused by lateral ankle sprains. Unfortunately, quantifying early joint degeneration is limited to magnetic resonance (MR) techniques which are costly and do not allow an athletic trainer to evaluate an intervention’s ability to slow early PTOA progression in the clinical setting. A hallmark feature of PTOA is a decline in articular cartilage health26 but the earliest deleterious changes in cartilage health involve alterations in cartilage composition (e.g. reduced proteoglycan density, collagen
disorganization) without overt changes in cartilage morphology (e.g. thickness).27 Using MR, T2 mapping showed compositional changes in young athletes that had functional ankle instability for <5 years.28 Our data also show compositional declines (i.e. decreased proteoglycan density via T1rho MR scans) in college-aged CAI patients relative to controls.29 Despite compositional differences, talar cartilage volume did not differ between the groups. These compositional changes are theorized to alter the ability of the cartilage to respond to loading.30 Compositional breakdown is also purported to impair the resiliency (i.e. recovery from loading) of the
represent a surrogate of cartilage composition, as deformation and resiliency are governed by tissue composition.32
Previous MR studies indicate that talar cartilage volume decreases after static (single leg standing, double limb squat, single limb squat) and dynamic loading (single leg drop jump, single limb hopping).33 However, we do not know if the observed deformation patterns are normal as an uninjured control group was not assessed. Our knowledge of cartilage recovery in CAI patients is also based on MR technology and the load from which the cartilage was
recovering, was not controlled for.28, 34 While MR remains the gold standard in cartilage visualization, it is too expensive and time intensive to be useful as a clinical screening tool for poor cartilage health. Ultrasonography (US), is a valid and reliable technique to assess cartilage thickness at the knee35-37 and our data showed that US talar cartilage thickness was correlated with MR volume. Thus, US may represent a viable alternative to MR. However, it remains unknown if CAI influences the magnitude of cartilage deformation and/or resiliency relative to uninjured healthy controls during static and/or dynamic loading.
Our long-term goal is to develop therapeutic interventions that can slow PTOA
Primary Aims
Specific Aim 1: To determine if talar cartilage deformation using ultrasonography following standardized standing and hopping protocols differs between those with CAI and healthy controls.
Research Questions
1.1. Do individuals with CAI demonstrate different talar cartilage deformation following a 2-minute standing protocol compared to healthy controls?
1.2. Do individuals with CAI demonstrate different talar cartilage deformation following a 60-hop protocol compared to healthy controls?
Hypotheses
1.1. CAI group will demonstrate greater talar cartilage deformation following a 2-minute standing protocol relative to healthy controls.
1.2. CAI group will demonstrate greater talar cartilage deformation following a 60-hop protocol relative to control group.
Specific Aim 2: To identify patient and clinician-oriented correlates of talar cartilage thickness (at rest) and deformation in those with CAI.
Research Questions
2.1.1 Does self-reported function correlate with talar cartilage thickness at rest? 2.1.2 Does self-reported function correlate with talar cartilage deformation after a standing protocol?
2.2.1. Do dorsiflexion range of motion and dynamic postural control correlate with talar cartilage thickness at rest?
2.2.2. Do dorsiflexion range of motion and dynamic postural control correlate with talar cartilage deformation after a standing protocol?
2.2.3. Do dorsiflexion range of motion and dynamic postural control correlate with talar cartilage deformation after a hopping protocol?
2.3.1. Does functional hop performance correlate with talar cartilage deformation after a standing protocol?
2.3.2. Does functional hop performance correlate with talar cartilage deformation after a hopping protocol?
Hypotheses
2.1.1. Lower Foot and Ankle Ability Measure (FAAM), the FAAM-Sport (FAAM-S), and the Foot and Ankle Osteoarthritis Scale (FAOS) scores will correlate with thinner talar cartilage thickness at rest.
2.1.2. Lower FAAM, FAAM-S, and FAOS scores will correlate with increased talar cartilage deformation after a standing protocol.
2.2.1. Shorter distances during the weight-bearing lunge test and reach distances during star excursion balance test will correlate with thinner talar cartilage thickness at rest. 2.2.2. Shorter distances during the weight-bearing lunge test and reach distances during star excursion balance test will correlate with increased talar cartilage deformation after a standing protocol.
2.2.3. Shorter distances during the weight-bearing lunge test and reach distances during star excursion balance test will correlate with increased talar cartilage deformation after a hopping protocol.
2.3.1. Shorter times and longer distances during functional hop tasks will correlate with decreased talar cartilage deformation after a standing protocol.
2.3.2. Shorter times and longer distances during functional hop tasks will correlate with decreased talar cartilage deformation after a hopping protocol.
Specific Aim 3: To identify laboratory-oriented correlates (i.e. biomechanical and sensorimotor outcomes) of talar cartilage thickness (at rest) and deformation in those with CAI.
Research Questions
3.1.1. Does ankle joint laxity correlate with talar cartilage thickness at rest?
3.1.2. Does ankle joint laxity correlate with talar cartilage deformation following a standing protocol?
3.2.1. Does instrumented static postural control correlate with talar cartilage thickness at rest?
3.2.2. Does instrumented static postural control correlate with talar cartilage deformation following a standing protocol?
3.2.3. Does instrumented static postural control correlate with talar cartilage deformation following a hopping protocol?
3.3.1. Do ankle kinematics at initial contact during walking gait, hopping, and jump landing correlate with talar cartilage thickness at rest?
3.3.2. Do ankle kinematics at initial contact during standing and walking gait correlate with talar cartilage deformation after a standing protocol?
3.3.3. Do ankle kinematics during hopping and jump landing correlate with talar cartilage deformation after a hopping protocol?
3.3.4. Do kinetic variables during the loading phase of standing and walking correlate with talar cartilage deformation after a standing protocol?
3.3.5. Do kinetic variables during the loading phase of hopping and jump landing correlate with talar cartilage deformation after a hopping protocol?
Hypotheses
3.1.2. Increased anterior-posterior and inversion-eversion joint laxity using ankle arthrometer will correlate with increased talar cartilage deformation after standing protocol.
3.1.3. Increased anterior-posterior and inversion-eversion joint laxity using ankle arthrometer will correlate with increased talar cartilage deformation after hopping protocol.
3.2.1. Increased center of pressure outcomes during 10-s single limb stance will correlate with thinner talar cartilage thickness at rest.
3.2.2. Increased center of pressure outcomes during 10-s single limb stance will correlate with increased talar cartilage deformation after standing protocol.
3.2.3. Increased center of pressure outcomes during 10-s single limb stance will correlate with increased talar cartilage deformation after hopping protocol.
3.3.1. Increased ankle joint angles at the initial contact during walking, hopping, and jump landing will correlated with thinner talar cartilage thickness at rest.
3.3.2. Increased ankle joint range suring single limb standing and ankle joint angle at the initial contact during walking will correlate with increased talar cartilage deformation after a standing protocol.
3.3.4. Higher peak vertical ground reaction forces and loading rate during the loading phase of single limb standing and walking will correlate with increased talar cartilage deformation after a standing protocol.
3.3.5. Higher peak vertical ground reaction forces and loading rates during the loading phase of hopping and jump landing will correlate with increased talar cartilage
deformation after a hopping protocol.
Secondary Research Questions to be addressed
These questions will be addressed, but not as part of formal dissertation.
SRQ 1: To determine the time needed for talar cartilage to reach a resting state (i.e. fully recovery from real world activity).
SRQ 2: To determine if cumulative external loading during a one-week monitoring period correlates to talar cartilage deformation.
Research Question
2.1. Do average steps-per-day and minutes of moderate-to-vigorous physical activity during a one-week monitoring period correlate to talar cartilage deformation following standing protocol?
SRQ 3: To determine if cumulative external loading during a one-week monitoring period correlates to talar cartilage recovery during a 60-minute off-loading period.
SRQ4: To determine if femoral cartilage deformation using ultrasonography following a standardized standing and hopping protocols differs between those with CAI and healthy controls.
Research Questions
4.1. Do individuals with CAI demonstrate different femoral cartilage deformation following a standing protocol compared to healthy controls?
4.2. Do individuals with CAI demonstrate different femoral cartilage deformation following a hopping protocol compared to healthy controls?
SRQ5: To identify patient, clinician, and laboratory-oriented correlates to femoral cartilage thickness (at rest) and deformation in those with CAI.
Research Questions
5.1. Does self-reported function correlate with femoral cartilage thickness at rest and deformation after loading protocols?
5.2. Do clinician-oriented outcomes (i.e. range of motion, star excursion balance test, functional hop tests) correlate with femoral cartilage thickness at rest and deformation after loading protocols?
CHAPTER 2: REVIEW OF LITERATURE
Plausible Mechanisms of and Techniques to Assess Ankle Joint Degeneration following
Lateral Ankle Sprains: A Narrative Review
Phys Sportsmed. 2019 Feb 11:1-9. doi: 10.1080/00913847.2019.1581511
1. Introduction
Lateral ankle sprain (LAS) is the most common lower extremity musculoskeletal injury in physically active persons4, 38, 39 and the general population.40-42 LASs are commonly
Ankle joint osteoarthritis (OA) causes significant physical limitations to an individual.48 Roughly 12% of symptomatic OA is attributable to lower extremity post-traumatic OA (PTOA), and up to 80% of all cases of ankle OA is post-traumatic in nature.49-51 PTOA develops
secondary to joint trauma. Common etiologies for ankle PTOA are a history of both a single ankle sprain and recurrent ankle sprains.49, 51, 52 Specifically, Saltzman et al.49 reported that 13.7% and 14.6% of all cases of ankle PTOA were the result of a single ankle sprain and recurrent ankle sprains, respectively. Harrington et al.52 reported that about 80% of those with CAI beyond 10 years had degenerative changes of the talar articular cartilage. More importantly, patients with ankle PTOA tend to be younger and demonstrate faster progression to the final stages of OA compared to those with OA of other lower extremity joints.8 In the US alone, the annual direct health care expenses for lower extremity PTOA is approximately $3.06 billion.50 Collectively, the high prevalence of ankle injuries and its relationship with the early onset of PTOA development may result in increased duration of pain and functional loss as well as an increased public health burden. Despite the known links between LAS, CAI, and PTOA and the evidence demonstrating the burden of LAS and its sequelae, early pathoetiological changes and how they can be assessed are poorly understood among researchers and practitioners. However, leveraging our knowledge about these changes and how they can be quantified will permit the assessment of how well therapeutic interventions can slow ankle PTOA progression.
progression. However, assessing the effectiveness of such interventions must be based on direct markers of disease progression and cartilage health.
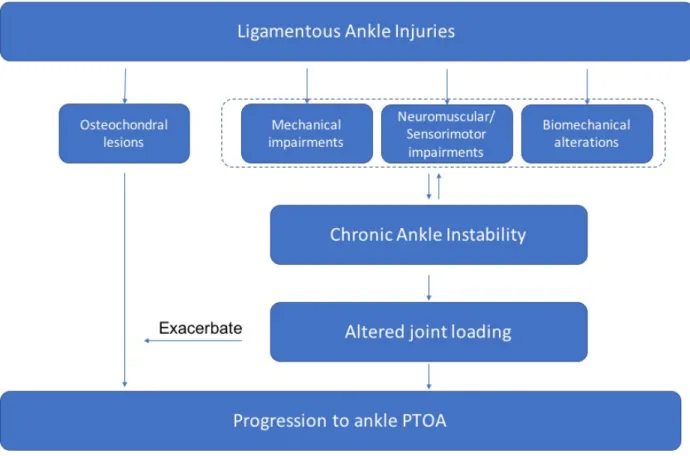
2. The pathway from ankle sprain to ankle PTOA
Despite the high incidence of ankle sprains and PTOA, the underlying etiology of ankle PTOA is not fully elucidated. It is theorized that joint degeneration after ankle sprains may result from damage to the articular surface at the time of ankle sprain (i.e. talar lesions) or from
residual joint instability (i.e. altered loading).10, 21, 49, 52
2.1 Talar Condral Lesions
Previous data has observed that 89% of young patients (mean age of 19 years) with a severe acute ankle sprain had talar chondral lesions.10 The talar chondral lesions are commonly found arthroscopically on the medial aspect of the talus in patients with acute LAS and CAI.10, 52 During a typical LAS, it is speculated that the medial talar dome impacts the inner surface of the medial malleolus or tibial plafond, which may result in a talar osteochondral lesion on the medial talus. Empirical data also indicates that a partial or complete tear of the anterior talofibular ligament (ATFL) results in early degenerative changes in the anteromedial and anterolateral regions of the talar dome compared to an uninjured ankle53 supporting this premise.
2.2 Altered Loading
ankle sprains contribute to the development of ankle PTOA is unknown, altered joint contact stress is a theorized mechanism.21 For example, Bischof et al21 found that talar peak contact strain translated anteriorly and medially with increasing weight acceptance in the involved ankle of those with unilateral CAI. This altered joint contact strain, particularly over the long-term alterations, are likely the result of the residual sensorimotor12, structural13, 14, and/or
biomechanical15-19 changes observed in those with CAI. Indeed, each of these adaptation categories is considered a potential causal factor for early degenerative changes of the talar articular cartilage.9, 20-22, 54 (Figure 2.1) The following section summarizes the evidence
documenting the presence of these factors in those with LAS, CAI, and ankle OA, demonstrating the potential role that each domain could have in the development of ankle PTOA.
Understanding their role will help develop therapeutic interventions that could intervene on ankle PTOA development.
2.2.1. Structural factors influencing ankle joint loading
that joint laxity contributes to the initiation and progression of ankle PTOA. However, as ankle OA progresses to a more severe stage, the ankle joint typically become progressively stiffer,57 likely due to the development of osteophyte growth. Ankle PTOA patients have demonstrated decreased laxity outcomes, possibly due to increased ankle joint stiffness.58 Similarly,
osteophytes and subchondral sclerosis were more prevalent in volleyball players with a history of ankle sprains compared to healthy controls.59 Thus we speculate that osteophyte formation, due to altered contact stresses, ultimately result in joint stiffening. Future research is needed to prospectively quantify long-term prospective changes in ankle joint laxity and joint stiffness as an ankle sprain degenerates to confirm this hypothesis.
Dorsiflexion restrictions have been observed in those with LAS, CAI, and ligamentous ankle PTOA.58, 60, 61 Sagittally, Denegar et al56 reported restrictions in posterior talar glide in subjects with a history of a lateral ankle sprain. Similarly, Wikstrom and Hubbard62 found that individuals with unilateral CAI had a significantly more anteriorly positioned talus in the involved limb relative to the uninvolved limb and the matched control group. During weight-bearing activities, these malalignments could contribute to alter ankle joint loading by restricting dorsiflexion range of motion. Reduced dorsiflexion has been reported in individuals with LAS and CAI60, 61 in a variety of weight-bearing activities such as walking63, jogging64, and jump landing.15 Limited dorsiflexion will limit an individual’s ability to absorb impact forces with the gastrocnemius-soleus complex and result in increased stress being transmitted to the talar articular surface. In the frontal plane, individuals with LAS and CAI were more likely to be correlated with hindfoot varus malalignemnt.8, 52
loading distributions across the joint and increase contact stress on the medial aspect of the talus.66 Noguchi67 reported similar findings, illustrating that an ankle without lateral ankle ligaments had an increased stress distribution on the medial side of the ankle joint. Although there are similar patterns in structural changes among LAS, CAI, and ankle PTOA, prospective studies are needed to investigate the long-term effects of altered joint laxity, range of motion, and joint alignments following ankle sprains on cartilage health.
2.2.2. Sensorimotor factors influencing ankle joint loading
Sensorimotor deficits following a LAS are broad in nature as impairments have been noted in alpha motor neuron pool excitability, strengths, and postural control.12 Reduced strength at the ankle joint is commonly observed across LAS60, 68-70, CAI14, 71-73, and ankle PTOA58 individuals. This is consistent with other findings suggesting that ankle OA patients have less isometric dorsiflexion and plantar flexion torque production compared to the
contralateral ankle and a control group.74, 75 An explanation of this reduced strength and torque production in CAI and ankle OA patients might be muscle atrophy. Evidence for muscle atrophy has been found in both CAI76 and ankle OA patients.74, 75, 77 For example, the intrinsic foot muscles and soleus muscle volume measured by MR Imaging in individuals with CAI was smaller than healthy controls.76 Similarly, quantitative MR imaging analysis showed a
changes in the number of available motor neurons responding to an excitatory stimulus.78 A study indicated facilitation of the soleus MNPE and an inhibition of the tibialis anterior MNPE in an involved LAS limb compared to the healthy limb.79 Previous research also found decreased alpha-MNPE of the soleus80 and peroneus longus80, 81 in CAI patients. While no study has investigated the MNPE in those with ankle PTOA, patients with knee OA had reduced
quadriceps MNPE, which diminish voluntary quadriceps activation and this was hypothesized to contribute to the quadriceps weakness identified in the study sample. Therefore, AMI and/or muscle atrophy in those with CAI could contribute to muscle weakness, as OA progresses and/or contribute to PTOA. Either mechanism could negatively influence joint stability by decreasing shock absorption during dynamic activities. However, longitudinal studies are needed to
understand how strength deficits post ankle sprain and their underlying mechanisms influence the development of ankle PTOA.
composition in those with CAI.23 While the current evidence indicates that CAI associated postural control impairments correlate to markers of early degenerative changes, the exact mechanisms are still unknown. Altered postural control may be the result of compensatory strategies that the foot and ankle complex uses to accommodate for the proprioceptive and neuromuscular insufficiencies caused by the injury. Thus, the constraints of the sensorimotor system (i.e. poor postural control) may lead to alterations in the lower extremity joint kinematics and kinetics in order to complete the task, which leads to altered joint loading. However, further research is needed to understand the relationships among postural stability, joint biomechanics, and joint loading.
2.2.3. Biomechanical factors influencing ankle joint loading
Altered biomechanics during the loading response phase of various activities would change joint contact stress patterns and potentially lead to early talar cartilage degeneration. The most common alterations among those with LAS and CAI in the stance phase of gait cycle is increased inversion at initial contact in the injured limb compared to uninjured individuals.16, 17, 92 Similarly, CAI patients had a more inverted ankle and foot position while running compared to the healthy controls.63, 93 This inverted position may create an external load that further forces the ankle into inversion, resulting in giving way episodes and recurrent ankle injuries. This position likely increases stress on the medial portion of the tibiotalar joint similar to a varus
increase the stress on the ankle joint. Cumulatively, the data suggest that altered kinematics alter the loading/strain patterns on the talar cartilage, which could contribute to the development of ankle PTOA. However, some evidence showed that individuals with PTOA demonstrated decreases in ground reaction force and loading rate during walking relative to age-matched controls. 97, 98 It may be speculated that these alterations are designed to protect against pain and may be in part due to several factors including a stiffer joint and muscle weakness. For example, ankle OA associated muscle atrophy and weakness in conjunction with increased soft tissue stiffness results in restricted ankle movements98-100 as well as reduced ankle joint moments and powers during walking that ultimately reduced ankle joint loading.74, 98, 99 These altered
biomechanical profile in ankle PTOA patients manifest as slower walking speed, shorter step length, shorter single support time during walking.98, 101
presence of kinetic and kinetic alterations play a role in the development of ankle PTOA. Therefore, longitudinal research is needed to determine the how aberrant movement patterns in those with ankle sprains or instability affect cartilage health and the development of ankle PTOA.
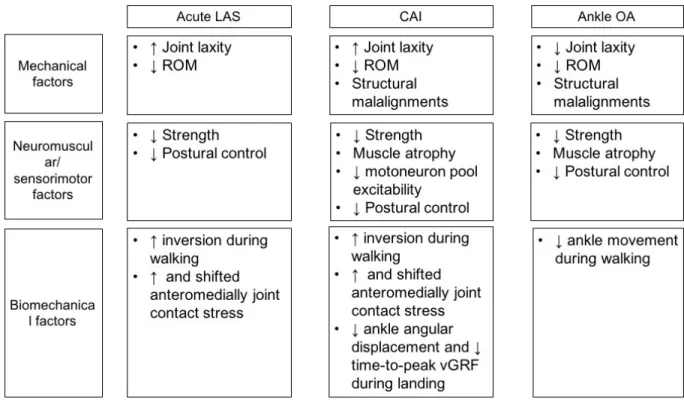
2.3. Summary of factors influence ankle joint loading
Ligamentous ankle PTOA is thought to have a multifactorial etiology, much like the causal mechanism of CAI is thought to be multi-factorial. Throughout this review, similar structural, sensorimotor, and biomechanical impairments were observed along the pathway from an acute lateral ankle sprain to ankle PTOA. (Figure 2.2) Cumulatively, the literature would suggest that the initial impairments induced following an acute lateral ankle sprain initiates a cascade of events that not only leads to the development of CAI but also initiates the
degeneration of the talar cartilage. Based on this evidence, prospective research is needed to determine the exact contributions and timing of those events to learn more about they interact to generate the hypothesized mutli-factorial mechanism responsible for the development of ankle PTOA. However, the current literature is limited solely to surrogate measures of talar cartilage health (e.g. biomechanics and contact stress) which do not provide the information necessary to determine if interventions are having a positive impact at slowing PTOA progression.
3. Quantifying ankle cartilage health
stiffness and compressive modulus) increase resistance to compressive loads,106 which may explain the lower prevalence of ankle OA compared to knee OA.107
Due to its size and properties, quantifying talar cartilage health is challenging. Most findings of cartilage health decline have been from visualizating the structure during surgical procedures.10810, 109, 110111 For example, one study noted that 21% of CAI patients had
degenerative changes at the ankle joint at the time of surgical reconstruction procedures108 while others noted that between 40% to 95% of those with CAI were found to have degenerative changes or osteochondral lesions via arthroscopic procedures.10, 109-111 While ankle arthroscopy is considered a superior method for determining intra-articular abnormalities because it allows direct visualization of the site, it is not appropriate for broad clinical application. Thus,
noninvasive diagnostic modalities were developed to detect intra-articular lesions.
Conventional/traditional magnetic resonance (MR) imaging technology allows in vivo high resolution visualization of the cartilage and is thought to be a more sensitive tool for detecting osteochondral lesions at the ankle joint compared to radiographic evaluation.112-114 Using MR imaging, previous research115 found that 41.5% of patients with an ankle sprain between 6-12 prior to study undergoing the scan, regardless of the presence of persistent complaints, had a K&L grade of at least 1. Further, this early sign of OA was observed more frequently in injured ankles compared to uninjured ankles.116 MR imaging is also 95% sensitive to the grade for osteochondral lesions of the talus when compared to arthroscopic evaluation.113 Cha et al. reported MR Imaging showed a sensitivity of 75% and 100% for grade 3 and grade 4 of cartilage lesions respectively in those with CAI. However, there is poor sensitivity for grade 1 (10%) and 2 (42%) osteochondral lesions of the talus.111 This study may indicate that the
cartilage in LAS and CAI patients. Detecting subtle changes in the early stages of OA is important because there is no effective treatments for OA once this joint disease has become severe.
Currently, more advanced MR imaging techniques allows us to quantify the biochemical changes in the articular cartilage by assessing the quantities of the primary structural elements of the cartilage: water and the extracellular matrix (ECM). The ECM is composed of type II collagen, proteoglycans, and glycosaminoglycans. 117, 118 Type II collagen fibrils in cartilage are organized into a structural framework that serves to stabilize the matrix and contributes to the shear and tensile properties of the tissue.117, 118 Proteoglycans interact with the water and create the swelling pressure that provides compressive stiffness.117, 118 Therefore, proper composition and distribution of the biochemical components is essential for normal cartilage function. In the earliest stages of OA development, proteoglycans are initially depleted resulting in the collagen matrix beginning to break down. This breakdown occurs without morphological changes but leads to greater permeability to water.119
A quantitative T2-mapping technique allows for the assessment of water and collagen content as well as the collagen orientation in cartilage.117 Changes In the structural integrity of the collagen matrix and water content are associated with increased T2 relaxation time. Using this method, Lee et al.53 found that an anterior talofibular ligament (ATFL)-deficient ankle group showed a higher talar cartilage T2 value compared to an uninjured group even though the injured group was younger. Similarly, other studies28, 120 found that young CAI individuals had higher T2-relaxation times in the talar cartilage relative to healthy individuals, supporting the
While T2 values are insensitive to changes in proteoglycan concentration,117 T1rho mapping methods are. Previous studies report that higher T1rho relaxation times are associated with lower proteoglycan density in cartilage.121, 122 Utilizing the T1rho MRI, research has shown lower proteoglycan density in the femoral and tibial articular cartilage as early as 1-year
following ACL reconstruction.123-125 However, there is a scarcity of T1rho relaxation time data for ankle cartilage. To date, only a single investigation has used T1rho and reported that CAI patients had a higher T1rho relaxation times in the talar cartilage compared to uninjured healthy individuals.29 Cumulatively, this data suggests decreased proteoglycan density and increased water content in the talar cartilage of those with CAI, which may be the indicative of early OA onset.123, 124, 126
While compositional MR techniques have been shown to be sensitive measures of cartilage health,127 MR imaging is expensive and not easily available for serial evaluation of cartilage health clinically. Ultrasonography (US) is an alternative measurement tool for quantitatively assessing cartilage thickness in a clinical setting. The decline of cartilage thickness is one of the hallmark characteristics of OA.128 US measures of cartilage thickness in the knee joint were moderately to strongly associated with thickness measures of T1 weighted MR imaging, suggesting that US can be used to assess knee joint cartilage health.35, 127 Similarly, our preliminary data also showed that US thickness was correlated to the MR volume. Thus, US may be a cost-effective and more accessible tool to evaluate talar cartilage morphology but future research is needed to test this hypothesis.
methods should be explored. For example, quantifying how the cartilage responds to and
recovers from loading could represent more robust measures because composition determines the behavior of cartilage.32 Using MR imaging, there is in vivo evidence that cartilage deformation and recovery under physiological loading conditions in healthy individuals is quantifiable. For example, 60 single leg hops resulted in decreases in talar cartilage thickness corresponding to strains of 2%.129 Van Ginckel et al33 showed that the mean volume of talar cartilage decreases by 14.6% after 2 minutes of single leg standing and by 12.5% after 10 single leg drop jumps from a 40cm box. These authors also showed that talar cartilage deformed about 10% following 30 squat exercises and restored to normal volume within 30 minutes.34 With the same exercise protocol (30 squat exercises), T2 mapping revealed increases in T2 relaxation times (+16.1%) within the talar cartilage.130 Previous studies found US imaging is sensitive enough to quantify cartilage deformation and recovery rates at the knee joint following various loading activities.131, 132 However, no studies have quantified ankle cartilage deformation and recovery following weight bearing activities using US at the ankle. A measure of cartilage deformation and recovery could provide an indicator of cartilage resiliency, which may indicate overall cartilage health in those suspected to be in the early stages of ankle OA development better than morphologic measures alone.31, 133
ankle in those with early stage ankle PTOA (mean age of 32.6±13.6). Schmal et al.136 also found that IGF-1 /IGF-1R (marker of intrinsic cartilage repair) levels were negatively associated with osteochondritis dissecans (OCD) grading, degree of cartilage damage, self-reported foot
function, and KLS in individuals with OCD (mean age of 30.7 ± 14.8). Adams et al137 identified elevated inflammatory cytokines (IL-1Ra, IL-6, IL-8, IL-10, IL-15, and MCP-1) in the synovial fluid of end-stage ankle PTOA compared to healthy controls. These data offer possible
diagnostics and interventional strategies. However, the regulation of biomarkers could differ depending on progress of ankle degeneration and sampling technique (e.g. synovial vs blood biomarkers). Therefore, further research is needed to better understand of OA biochemistry at the ankle joint and establish reliable biomarkers that are sensitive and specific to the earliest changes in ankle joint with ligamentous injury.
4. Conclusion
LASs are the most common musculoskeletal injury sustained during daily life and sport. The causal mechanism of CAI, and ligamentous ankle PTOA, sequela of LAS, appears to be multi-factorial based on the consistent presence of structural, sensorimotor, and biomechanical impairments (e.g. reduced ROM and strength, and postural control deficits, and altered
CHAPTER 3: METHODS
EXPERIMENTAL DESIGN
Figure 3.1.Overall study design diagram.
METHODS
Participants
experienced at least one episode of giving way within the past 6-months; (3) score of >11 on the IdFAI. These criteria are in agreement with the guidelines established by the International Ankle Consortium’s recent position statement.138 Exclusion criteria for the CAI group will include known vestibular and vision problems, acute lower extremity and head injuries (<3 months), chronic musculoskeletal conditions (e.g., symptoms of OA, ACL deficiency) and a history of ankle surgery to fix internal derangements.138 Self-reported function, as measured by the Foot and Ankle Ability Measure (FAAM) will be assessed but not used as an inclusion criterion consistent with the recommendations of the International Ankle Consortium.138 Those with bilateral CAI are allowed to participant and the limb with worse IdFAI scores will be considered the involved limb.
Power analysis
Procedures
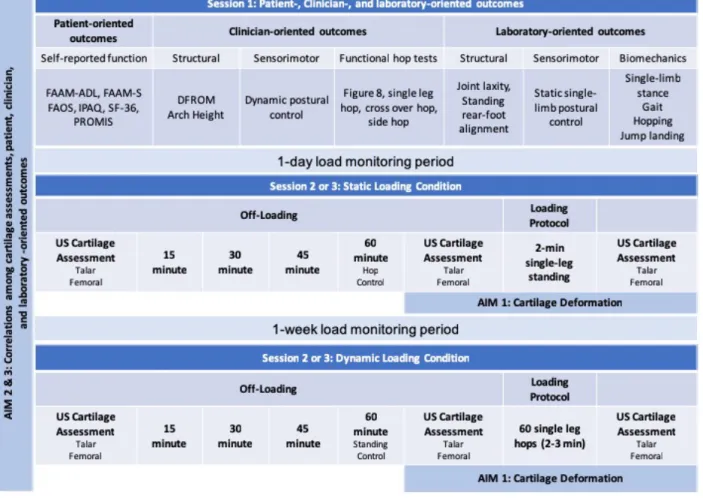
Once eligible, participants will report for the first test session. They will read and sign the consent form. Then, the patient-, clinician-, and laboratory-oriented measures will be assessed for the involved limb of the CAI group and the dominant limb of the control group. After the first session, participants will be outfitted with a wearable tri-axial accelerometer (Secondary Research Question), the ActiGraphGT9X Link (ActiGraph Corporation, Pensacola, FL). The GT9X has the capacity to capture and store high-resolution human activity information, and it has been shown to be valid and reliable for reporting steps-per-day and minutes of moderate-to-vigorous physical activity in young, active cohorts.139, 140 The next day, participants will be asked to wear the accelerometer per manufacturer guidelines for at least 24 hours until the start of their second test session. In this session, participants will complete either the static or dynamic loading protocol based on the counterbalanced order of testing sessions. Following the second test
session, participants will be asked to wear the accelerometer for another 7-day period until the start of the third test session. In the third session, participants will complete the remaining loading protocol.
Participants will be instructed that they can remove the accelerometer for bathing and sleeping, but that it should be worn at all other times throughout the day. Participants will also self-report times that they exercised during the activity monitoring using an exercise log.
Ultrasonography Off-loading period
Prior to the completion of each loading condition, all participants will complete an off-loading period of 45 minutes to minimize the effect of preceding activity on the cartilage.132 During this period, all participants will sit on a padded plinth with their back against a wall while in a long-sit position and ultrasonographic images of talar and femoral cartilage will be captured every 15 minutes. Then, participants will complete a control condition that will consist of an additional 15 minutes of off-loading before completing one of the loading conditions.
Loading protocols
For the static loading condition, participants will stand on an involved limb with 20 degrees of knee flexion for 2 minutes.33 During the standing, they will be allowed to have their fingers on a wall to assist with balance. For the dynamic loading condition, participants will complete a series of 60 single leg forward hops.129 Each hop will be 24 inches in distance. During the hopping protocol, an accelerometer will be on the shank to monitor the magnitude of loading. Participants will be given an opportunity to practice the hopping procedure should they wish. Participants will also be told to place their non-hop leg down to regain their balance should they need to. Talar and femoral cartilage will be scanned immediately followed by each loading protocol.
Ultrasonographic image
Netherlands) with a 12-MHz linear probe. This system was chosen for its increased portability and reduced cost, relative to traditional ultrasonography units. For talar cartilage, participants will be positioned with their back against a wall and their knee positioned to 90 degrees of flexion and their ankles at foot flat position (~50 degrees of plantar flexion) (see Figure
3.2.A).141 The probe will be placed transversely in line with the medial and lateral malleolus and rotated to maximize reflection of the articular cartilage surface. For femoral cartilage,
participants will be positioned with their back against a wall and their knee positioned to 140 degrees of flexion using a manual goniometer (see Figure 3.2.B).131 The probe will be placed transversely in line with the medial and lateral femoral condyles above the superior edge of the patella and rotated to maximize reflection of the articular cartilage surface.131, 142, 143 A tape measure will be secured to the treatment table, and the distance between the wall and the
posterior calcaneus will be recorded for ankle and knee measures to ensure consistent participant positioning across all time points.131 A transparency grid, placed over the US screen ensures probe placement consistency across time. Three images at each time point will be capture and averaged for further analysis. After each session, the US images will be blinded and the file names will be changed in a random order.
percentage change scores will be calculated for deformation at all time points using the following formula. Percentage Δ = [(meanpost – meanpre) / (meanpre)] *100.132 A greater negative
percentage change in thickness and cross-sectional area indicates greater cartilage deformation.
Figure 3.2.Ultrasonography set up and participants positioning for A) talar and B) femoral cartilage. Ultrasonography outcome measures for C) talar and D) femoral cartilage.
Patient-Reported Outcomes
Sport (FAAM-S), the International Physical Activity Questionnaire (IPAQ) short form, the Foot and Ankle Osteoarthritis Scale (FAOS), and short form-36 (SF-36). The FAAM (Appendix 2) assess physical function related to daily living (21 items) and sport (8 items) with scores ranging from 0 to 100%.144 Both FAAM and FAAM-S scores have been found to be reliable and precise (r=0.89, SEM= 2.1 and r=0.87, SEM= 4.5, respectively) in people with CAI.145 The IPAQ (Appendix 3) has 7 items to determine the kinds of physical activity and the intensity and volume of physical activities.146 The IPAQ has been shown to be a reliable (r=0.80)
questionnaire for monitoring population levels of physical activity147 and has been shown to detect difference between those with CAI and healthy controls148. The FAOS (Appendix 4) is a 42-item questionnaire assessing patient-relevant outcomes in 5 subscales (pain, other symptoms, activities of daily living, sport and recreation function, foot and ankle-related quality of life).149 The FAOS has been shown to possess good reliability (ICC=0.70-0.92) and moderate validity (r=0.58-0.67) in lateral ankle instability patients.149 The SF-36 (Appendix 5) comprises 11 main questions subdivided into 36 items, with higher scores representing a better state of health. The SF-36 has been tested for reliability and validity150 and has been shown to detect difference between CAI and healthy control groups.151 Lastly, the Patient-Reported Outcome Measurement Information System (PROMIS) measures of global health, physical function, and ability to participate in social roles and activities will be included. PROMIS has been shown to possess good reliability and validity in general population and individuals with chronic conditions.152-154
Structural Alignment
load-displacement and inversion-eversion rotational laxity characteristics of the involved and matched control ankle joint complex.155 The test-retest reliability of quantifying ligament laxity with this type of arthrometer is good to excellent (0.82-0.97).156 For AP displacement, the ankle will be loaded with 125N of anterior and posterior force after starting in a neutral position. For rotational laxity, the ankle will be loaded to 4Nm of torque in each direction. Three trials in each direction will be taken and averaged for further analysis.
Dorsiflexion range of motion will be assessed using the weight-bearing lunge test (WBLT).157 This test requires participants to perform a modified lunge to determine the farthest distance the great toe can be from a wall (cm), when the ipsilateral knee can touch the wall without the heel lifting from the ground. The WBLT is a reliable measure of dorsiflexion range of motion (ICC=0.80-0.99).158
Static arch height will be assessed using the navicular drop test.159, 160 The displacement of navicular tuberosity height between in the subtalar neutral position while participant is seated and in a weightbearing position while the participant is standing. The subtalar neutral position will be defined as equal palpation of the medial and lateral aspects of the head of talus. This method has shown to moderate to good reliability (ICC=0.73-0.96).160
Biomechanics
Walking gait,17, 163-166 hopping,167, 168 jump landing,23, 89, 169 and stance170 biomechanics will be assessed. Three-dimensional kinematics (sampled at 120Hz, low pass filtered at 10Hz) and kinetics (1200Hz, low pass filtered at 75Hz) will be obtained during all tasks using a 10-camera Vicon motion capture system. Participants will be outfitted with 29 retro-reflective markers bilaterally on the following bony landmarks: acromion process, manubrium, anterior superior iliac spine, a rigid cluster of three markers on the sacrum, L4-L5 vertebral space, greater trochanter, anterior thigh, medial and lateral femoral condyle, anterior shank, medial and lateral malleoli, calcanei, and the first and fifth metatarsal heads.164 Then, a static trial will be captured with the participant standing with arms across the chest to estimate the location of the landmarks needed to calculate joint centers.164 After the static trial, the markers on the medial malleoli and femoral condyle will be removed.
During gait trials, participants will walk at a self-selected speed over multiple embedded force plates. Speed will be enforced with timing gates centered over the force plates during the five practice trials though a six-meter walkway. Then, five walking test trials will be collected. The trial will be accepted for data analysis if 1) both feet hit a single force plate individually, 2) gait speed is within a range (between above and below 5% of the average speed that is
Participants also will complete five trials of hopping biomechanics at a distance of 61 cm (24 inches) away from the center of the force platform.129 This trial is consistent with the actual hops to be completed during the loading protocol. The participant will start each trial by standing on the involved limb and hop to the force plate. A successful trial will require the participant to land on the force plate and balance for 2 seconds.129, 167, 168 Jump landing biomechanics will be assessed with landing error scoring system protocol that requires participants to jump from a 30cm platform placed at a distance of 50% of the participant’s height away from the edge of the force platform, with an immediate rebound jump for maximum height.171 Five successful trials will be collected. In order to be a successful trial, 1) required to jump the box with both feet at the same time, 2) land on the force plates, 3) jump straight up as high as possible immediately after landing, and then 4) land on two feet back on the force plates.171
Kinematics will include mean values of ankle joint angular ranges (maximum value-minimum value) for standing and ankle joint angle at initial contact that are identified as the point in the trial when the vertical ground reaction force (vGRF) >10N for walking, hopping, and jump landing tasks. Kinetic variables will include loading rates (the slop of the vGRF-time curve) and peak vGRF which will be normalized by participants’ body weight.
Sensorimotor Function
Static and dynamic postural control will also be assessed. An AMTI force plate (AMTI; Watertown, MA) will be used to conduct the single limb static stance tests that will produce center of pressure (COP) outcomes in the anteroposterior (AP) and mediolateral (ML) directions. Three 10-s trials with eyes open and three 10-s trials with eyes closed will be collected,
filtered using a fourth order, zero lag, low pass Butterworth filter with a cutoff frequency of 5Hz.172 This protocol generates reliable and precise data (ICC2,1=0.34–0.87) in people with CAI.172 The primary static postural control outcomes will include COP velocity and TTB mean in the AP and ML directions. Measures of static balance have been correlated to talar
compositional health in those with CAI.25
Dynamic postural control will be assessed using a clinician-oriented outcome. Participants will complete three trials of three Star Excursion Balance Test (SEBT) in the
anterior, posteriomedial, and posteriolateral direction as previously reported.173 Reach distances will be normalized to the participant’s leg length (i.e. anterior superior iliac spine to ipsilateral medial malleolus) before being used for further analysis. Normalized SEBT reach distances are a reliable measure of dynamic balance (ICC2,1=0.85-0.96).173
Functional hop testing
possible. Both triple-crossover and single-leg hop tests will be recorded as the distance from the starting line to the heel position at the end of the jump. Each participant will be instructed on how to perform the tests and allowed practice trials for each test until they feel comfortable with the testing procedures. Three test trials will be recorded for each test and the best scores will be used for analysis. All participants will be allowed 30 seconds of rest between trials and a 1-minute rest between tests. If a participant does not perform the task correctly (i.e. unable to maintain balance upon landing, touched the contralateral limb to the floor), then that test trial will be discarded and repeated.
Statistical Analysis
Specific Aim 1: To determine if talar cartilage deformation using ultrasonography following a standardized standing and hopping protocols differs between those with CAI and healthy controls.
Research Questions
1.1. Cartilage thickness changes following the static loading protocol will be assessed using three (overall, medial, lateral) separate 2-way (Group (CAI and control) X Time (pre and post)) repeated measure analysis of variance (ANOVA) to determine if difference existed in cartilage deformation between the groups.
Specific Aim 2: To identify patient and clinician-oriented correlates of talar cartilage thickness (at rest) and deformation in those with CAI.
Research Questions
2.1.1 Pearson correlations will be run between self-reported function scores and talar cartilage thickness at rest in those with CAI.
2.1.2 Pearson correlations will be run between self-reported function scores and percentage Δ of talar cartilage thickness after a standing protocol in those with CAI. 2.1.3 Pearson correlations will be run between self-reported function scores and percentage Δ of talar cartilage thickness after a hopping protocol in those with CAI.
2.2.1. Pearson correlations will be run among distances during the weight-bearing lunge test, reach distances during star excursion balance test, and talar cartilage thickness at rest in those with CAI.
2.2.2. Pearson correlations will be run among distances during the weight-bearing lunge test, reach distances during star excursion balance test, and percentage Δ of talar cartilage thickness after a standing protocol in those with CAI.
2.2.3. Pearson correlations will be run among distances during the weight-bearing lunge test, reach distances during star excursion balance test, and percentage Δ of talar cartilage thickness after a hopping protocol in those with CAI.
2.3.2. Pearson correlations will be run between times and distances during functional hop tasks and percentage Δ of talar cartilage thickness after a hopping protocol in those with CAI.
Specific Aim 3: To identify laboratory-oriented correlates (i.e. biomechanical and sensorimotor outcomes) of talar cartilage thickness (at rest) and deformation in those with CAI.
Research Questions
3.1.1. Pearson correlations will be run between AP and IE joint laxity and talar cartilage thickness at rest in those with CAI.
3.1.2. Pearson correlations will be run between AP and IE joint laxity and percentage Δ of talar cartilage thickness following a standing protocol in those with CAI.
3.1.2. Pearson correlations will be run between AP and IE joint laxity and percentage Δ of talar cartilage thickness following a hopping protocol in those with CAI.
3.2.1. Pearson correlations will be run among COP velocity and TTB mean in both AP and ML directions and talar cartilage thickness at rest in those with CAI.
3.2.2. Pearson correlations will be run among COP velocity and TTB mean in both AP and ML directions and percentage Δ of talar cartilage thickness after a standing protocol in those with CAI.
3.3.1. Pearson correlations will be run among ankle joint angles at initial contact during walking, hopping, and jump landing, and talar cartilage thickness at rest in those with CAI.
3.3.2. Pearson correlations will be run among ankle joint angular ranges while single limb standing and ankle joint angles at the initial contact during walking, and percentage Δ of talar cartilage thickness after a standing protocol in those with CAI.
3.3.3. Pearson correlations will be run among ankle joint angles at the initial contact during single limb standing and walking, and percentage Δ of talar cartilage thickness after a hopping protocol in those with CAI.
3.3.4. Pearson correlations will be run among peak vertical ground reaction forces and loading rate during the loading phase of single limb standing and walking, talar cartilage thickness at rest, and percentage Δ of talar cartilage thickness after a standing protocol in those with CAI.
3.3.5. Pearson correlations will be run among peak vertical ground reaction forces and loading rate during the loading phase of hopping and jump landing, and percentage Δ of talar cartilage thickness after a hopping protocol in those with CAI.
If a variable is not normally distributed, a Spearman correlation analysis will be used. For all aims, we will account for potential covariates (i.e. age, sex, time since an initial ankle sprain) if necessary. An alpha level of 0.05 will be used to determine statistical significance in all
CHAPTER 4: GENERAL RESULTS
Specific Aim 1
To determine if talar cartilage deformation using ultrasonography following a standardized standing and hopping protocols differs between those with CAI and healthy controls.
Results
Prior to loading, no differences in cartilage thickness existed between assessment days or groups (p>0.05). For the dynamic loading condition, when controlling for weight, Group × Time interactions were observed for medial (p=0.043) and overall (p=0.038) talar cartilage thickness, indicating that the CAI group had greater talar cartilage deformation relative to the control group. There was also a Time main effect observed for lateral (p=0.031) cartilage thickness indicating that talar cartilage deformation increased after dynamic loading (Figure 4.1.1).
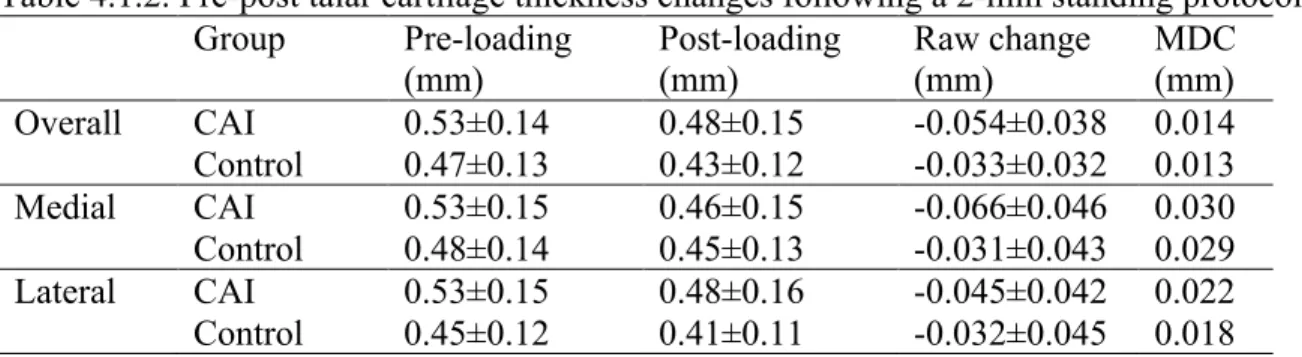
For the static loading protocol, Group × Time interactions were observed in overall (p=0.032) and medial (p=0.006) talar cartilage thickness when controlling for weight. Those with CAI had greater talar cartilage deformation compared to healthy individuals. However, there was no significant Time (p=0.237) or Group (p=0.156) effect for lateral cartilage when accounting for weight (Figure 4.2).
Figure 4.1.1. Talar cartilage thickness changes following a 60-hop protocol.
Figure 4.1.2.Talarcartilage thickness changes following a 2-min standing protocol.
Overall Medial Lateral
Controlling for weight
Group × Time interaction (p=0.043) Group × Time interaction (p=0.038) Time main effect (p=0.031)
Overall Medial Lateral
Table 4.1.1. Pre-post talar cartilage thickness changes following a 60-hop protocol. Group Pre-loading
(mm)
Post-loading (mm)
Raw change (mm)
MDC (mm) Overall CAI 0.54±0.17 0.49±0.15 -0.050±0.054 0.025 Control 0.49±0.12 0.47±0.11 -0.018±0.021 0.017
Medial CAI 0.53±0.18 0.48±0.15 -0.050±0.054 0.026
Control 0.50±0.13 0.49±0.13 -0.017±0.036 0.019 Lateral CAI 0.54±0.18 0.49±0.16 -0.048±0.063 0.034 Control 0.47±0.12 0.45±0.11 -0.018±0.011 0.022
Table 4.1.2. Pre-post talar cartilage thickness changes following a 2-min standing protocol. Group Pre-loading
(mm)
Post-loading (mm)
Raw change (mm)
MDC (mm) Overall CAI 0.53±0.14 0.48±0.15 -0.054±0.038 0.014 Control 0.47±0.13 0.43±0.12 -0.033±0.032 0.013
Medial CAI 0.53±0.15 0.46±0.15 -0.066±0.046 0.030
Specific Aim 2
To identify patient and clinician-oriented correlates of talar cartilage thickness (at rest) and deformation in those with CAI.
Results
2.1. Relationship between self-reported function score and talar cartilage thickness and deformation in those with CAI.
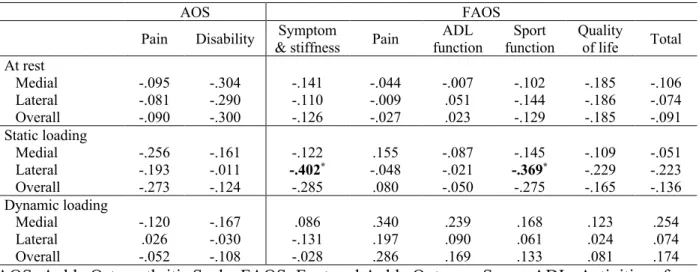
Ankle Osteoarthritis Scale (AOS) and Foot and Ankle Outcome Score (FAOS)
Greater lateral deformation after static loading was correlated with greater FAOS symptom and stiffness (p=.031) and sport function (p=.049) subscales. No other associations were found (p>.05)
Table 4.2.1.1. Pearson correlation coefficients (r) between AOS and FAOS and cartilage thickness and deformation
AOS FAOS
Pain Disability & stiffness Symptom Pain function ADL function Sport Quality of life Total At rest
Medial -.095 -.304 -.141 -.044 -.007 -.102 -.185 -.106 Lateral -.081 -.290 -.110 -.009 .051 -.144 -.186 -.074 Overall -.090 -.300 -.126 -.027 .023 -.129 -.185 -.091 Static loading
Medial -.256 -.161 -.122 .155 -.087 -.145 -.109 -.051 Lateral -.193 -.011 -.402* -.048 -.021 -.369* -.229 -.223
Overall -.273 -.124 -.285 .080 -.050 -.275 -.165 -.136 Dynamic loading
Medial -.120 -.167 .086 .340 .239 .168 .123 .254 Lateral .026 -.030 -.131 .197 .090 .061 .024 .074 Overall -.052 -.108 -.028 .286 .169 .133 .081 .174 AOS: Ankle Osteoarthritis Scale, FAOS: Foot and Ankle Outcome Score, ADL: Activities of Daily Living
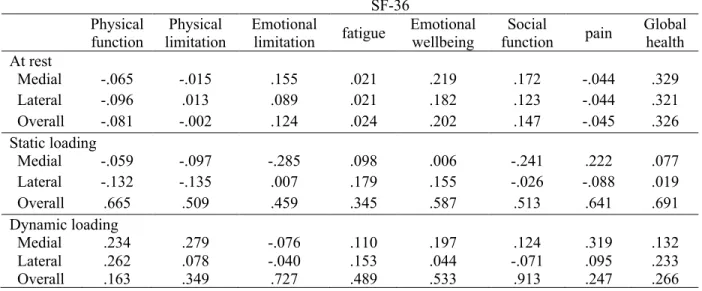
SF-36 questionnaires
There were no significant correlations between SF-36 questionnaire scores and talar cartilage thickness at baseline or deformation after static and dynamic loading. (p>.05)
Table 4.2.1.2. Pearson correlation coefficients (r) between SF-36 scores and cartilage thickness and deformation
SF-36 Physical
function limitation Physical Emotional limitation fatigue Emotional wellbeing function Social pain Global health At rest
Medial -.065 -.015 .155 .021 .219 .172 -.044 .329 Lateral -.096 .013 .089 .021 .182 .123 -.044 .321 Overall -.081 -.002 .124 .024 .202 .147 -.045 .326 Static loading
Medial -.059 -.097 -.285 .098 .006 -.241 .222 .077 Lateral -.132 -.135 .007 .179 .155 -.026 -.088 .019 Overall .665 .509 .459 .345 .587 .513 .641 .691 Dynamic loading
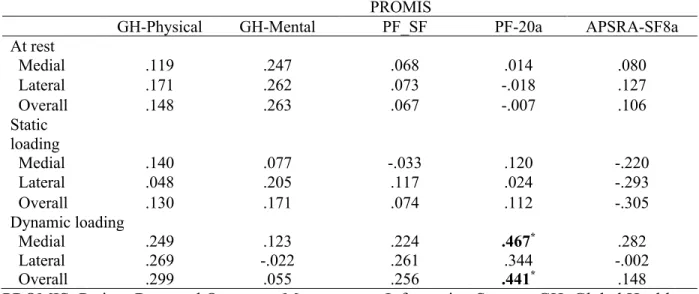
Patient-Reported Outcomes Measurement Information System (PROMIS) questionnaires
Greater medial (p=.012) and overall (p=.019) deformation after dynamic loading was moderately associated with decreased physical function scores measured by the PROMIS physical function (20a) questionnaire. No other relationships were found (p>.05)
Table 4.2.1.3. Pearson correlation coefficients (r) between PROMIS scores and cartilage thickness and deformation
PROMIS
GH-Physical GH-Mental PF_SF PF-20a APSRA-SF8a
At rest
Medial .119 .247 .068 .014 .080
Lateral .171 .262 .073 -.018 .127
Overall .148 .263 .067 -.007 .106
Static loading
Medial .140 .077 -.033 .120 -.220
Lateral .048 .205 .117 .024 -.293
Overall .130 .171 .074 .112 -.305
Dynamic loading
Medial .249 .123 .224 .467* .282
Lateral .269 -.022 .261 .344 -.002
Overall .299 .055 .256 .441* .148
PROMIS: Patient-Reported Outcomes Measurement Information System, GH: Global Health, PF: Physical Function, SF: Short-form, APSRA: Ability to Participate in Social Roles and Activities