SEDIMENT EMISSION AND WATER COLUMN OXIDATION OF METHANE IN ALASKAN ARCTIC LAKES
Gabriel E. McGowan
A thesis submitted to the faculty of the University of North Carolina at Chapel Hill in partial fulfillment of the requirements for the degree of Master of Science in the Department of Environmental Sciences and Engineering.
Chapel Hill 2012
iii ABSTRACT
GABRIEL E. McGOWAN: Sediment Emission and Water Column Oxidation of Methane in Alaskan Arctic Lakes
(Under the direction of Stephen C. Whalen)
iv
ACKNOWLEDGEMENTS
v
TABLE OF CONTENTS
LIST OF TABLES ... vii
LIST OF FIGURES ... xii
I. INTRODUCTION AND REVIEW OF THE LITERATURE... 1
i. Context and Relevancy ... 1
ii. Methane as a Greenhouse Gas ... 2
iii.The Arctic as an Atmospheric Methane Source ... 2
iv. Lake Biogeochemical Processes ... 4
v. Methane in Lake Carbon Budgets ... 5
vi. Study Goals ... 8
II. METHODS ... 10
i. Study Sites ... 10
ii. Field Sampling ... 11
iii.Experimental and Analytical ... 13
iv. Calculations and Statistics ... 15
III. RESULTS ... 18
i. Geomorphology of Study Lakes ... 18
ii. Water Column Studies ... 19
iii.Methanotrophic Bacterial Growth Efficiency and Production ... 25
iv. Radiant Energy and Sediment-Water Gas Exchange ... 26
vi
IV. DISCUSSION AND CONCLUSIONS ... 34
i. Water Column Studies ... 34
ii. Methanotrophic Bacterial Growth Efficiency and Methanotrophic Production ... 37
iii.Sediment-Water Exchanges and the Role of Radiant Energy ... 39
iv. Evasion of CH4 from the Lake Surface ... 43
v. Methane Mass Balance ... 45
vi. Summary and Conclusions ... 49
Appendix A: GTH 99 depth profile data ... 51
Appendix B: GTH 112 depth profile data ... 53
Appendix C: GTH 114 depth profile data ... 55
Appendix D: GTH 100 depth profile data ... 58
Appendix E: NE14 depth profile data ... 60
Appendix F: Toolik depth profile data ... 63
Appendix G: Methane oxidation studies data ... 66
Appendix H: Sediment-water exchange data for dissolved O2, CO2, and CH4 ... 78
vii
LIST OF TABLES
Table
1. Location, size class, and geomorphology of study lakes. ...18 2. Mean and (range) of water column concentrations of chlorophyll a (chl a),
dissolved organic C (DOC), and CH4, and mean and (range) of volume-based and specific (kCH4) rates of CH4 oxidation in study lakes at the deepest point (zmax) and mean depth ( ) of each lake. ...24 3. Whole-lake methanotrophic production estimates and comparisons to
area-based phytoplankton primary production estimates for some
study lakes. ...25 4. Attenuation coefficients for underwater irradiance (Kd), mean lake depth ( ),
photosynthetic photon flux density (PPFD) at sediment surface in clear benthic chamber, and percent of lake sediment surface area at or above
compensation depth (1% PPFD) for photosynthesis. ...27 5. Benthic chamber sediment-water exchange rates for O2, CO2, and
CH4 (mmol m-2 d-1); estimates of gross photosynthesis (PS) and predicted dark CO2 flux (mmol m-2 d-1) based on respiratory quotient of 0.85 for aerobic respiration; and comparison of predicted and observed dark
chamber CO2 flux. ...29
6. Specific (kCH4) rates of CH4 oxidation at depth of benthic chamber deployment ( ), CH4 oxidation rates in benthic chamber water and corrected CH4 flux from sediments (mmol m-2 d-1), and comparison of
corrected CH4 fluxes between dark and clear chambers. ...31
7. Net sediment inorganic C flux (mmol m-2 d-1) and percent contribution
of CH4 to inorganic C flux. ...32
8. Stagnant film model-estimated lake CH4 emissions, with surface temperatures
and CH4 concentrations...33
9. Mass balance of CH4 for study lakes and mean CH4 mass balances for
size classes. ...48 A.1. Profiles of temperature, dissolved O2, photosynthetic photon flux density,
viii
A.2. Profiles of temperature, dissolved O2, and CH4 taken at in
GTH 99on 7/21/2010. ...51 A.3. Profiles of temperature, dissolved O2, and CH4 taken at zmax in
GTH 99 on 7/21/2010. ...51 A.4. Profiles of temperature, dissolved O2, and CH4 taken at in
GTH 99 on 7/30/2010. ...52 A.5. Profiles of temperature, dissolved O2, and CH4 taken at zmax in
GTH 99 on 7/30/2010. ...52 A.6. Profiles of temperature, dissolved O2, and CH4 taken at zmax in
GTH 99 on 7/8/2011. ...52 B.1. Profiles of photosynthetic photon flux density, temperature, CH4,
chl a, and DOC taken at zmaxin GTH 112 on 6/30/2011. ...53 B.2. Profile of CH4 taken at in GTH 112 on 6/30/2011. ...53 B.3. Profiles of temperature, dissolved O2, and CH4 taken at zmax in
GTH 112 on 7/6/2011. ...53 B.4. Profiles of temperature, dissolved O2, and CH4 taken at zmax in
GTH 112 on 7/13/2011. ...54 B.5. Profiles of temperature, dissolved O2, and CH4 taken at in
GTH 112 on 7/13/2011. ...54 B.6. Profiles of temperature and dissolved O2 taken at zmaxin
GTH 112 on 7/19/2011. ...54 C.1. Profiles of temperature, dissolved O2 and CH4 taken at zmax in
GTH 114 on 7/1/2010. ...55 C.2. Profile of CH4 taken at in GTH 114 on 7/1/2010. ...55 C.3. Profile of photosynthetic photon flux density, temperature, dissolved O2,
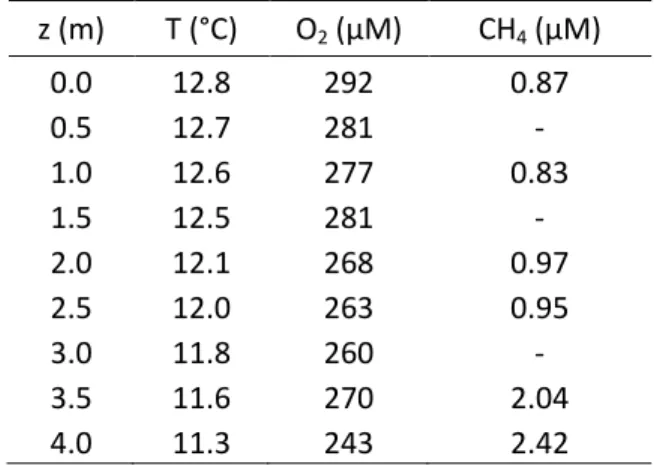
chl a, and DOC taken at zmax in GTH 114 on 7/9/2010. ...56 C.4. Profiles of temperature, dissolved O2, and CH4 at zmax in GTH 114
taken on 7/24/2010. ...56 C.5. Profiles of temperatures, dissolved O2, and CH4 taken at in
ix
C.6. Profiles of temperature, dissolved O2, and CH4 taken at zmax in
GTH 114 on 7/31/2010. ...57 C.7. Profiles of temperature, dissolved O2, and CH4 taken at in
GTH 114 on 7/31/2010. ...57 D.1. Profiles of photosynthetic photon flux density, temperature, dissolved O2,
chl a, DOC, and CH4 taken at zmaxin GTH 100 on 7/8/2010. ...58 D.2. Profiles of temperature, dissolved O2 and CH4 taken at zmax in
GTH 100 on 7/28/2010. ...59 D.3. Profiles of temperature, dissolved O2, and CH4 taken at in
GTH 100 on 7/28/2010. ...59 E.1. Profiles of photosynthetic photon flux density, temperature, dissolved O2,
chl a, DOC, and CH4 taken at zmax in NE14 on 7/15/2011. ...60 E.2. Profiles of temperature, dissolved O2, and CH4 taken at in
NE14 on 7/22/2011. ...60 E.3. Profiles of temperature, dissolved O2, and CH4 taken at zmax in
NE14 on 7/22/2011 ...61 E.4. Profiles of temperature, dissolved O2, and CH4 taken at in
NE14 on 8/6/2011. ...61 E.5. Profiles of temperature, dissolved O2, and CH4 taken at zmax in
NE14 on 8/6/2011. ...62 F.1. Profiles of photosynthetic photon flux density, temperature, dissolved O2,
CH4, chl a, and DOC taken at zmax in Toolik on 7/12/2011. ...63 F.2. Profiles of temperature, dissolved O2, and CH4 taken at in
Toolik on 7/14/2011. ...64 F.3. Profiles of temperature, dissolved O2, and CH4 taken at zmax in
Toolik on 7/21/2011. ...64 F.4. Profiles of temperature, dissolved O2, and CH4 taken at in
Toolik on 8/12/2011. ...65 G.1. GTH 99 14CH4 oxidation experiment results for raw and corrected
whole water 14C activity, biomass-incorporated 14C activity, and
respired 14C activity, and ratio of biomass-incorporated and respired 14C
x
G.2. GTH 99 measured ambient CH4 concentration when 14CH4 oxidation experiment samples were collected (7/8/2011),
calculated total CH4 oxidation rate, rate of conversion of CH4 to biomass, CH4 respiration rate, specific rate of CH4 oxidation,
and CH4 turnover time. ...67 G.3. GTH 112 14CH4 oxidation experiment results for raw and corrected
whole water 14C activity, biomass-incorporated 14C activity, and
respired 14C activity, and ratio of biomass-incorporated and respired 14C
activity to whole water 14C activity. ...68 G.4. GTH 112 measured ambient CH4 concentration when 14CH4
oxidation experiment samples were collected (6/30/2011), calculated total CH4 oxidation rate, rate of conversion of CH4 to biomass, CH4 respiration rate, specific rate of CH4 oxidation,
and CH4 turnover time. ...69 G.5. GTH 114 14CH4 oxidation experiment results for raw and corrected
whole water 14C activity, biomass-incorporated 14C activity, and
respired 14C activity, and ratio of biomass-incorporated and respired 14C
activity to whole water 14C activity. ...70 G.6. GTH 114 measured ambient CH4 concentration when 14CH4
oxidation experiment samples were collected (7/1/2010),
calculated total CH4 oxidation rate, rate of conversion of CH4 to biomass, CH4 respiration rate, specific rate of CH4 oxidation,
and CH4 turnover time. ...71 G.7. GTH 100 14CH4 oxidation experiment results for raw and corrected
whole water 14C activity, biomass-incorporated 14C activity, and
respired 14C activity, and ratio of biomass-incorporated and respired 14C
activity to whole water 14C activity. ...72 G.8. GTH 100 measured ambient CH4 concentration when 14CH4
oxidation experiment samples were collected (7/8/2010),
calculated total CH4 oxidation rate, rate of conversion of CH4 to biomass, CH4 respiration rate, specific rate of CH4 oxidation,
and CH4 turnover time. ...73 G.9. NE14 14CH4 oxidation experiment results for raw and corrected
whole water 14C activity, biomass-incorporated 14C activity, and
respired 14C activity, and ratio of biomass-incorporated and respired 14C
xi
G.10. NE14 measured ambient CH4 concentration when 14CH4 oxidation experiment samples were collected (7/22/2011), calculated total CH4 oxidation rate, rate of conversion of CH4 to biomass, CH4 respiration rate, specific rate of CH4 oxidation,
and CH4 turnover time. ...75 G.11. Toolik 14CH4 oxidation experiment results for raw and corrected
whole water 14C activity, biomass-incorporated 14C activity, and
respired 14C activity, and ratio of biomass-incorporated and respired 14C
activity to whole water 14C activity. ...76 G.12. Toolik measured ambient CH4 concentration when 14CH4
oxidation experiment samples were collected (7/21/2011), calculated total CH4 oxidation rate, rate of conversion of CH4 to biomass, CH4 respiration rate, specific rate of CH4 oxidation,
and CH4 turnover time. ...77 H.1. Volumes of water trapped in benthic chambers used to calculate
exchange rates for dissolved O2, CO2, and CH4. Volumes were
calculated based on depth of chamber penetration into sediment. ...78 H.2. Time series of dissolved O2, CO2, and CH4 concentrations in
GTH 99 benthic chambers. ...78 H.3. Time series of dissolved O2, CO2, and CH4 concentrations in
GTH 112 benthic chambers. ...79 H.4. Time series of dissolved O2, CO2, and CH4 concentrations in
GTH 114 benthic chambers. ...79 H.5. Time series of dissolved O2, CO2, and CH4 concentrations in
GTH 100 benthic chambers. ...80 H.6. Time series of dissolved O2, CO2, and CH4 concentrations in
NE14 benthic chambers. ...80 H.7. Time series of dissolved O2, CO2, and CH4 concentrations in
xii
LIST OF FIGURES
Figure
1. Depth profiles of temperature, O2 concentration, CH4 concentration,
and volume-based CH4 oxidation rates in deep lakes. ...20 2. Depth profiles of temperature, O2 concentration, CH4 concentration,
and volume-based CH4 oxidation rates in shallow lakes. ...21
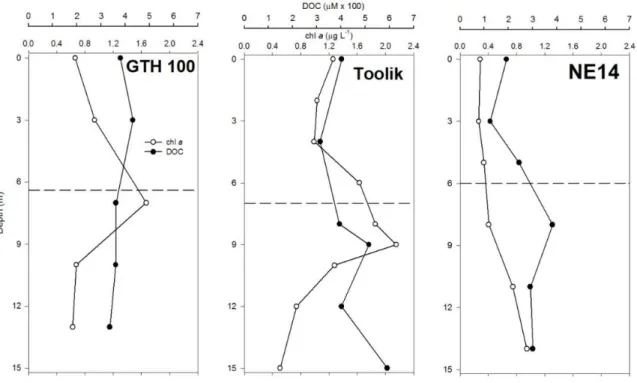
3. Depth profiles of chlorophyll a (chl a) and dissolved organic carbon (DOC)
concentrations in deep lakes. ...22
4. Depth profiles of chlorophyll a (chl a) and dissolved organic carbon (DOC)
concentrations in shallow lakes. ...23
5. Representative (GTH 114) benthic chamber time series for changes in
dissolved CH4, CO2, and O2 concentrations. ...28
6. Relationship between corrected clear chamber sediment-water CH4
exchange rate and vertical extent of surficial oxic sediment. ...42
7. Conceptual model of CH4 cycling dynamics in shallow and deep
I. INTRODUCTION AND REVIEW OF THE LITERATURE
i. Context and Relevancy
Anthropogenic emissions since the Industrial Revolution, primarily from fossil fuel combustion and changes in land use patterns, have led to a marked increase in global atmospheric mixing ratios of the greenhouse gases carbon dioxide (CO2), methane (CH4), and nitrous oxide (N2O). Linked to these emission increases has been a warming of the global climate system, manifested in rising average surface and ocean temperatures,
2 ii. Methane as a Greenhouse Gas
Methane accounts for about 20% of all radiative forcing by trace atmospheric
constituents, and is about 21 times more efficient as a greenhouse gas on a per molecule basis than CO2 (Whalen, 2005). Ice core records indicate that the atmospheric CH4 mixing ratio correlates closely with atmospheric temperature (Wuebbles and Hayhoe, 2002). The current atmospheric CH4 mixing ratio is thought to be the highest over the last 650,000 y or more (Spahni et al., 2005), and has increased from 650 to around 1800 parts per billion by volume (ppbv) in the last 200 y (Lelieveld et al., 1998). This mixing ratio represents an increase of about 30% from early 1980s levels (IPCC, 2007). The rate of increase slowed in the late 1980s and the 1990s (Dlugokencky et al., 1998; Simpson et al., 2002), and the atmospheric CH4 mixing ratio was roughly constant in the early 2000s (Dlugokencky et al., 2003). However, in recent years the CH4 mixing ratio has begun to increase again (Rigby et al., 2008). Natural wetlands represent the single largest source of CH4 to the atmosphere, releasing about 145 Tg of CH4 each year, which corresponds to around 24% of total annual CH4 emissions from all identified sources (Lelieveld et al., 1998); methane emissions from freshwater lakes are estimated to exceed those from the oceans (Bastviken et al., 2004).
iii. The Arctic as an Atmospheric Methane Source
Approximately 50% of global wetlands are located in the Arctic and sub-Arctic (Matthews, 2000), and about 14% of the global soil carbon pool is stored in tundra
3
emission vary between around 8 Tg and 68 Tg CH4 (Whalen and Reeburgh, 1988, 1990a, 1992; Bartlett et al., 1992; Reeburgh, 1996; Zhuang et al., 2004). Arctic wetlands undergo an annual CH4 emission cycle defined by the ice-free summer growing season, which accounts for most of the total yearly CH4 emitted (Whalen, 2005). In the last half century, Arctic tundra ecosystems have shifted from net sinks to net sources of carbon (Oechel et al., 1993, 1995, 2000). Climate change is expected to increase CH4 release from high latitude wetlands because of greater organic matter production during a longer growing season, as well as enhanced availability of organic matter due to permafrost thaw (e.g. Gedney et al., 2004; Hinzman et al., 2005; Zimov et al., 2005; Walter et al., 2006, 2008). However, climate change effects on emission-limiting CH4 oxidation are uncertain (Whalen and Reeburgh, 1990a&b, 1992) and atmospheric CH4 mixing ratios in the Arctic have been stable recently (Dlugokencky et al., 2009).
Permafrost underlies most of the Arctic, and changes in its extent and characteristics have been shown to correlate with fluctuations in climatic cycles (Lachenbruch and
Marshall., 1986; Osterkamp, 2005). Arctic Alaska permafrost has warmed about 3°C since the 1980s (Osterkamp, 2005; Clow and Urban, 2002), leading to an increase in the
4
analyses have shown much of the carbon in this CH4 dates to the Pleistocene and was previously stored in permafrost (Walter et al., 2006).
Lentic environments integrate watershed processes by accruing organic matter inputs, and substrate availability is, after the presence of O2, the limiting factor to
methanogenesis (Whalen, 2005). Therefore, it is conceivable that tundra lake sediments may surpass tundra soils in CH4 production, and methanogenesis is expected to intensify with climate change. However, controls on CH4 emission from Arctic lakes may differ
fundamentally from those in tundra due to the nature of lake carbon cycling processes, and relatively few studies have attempted to constrain these processes in the shallow lakes and ponds that cover roughly 20 to 40% of the surface area of the Alaskan Arctic tundra (Livingstone et al., 1958; Black, 1969; Sellman et al., 1975).
iv. Lake Biogeochemical Processes
5
organic matter and nutrients across the sediment-water interface, coupled with microbe-facilitated oxidation and reduction reactions, drives many lake biogeochemical processes. In turn, the spatial distribution and magnitude of these processes are largely dictated by
dissolved oxygen conditions resulting from physical influences.
v. Methane in Lake Carbon Budgets
Under anoxic conditions in moist soils, wetlands and lake sediments, a suite of energy-yielding hydrolytic and fermentative reactions, catalyzed by anaerobic acid-forming bacteria, act on detritus to yield CO2 and saturated fatty-acid compounds. Methanogens, obligate anaerobes, metabolize these products in the terminal degradation step,
methanogenesis, which can proceed along two primary pathways, although some groups show limited use of other simple compounds such as methylated amines (Wetzel, 2001). In the acetotrophic pathway, the fermentative intermediate acetate is disproportionated to CO2 and CH4; in the hydrogenotrophic pathway, hydrogen from organic acids enzymatically reduces CO2 to CH4:
CH3COOH CO2 + CH4 (acetotrophic pathway); 4H2 + CO2 CH4 + 2H2O (hydrogenotrophic pathway).
Methane formed by these processes diffuses or bubbles upwards from the anaerobic zone of production, and is either oxidized under aerobic conditions by methanotrophic bacteria via
CH4 + 2O2 CO2 + 2H2O,
6
surficial sediments and an extensive, highly aerobic overlying water column prior to emission to the atmosphere (e.g. Fallon et al., 1980, Rudd and Taylor, 1980, Kuivila et al., 1988, Frenzel et al., 1990, Utsumi et al., 1998a&b, DeAngelis and Scranton, 1993, Kankaala et al., 2006). Most CH4 oxidation in lakes occurs at the sediment-water interface if the bottom water is oxic, or in the water column at the lowest oxic depth, as these locations provide high concentrations of both O2 and CH4. Above this zone, the process is limited by CH4 concentration, and below, by O2 concentration (Welch et al., 1980; Griffiths et al., 1982). Therefore, while CH4 production in lake sediments may be greater in magnitude than in moist tundra soils due to more intense organic matter loading, lake sediment-generated CH4 may be subject to more extensive oxidation prior to efflux from the lake surface.
Methane that bubbles from anaerobic sediments, which may be an order of magnitude greater in quantity than CH4 diffusing from anaerobic sediments, is not subject to significant
oxidation unless trapped under ice cover (Walter et al., 2006, 2008).
Methanogenesis and CH4 oxidation in lake sediments has been the subject of much research because of their role in lacustrine and global carbon budgets. Reported rates of net CH4 release from the sediment of eutrophic, stratified lakes are often on the order of 10 mmol CH4 m-2d-1 (e.g. Rudd and Hamilton, 1978; Bedard and Knowles, 1991; Sweerts et al., 1991); for one artificially hyper-eutrophic lake, flux of CH4 from profundal sediments into the anoxic hypolimnia averaged 35.8 mmol m-2d-1, a quantity of C equivalent to about 54% of all particulate C that settled from the water column (Fallon et al., 1980). For less
7
1.41mmol m-2d-1 in a shallow Arctic tundra lake in Canada, and estimated that
methanogenesis accounted for the majority of anoxic decomposition in the lake. In lakes with oxic bottom water, CH4 consumption in the oxidized microzone of the sediments can reduce net CH4 release by about 16 to 93% compared to the flux into the oxic surficial sediment layer from the anaerobic zone (Kuivila et al., 1988; Frenzel et al., 1990; Sweerts et al., 1991).
Water column microbial CH4 oxidation has been widely studied because of its dual role as a regulator of CH4 flux to the atmosphere and a pathway for carbon transfer from the benthic to the pelagic zone. Measurements and estimates of the proportion of CH4 produced in lake sediments that is oxidized vary with lake characteristics. In general a significant fraction of this CH4 is metabolized into CO2 before it reaches the water-air interface; the percent of total CH4 production accounted for by oxidation varies from about 30 to 94% (Fallon et al., 1980, Rudd and Taylor, 1980, Kuivila et al., 1988, Frenzel et al., 1990, Utsumi et al., 1998a&b, DeAngelis and Scranton, 1993, Kankaala et al., 2006). Several studies have examined CH4 oxidation in lakes with characteristics similar to those in this study, i.e.
oligotrophic or mesotrophic lakes with highly oxic water columns. Estimates of the extent of lake CH4 oxidized generally fall at the higher end of the range in the literature, between about 70% and 95%, with depth integrated rates of oxidation 0.05 to 6 mmol m-2d-1 (Kuivila et al., 1988; Frenzel et al., 1990; Utsumi et al, 1998a&b; Kankaala et al., 2006). Area-based oxidation rates are higher in more productive lakes due to higher CH4 concentrations, e.g. 23.3 mmol m-2d-1 in Lake Mendota (Fallon et al., 1980).
8
organic carbon production from CH4 oxidation can be comparable in magnitude to organic carbon production by all heterotrophic bacteria (Hessen and Nygaard, 1992), and even that by photosynthesizers on a seasonal basis (Utsumi et al., 1998b). The pivotal role of CH4 dynamics in high-latitude lake carbon cycling has been illustrated by several groups: Bastviken et al. (2003) put methanotrophic bacterial production at 0.3 to 7% of organic C production by autotrophs in Swedish sub-Arctic lakes, while low δ13C values in zooplankton
point to the importance of CH4-derived carbon in some pelagic food webs (Bastviken et al.,
2003; Kanaaka et al., 2006). A study that artificially fertilized an Arctic lake with CH4 found
that the resulting CH4 oxidation could account for 12% or more of the total lake respiration rate (Welch et al., 1980). In summary, CH4 is important both in lacustrine food web dynamics and the global climate system, and these roles are likely magnified in the Arctic due to simple trophic structures (Roots, 1989) and the significance of high latitudes as a source of atmospheric CH4.
vi. Study Goals
9
II. METHODS
i. Study Sites
This study was conducted on six lakes located approximately 20 km north of the Phillip Smith Mountains in the Arctic Foothills region of Alaska. The landscape is
11 ii. Field Sampling
All samples were collected from an inflatable raft, or an aluminum boat. Sampling locations were at mean depth ( ) and at or near maximum depth (zmax) of each study lake. Sampling focused on three lakes (GTH 99, GTH 114, GTH 100) in the summer of 2010, and three lakes (GTH 112, NE14, Toolik Lake) in the summer of 2011.
Triplicate acrylic benthic chambers, two opaque and one translucent, were deployed by boat at in each lake under calm conditions during the ice-free season. Benthic chambers were used to measure sediment-water exchange of dissolved inorganic carbon (DIC; CO2(aq) + HCO3-+CO32-), CH4, and O2, with the clear chamber controlling for the effects of benthic photosynthetic activity. Sediment-water exchange rates for target variables were taken to be representative of whole-lake processes, as Whalen et al. (2008) have reported that is a key indicator of the relative importance of benthic and pelagic production.
12
completely homogenized in <15 min, as demonstrated by fluorescence measurements conducted repeatedly on chamber-trapped water.
Benthic chambers were sampled through 10m of 2.4mm diameter Tygon tubing extending from 5cm into the chamber top to the lake surface. A 5mm diameter tube fitted to the top of the chamber facilitated venting of surficial water during deployment and inflow of replacement water during sampling. Sampling volumes were kept to a minimum to prevent significant dilution of benthic chamber contents by replacement water. At 4h after
deployment (designated zero time; T0), and at 1 or 2 d intervals thereafter to a maximum of 23 d, chambers were sampled using a standard protocol described below. If T0 samples were turbid or showed uncharacteristic concentrations of dissolved gases, sediments were
considered disturbed and chamber was subsequently redeployed.
Chamber sampling was initiated by flushing the sampling tube with 90ml of chamber water (equivalent to twice the sampling tube volume). Thereafter, quadruplicate 10ml samples were collected by syringe for duplicate DIC (hereafter referred to as CO2) and CH4 analyses, and two 5ml syringes were drawn for dissolved O2 analysis and immediately stored on ice.
13
underwater 2π quantum sensor). Dissolved O2 and temperature profiles were determined with a YSI Model 85 multiparameter water quality meter. Surface water samples were directly collected by hand into sampling vessels, or by syringe for subsequent injection into sampling vessels, while samples from depth were collected with a Van Dorn-type sampler.
On retrieval from each sampling depth, the Van Dorn sampler was carefully opened at the top and duplicate 10 ml syringe samples were collected for CH4 analysis. The Van Dorn sampler was then closed and duplicate 43 ml samples for CH4 oxidation rate studies were collected into amber vials, which had first been overflowed with about three volumes of sample water. Vials were sealed using Teflon-lined caps, eliminating any air in the
headspace. The distal end of the sampling hose was constricted to ensure gentle flow and avoid degassing while vials were filled. Two additional 43 ml samples of surface water were collected to use as killed controls. The Van Dorn sampler was then used to fill opaque polyethylene bottles with sample water for DOC and chlorophyll a (chl a) analysis. Profiles of CH4 oxidation rates, DOC, and chl a were collected only once per lake.
All syringe-collected samples for chamber CH4 and DIC and water column CH4 analyses were injected into 30 ml serum vials filled with high purity N2 and precharged with 0.5 ml of 2.5 N HCl to arrest biological activity and convert all DIC to CO2. Prior to
injecting 10 ml water samples into these serum vials, an equal volume of N2 gas was removed from each vial to maintain an internal pressure of 1 atm.
iii. Experimental and Analytical
14
titration technique modified from Carpenter (1965). Unfiltered water from depth profiles was passed through ashed Whatman 47 mm GF/F filters. Filtrate was acidified with 0.2 ml of 2.5 N HCl and stored at 4°C in acid-rinsed and combusted (550°C) amber pyrex bottles for DOC while filter-trapped material was extracted for 24 h at -5°C in buffered 90% acetone solution for chl a analysis (Wetzel and Likens, 2000). Filters were pulverized midway through extraction; this procedure was shown by Whalen et al. (2008) to give a chl a yield not significantly different from grinding. Following Welchmeyer (1994), chl a was analyzed fluorometrically (Turner Designs TD70 fluorometer). This technique does not involve an acidification step but maintains a desensitized response to phaeopigments and chl b. Dissolved organic C was analyzed by high-temperature catalytic combustion (Shimadzu TOC-VCPH total organic carbon analyzer).
Methane and CO2 analyses were performed via flame ionization detection (FID-GC) and thermal conductivity detection (TCD-GC) gas chromatography (Shimadzu GC-8A instruments), respectively. Operating conditions for FID-GC analysis were the following: 1/8” diameter x 1 m length molecular sieve 5A (60/80) column; column temperature = 90°C;
injector and detector temperatures = 140°C; carrier gas = ultra-high purity N2 at 33 ml min-1 flow rate. Precision of analysis was <1% at 10 ppm CH4. Operating conditions for TCD-GC analysis were the following: 1/8” x 2m porapak N column (80/100); column temperature = 40°C; injector detector temperatures = 140°C, current = 140 mA; carrier gas = ultra-high purity He at 30 ml min-1 flow rate. Precision of analysis was <1% at 351 ppm CO2 (Whalen and Reeburgh, 2000).
15
solution were diluted into a calibrated 24.3 ml serum vial filled with ultra-high purity N2 to make a working standard. To prepare samples for incubation, 0.5 ml of this working 14CH4 standard was injected through the Teflon septa of the 43 ml sample vials while venting displaced water with an adjacent needle through the sealing septum. Killed (via 0.5 ml formaldehyde) controls were similarly treated. Sample vials were hand-shaken for 3 min, placed on a rotating carousel (6 rpm) in 15°C water bath and incubated in the dark for up to 24 h. Incubations were terminated by injecting 0.5 ml of 4 N NaOH through septa and hand shaking. Sample vials were then uncapped and placed on a shaker table under a fume hood for 12 h to vent unreacted 14CH4. Thereafter 8 ml aliquots of unfiltered water were placed in scintillation vials with 10 ml of Aquasol-2 scintillation cocktail. Additional subsamples were filtered (0.22 µm Millipore nitrocellulose membrane), and the filtrate similarly treated. Filters were placed in Scintisafe scintillation cocktail, and all samples were assayed for β
activity on Packard TriCarb Liquid Scintillation counter.
iv. Calculations and Statistics
16
acrylic, were used to estimate PPFD incident on the lake bottom beneath clear benthic chambers during deployment in each lake.
Headspace mixing ratios for CH4 and CO2 in serum vials were converted to mol L-1 basis, while concentrations in the aqueous phase in serum vials were calculated from temperature-corrected values of Henry’s constant (Weiss 1974; Yamamoto 1976). In situ CH4 and CO2 concentrations were computed as the sum of aqueous and gaseous phases in serum vials. Rates of sediment-water exchange of gases were calculated as the linear rate of change in mass m-2 sediment surface d-1. If the slope of this linear fit was not significant at the p<0.05 level, then the rates of change in mass of the dissolved constituent in the chamber during each sampling interval were averaged to obtain an exchange rate.
Rates of CH4 utilization (respiration + assimilation into biomass) were calculated by multiplying the fraction of added 14CH4 utilized time-1 (specific oxidation rate, kCH4) times the ambient CH4 concentration for whole water samples. Turnover times (d) were calculated as the reciprocal of the specific oxidation rate. Biomass-incorporated CH4 was estimated from β activity on filter-trapped particulates, while respired CH4 was estimated from
radioactivity associated with the filtrate. This latter quantity included 14CO2 plus DO14C. Estimates of CH4 emissions from study lakes to the atmosphere (mmol m-2 d-1) were obtained using a simple stagnant film gas transfer model (Broecker and Peng, 1974). This formulation presumes a well-mixed gas phase, and that molecular diffusion through a laminar surface layer is the limiting step for transfer from the aqueous phase. Molecular diffusivities (D; m2 s-1) of CH4 were determined for observed temperatures using a
17
according to the relationship found by Kling et al. (1992) for lakes in the same study area. Wind speed data were obtained from the TFS EDC
(http://toolik.alaska.edu/edc/weather/data_query.php), and wind speeds at TFS were
assumed representative of wind speeds throughout the study region at a given time. The ratio of D to z is an estimate of the piston velocity. Solubility coefficients (Ks) for CH4 were estimated based on temperature according to Wanninkhof (1992). The atmospheric partial pressure of CH4 was assumed to be 1.8 µatm, and used with solubility coefficients and observed surface water CH4 concentrations to obtain a concentration gradient across the laminar surface layer. A range of potential lake surface CH4 efflux rates was calculated for each study lake based on the minimum and maximum surface temperature and CH4
concentrations observed.
The Mann-Whitney U test and the Wilcoxon signed range test were used for comparisons of means between lake size classes or dark and clear chambers when the data were not normally distributed. This was often the case due to the small sample size (6 study lakes). Elsewhere, the t-test was used to assess significance. Values of p<0.05 were
III. RESULTS
i. Geomorphology of Study Lakes
All study lakes are located in the vicinity of 68°N, 149°W. Lakes in the shallow size class average 2.1 to 2.2 m depth, while average depth ( ̅) in deep lakes is 6 to 7m (Table 1). The maximum depth (zmax) for shallow lakes is 4.1 to 6.7m, while zmax in deep lakes is 15.7 to 26.3 m. Lake volume and surface area range from 15x103 to 87x103 m3 and 0.7 to 4.0 ha, respectively, in the shallow lakes. Deep lake volumes and surface areas are larger, ranging from 351x103 to 10950x103 m3 and 5.4 to 148.8 ha, respectively. Catchment areas are 13 to 59 ha for shallow lakes, while deep lake values are larger, measuring from 77 to 6760 ha. Overall, the ratio of catchment area: lake surface area varies from 3.0 to 45.4 and shows no trend with respect to lake size class.
Table 1: Location, size class, and geomorphology of study lakes. Study
Lake
Latitude (N)
Longitude (W)
Size Class
zmax
(m) (m)
Volume (103 m3)
Surface area (ha)
Catchment area (ha)
Catchment:Lake area ratio
19 ii. Water Column Studies
20
Figure 1: Depth profiles of temperature, O2 concentration, CH4 concentration, and volume-based
CH4 oxidation rates in deep lakes. Horizontal dashed line corresponds to , the mean depth of the
lake.
At zmax, water column concentrations of CH4 were extremely low, 0.06 to 0.35 µM, at all depths in the deep lakes (Figure 1; Table 2). Methane concentrations were relatively low, 0.28 to 6.08 µM, in shallow lakes down to the depth of O2 depletion in the hypolimnia, but still generally exceeded concentrations observed throughout the entire water column in deep lakes (cf. Figures 1 and 2). However, a spike in CH4 concentration occurred in the hypoxic bottom waters of the shallow lakes, where maximum concentrations of 15.5, 52.6, and 17.9 µM were observed in GTH 99, GTH 112, and GTH 114, respectively. These CH4
21
in shallow lakes and exceeded concentrations in deep lakes by two orders of magnitude or more.
Figure 2: Depth profiles of temperature, O2 concentration, CH4 concentration, and volume-based
CH4 oxidation rates in shallow lakes. Horizontal dashed line corresponds to , the mean depth of the
lake.
22
oxidation rates were significantly higher in the shallow lakes at all depths than in the deep lakes, with average values varying from 0.41 to 1.12 d-1 in shallow lakes and 0.025 to 0.095 d-1 in deep lakes. First order rate constants for CH4 oxidation increased markedly in the bottom waters of the shallow lakes, showing a maximum of 3.64 d-1 in Lake GTH 112 (Table 2).
Figure 3: Depth profiles of chlorophyll a (chl a) and dissolved organic carbon (DOC) concentrations in deep lakes. Horizontal dashed line corresponds to , the mean depth of the lake.
23
corresponded to a depth within the thermocline at the deep sampling station but dissolved O2 profiles were still roughly orthograde to the lake bottom. Other water column properties at this sampling station (DOC, chl a, CH4 concentration, CH4 oxidation rate and kCH4) showed relatively little variation from the lake surface to the bottom in each lake. However, chl a and DOC concentrations were significantly greater in shallow lakes than in deep lakes, averaging 5.12 versus 0.99 µg L-1 and 540 versus 359 µM, respectively (Table 2), and mean DOC concentrations at showed no relationship with the ratio of catchment area to lake surface area (R2 = 0.03). Similarly, the mean water column CH4 concentration, CH4 oxidation rate, and kCH4, while lower on average in all lakes at than at zmax, were all significantly higher in shallow lakes than in deep lakes, by one or two orders of magnitude (Table 2).
24
Table 2: Mean and (range) of water column concentrations of chlorophyll a (chl a), dissolved organic-C (DOC), and CH4, and mean and
(range) of volume-based and specific (kCH4) rates of CH4 oxidation in study lakes at the deepest point (zmax) and mean depth ( ) of each
lake.
Study Lake zmax Size
Class Chl a (µg L
-1
) DOC (µM)
Volume-based CH4
oxidation rate (µmol L
-1
d-1)
kCH4 (d-1) CH4 (µM)
GTH 99 4.1 Shallow 1.43 (1.12-1.81) 377 (326-393) 0.84 (0.013-4.10) 0.72 (0.016-2.85) 2.14 (0.63-15.5) GTH 112 6.0 - 6.98 (1.78-9.87) 591 (507-632) 7.63 (0.46-43.0) 1.12 (0.355-3.64) 7.96 (0.28-52.6) GTH 114 6.7 - 7.59 (2.98-28.3) 618 (561-665) 4.01 (0.001-21.3) 0.41 (0.001-1.21) 1.24 (0.37-17.9) GTH 100 15.7 Deep 0.91 (0.63-1.67) 374 (336-432) 0.008 (0.0001-0.023) 0.095 (0.001-0.234) 0.18 (0.06-0.32) NE14 18.7 - 0.50 (0.26-0.95) 333 (192-462) 0.005 (0.0001-0.025) 0.025 (0.001-0.139) 0.20 (0.06-0.35) Toolik 26.3 - 1.27 (0.51-2.15) 436 (314-591) 0.009 (0.0001-0.020) 0.061 (0.001-0.137) 0.18 (0.13-0.27)
25
iii. Methanotrophic Bacterial Growth Efficiency and Production
When entire volume-based 14CH4 utilization data were considered, estimates of total CH4 oxidation rates (whole water samples) agreed on average to within 11% of rates
independently estimated by summing values found for 14CH4-C respired (radiolabeled filtrate) and 14CH4-C incorporated into biomass (radiolabeled filter-trapped material). By both measures, CH4 oxidation rates in NE14 were very low, approaching the sensitivity limits of the 14CH4 method, and showed the most variability. Excluding data for NE14, CH4 oxidation rate estimates by the whole water and respiration-biomass summation measures agreed to within 6%.
Percent incorporation of assimilated 14CH4 into biomass, or methanotrophic bacterial growth efficiency (MBGE), varied from 23% to 48%, with the highest value associated with the most uncertainty in NE14 (Table 3). Excluding these data, percent incorporation showed lower lakewise variability, from 23% to 39%. The average growth efficiency for the shallow lakes (33%) was not significantly different from the average growth efficiency in the deep lakes (36%).
Table 3: Whole-lake methanotrophic production estimates and comparisons to area-based phytoplankton primary production estimates for some study lakes
µmol C m-2 d-1
Study Lake Size Class Growth Efficiency (%) Respired-CH4
Biomass-CH4
Total CH4
Oxidation
CH4 oxidation
biomass production as % of phytoplankton primary production
GTH 99 Shallow 39.4 71.3 41.4 112.7 1.1%
GTH 112 - 22.6 977.2 292.2 1269.4 4.6%
GTH 114 - 37.4 256.0 135.8 391.8 1.6%
GTH 100 Deep 28.2 8.2 4.0 12.1 0.08%
NE14 - 48.4 2.2 1.9 4.1 -
26
Depth-integrated rates of biomass production from methanotrophy varied by more than a factor of 100 (Table 3). The lowest rate, 1.9 µmol C m-2 d-1, occurred in NE14, and the highest rate of 292 µmol C m-2 d-1 was observed in GTH 112. The mean rate of 157 µmol C m-2 d-1 for methanotrophic biomass production in the shallow lakes was significantly higher than the mean of 4 µmol C m-2 d-1 for the deep lakes. Prior work has measured whole-lake phytoplankton primary production rates in all study lakes (Miller et al., 1986; Whalen et al., 2006, 2008) except NE14; whole-lake estimates of methanotrophic biomass production correspond to 1 to 5% of these values in shallow lakes, compared to about 0.1% in GTH 100 and Toolik (Table 3).
iv. Radiant Energy and Sediment-Water Gas Exchange
Attenuation coefficients (Kd) for photosynthetically active radiation (PAR) in shallow lakes were significantly greater than deep lake values, averaging 1.26 m-1 compared to 0.43 m-1
(
Table 4). Radiant energy at the sediment surface during deployment corresponded to1.9 to 4.2% of that incident on the lake surface in GTH 112, GTH 114, GTH 100, and Toolik. Much larger proportions of surface-incident PAR penetrated to the sediment surface in GTH 99 and NE14, at 19.8 and 22.3%, respectively. Field irradiance at the sediment surface during deployment was a function of weather conditions, incubation length, and Kd. This quantity was greatest in GTH 99 and NE14 at 4.50 and 5.26 mol photons m-2 d-1,
27
Table 4: Attenuation coefficients for underwater irradiance (Kd), mean lake depth ( ), photosynthetic photon flux density(PPFD) at sediment surface in clear benthic chamber, and percent of lake sediment surface area at or above compensation depth (1% PPFD) for photosynthesis.
Lake Size Class Kd (m) Mean incubation PPFD, (mol
photons m-2 d-1)
% of sediment area at or above 1% PPFD penetration
GTH 99 Shallow 0.77 2.1 4.50 100
GTH 112 - 1.57 2.2 1.12 69
GTH 114 - 1.44 2.2 0.90 81
GTH 100 Deep 0.62 6.4 0.42 54
NE14 - 0.25 6.0 5.26 100
Toolik - 0.46 7.0 0.97 74
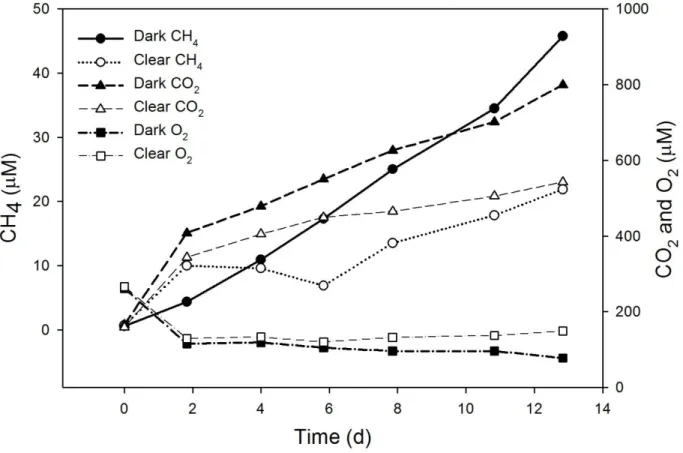
A representative time series of benthic chamber dissolved gas concentrations is shown in Figure 5. In all lakes, both clear and dark benthic chambers showed net dissolved O2 consumption (negative flux). Overall, area-based rates of dissolved O2 loss varied from 0.62 to 3.09 mmol m-2 d-1 in the shallow lakes, and from 0.29 to 2.16 mmol m-2 d-1 in the deep lakes. Dissolved O2 consumption rates were higher in dark chambers than clear chambers in all lakes except GTH 99 and GTH 100. Dissolved O2 consumption rates in GTH 100 were roughly the same in both dark and clear chambers, while in GTH 99
28
Figure 5: Representative (GTH 114) benthic chamber time series for changes in dissolved CH4, CO2,
29
Table 5: Benthic chamber sediment-water exchange rates for O2, CO2, and CH4 (mmol m-2 d-1); estimates of
gross photosynthesis (PS) and predicted dark CO2 flux (mmol m-2 d-1) based on respiratory quotient of 0.85
for aerobic respiration; and comparison of predicted and observed dark chamber CO2 flux. Standard error of
the mean for duplicate dark chambers given in parentheses. Negative values indicate flux into the sediment.
Study Lake Size
Class O2 CO2 CH4
Gross PS
Predicted dark CO2
flux (0.85* Gross PS)
Predicted dark CO2
flux as % of observed GTH 99 Dark Shallow -0.62 (0.17) 6.78 (2.09) 2.02 (0.22) -0.73 1.83 27%
GTH 99 Clear - -1.35 2.45 0.69
GTH 112 Dark - -1.35 (0.10) 8.08 (0.41) 2.37 (0.33) 0.38 6.74 83% GTH 112 Clear - -0.97 6.42 2.48
GTH 114 Dark - -3.09 (0.06) 8.02 (0.29) 0.65 (0.09) 1.19 5.29 66% GTH 114 Clear - -1.90 4.28 0.24
GTH 100 Dark Deep -1.18 (0.12) 2.77 (0.21) 0.007 (0.001) 0.03 1.95 70% GTH 100 Clear - -1.15 1.92 -0.001
NE14 Dark - -1.53 (0.01) 6.62 (0.06) 0.390 (0.011) 1.24 2.96 45%
NE14 Clear - -0.29 1.91 0.002
Toolik Dark - -2.16 (0.22) 6.17 (0.71) 0.383 (0.063) 0.32 4.40 68% Toolik Clear - -1.84 3.72 0.017
All benthic chambers in all lakes showed net CO2 emission (positive flux; cf. Figure 5), with rates of CO2 production greater in the dark chambers than in the clear chamber in each lake (Table 5). Considering all lakes, CO2 efflux was significantly greater in dark chambers, averaging 6.41 mmol m-2 d-1, than in clear chambers, which averaged 3.45 mmol m-2 d-1. The difference between dark and clear chamber CO2 fluxes was significantly greater in the shallow lakes than in the deep lakes. Additionally, dark CO2 production was
significantly higher in the shallow lakes than in deep lakes, averaging 7.63 mmol m-2 d-1 compared to 5.19 mmol m-2 d-1.
Gross photosynthesis in the clear benthic chamber during incubation was
30
CO2 flux in the clear chamber, asssuming a RQ (molar ratio of CO2 produced to O2 consumed) of 0.85 for aerobic decomposition (Boyd, 1973; Hanson and Tenore, 1981). These predicted dark chamber CO2 accumulation rates were 45 to 83% of observed dark chamber CO2 production in all study lakes except GTH 99, where the predicted rate was 27% of the observed due to greater O2 depletion in the clear chamber than the dark chambers (Table 5).
There was a net accumulation of CH4 in all benthic chambers in all lakes (cf. Figure 5) except for the clear chamber in GTH 100 where essentially no flux was observed (Table 5). However, CH4 emitted from the sediment was subject to oxidation in the
31
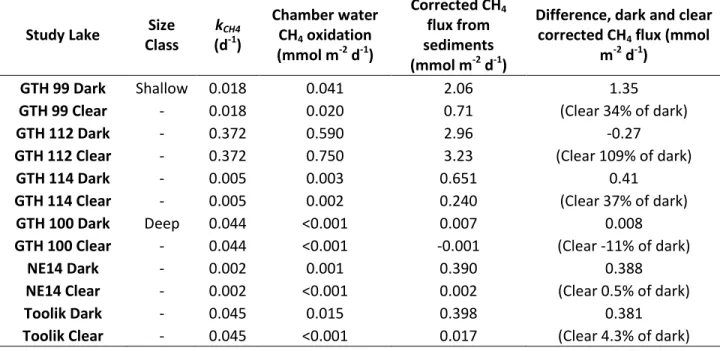
Table 6: Specific (kCH4) rates of CH4 oxidation at depth of benthic chamber deployment ( ), CH4 oxidation
rates in benthic chamber water and corrected CH4 flux from sediments (mmol m-2 d-1), and comparison of
corrected CH4 fluxes between dark and clear chambers.
Study Lake Size Class
kCH4
(d-1)
Chamber water CH4 oxidation
(mmol m-2 d-1)
Corrected CH4
flux from sediments (mmol m-2 d-1)
Difference, dark and clear corrected CH4 flux (mmol
m-2 d-1)
GTH 99 Dark Shallow 0.018 0.041 2.06 1.35
GTH 99 Clear - 0.018 0.020 0.71 (Clear 34% of dark)
GTH 112 Dark - 0.372 0.590 2.96 -0.27
GTH 112 Clear - 0.372 0.750 3.23 (Clear 109% of dark)
GTH 114 Dark - 0.005 0.003 0.651 0.41
GTH 114 Clear - 0.005 0.002 0.240 (Clear 37% of dark) GTH 100 Dark Deep 0.044 <0.001 0.007 0.008 GTH 100 Clear - 0.044 <0.001 -0.001 (Clear -11% of dark)
NE14 Dark - 0.002 0.001 0.390 0.388
NE14 Clear - 0.002 <0.001 0.002 (Clear 0.5% of dark)
Toolik Dark - 0.045 0.015 0.398 0.381
Toolik Clear - 0.045 <0.001 0.017 (Clear 4.3% of dark)
Corrected sediment-water CH4 fluxes were significantly larger in dark chambers than in the clear chambers except in GTH 112 and GTH 100, where fluxes were similar for all chambers. Excluding these data, clear chamber CH4 fluxes corresponded to an average of 19% of dark chamber fluxes. Rates of CH4 exchange in deep lake clear chambers averaged 0.01 mmol m-2 d-1, significantly lower than the 1.39 mmol m-2 d-1 observed in the shallow lakes. Similarly, dark chamber CH4 fluxes were significantly higher in the shallow lakes, at 1.89 mmol m-2 d-1 on average compared to a mean of 0.27 mmol m-2 d-1 in the deep lakes.
32
Methane accounted for 20% of sediment catabolism on average in the shallow lakes,
significantly higher than the mean of 2% in the deep lakes (Table 7). Considering all benthic chambers, corrected sediment-water CH4 flux was significantly correlated (R2 = 0.40) with C sedimentation rates given in Bretz (2012).
Table 7: Net sediment inorganic C flux (mmol m-2 d-1) and percent contribution of CH4 to inorganic C flux
Study Lake Inorganic C Flux (CH4 + CO2) CH4 % of Inorganic C Flux
GTH 99 Dark 8.8 23.3
GTH 99 Clear 3.2 22.5
GTH 112 Dark 11.0 26.8
GTH 112 Clear 9.7 33.5
GTH 114 Dark 8.7 7.5
GTH 114 Clear 4.5 5.3
GTH 100 Dark 2.8 0.3
GTH 100 Clear 1.9 0.0
NE14 Dark 7.0 5.6
NE14 Clear 1.9 0.1
Toolik Dark 6.6 6.1
Toolik Clear 3.7 0.5
v. Stagnant film model of CH4 emission to atmosphere
33
chamber CH4 fluxes were positively related to maximum estimated CH4 evasion from the lake surface (R2 = 0.76).
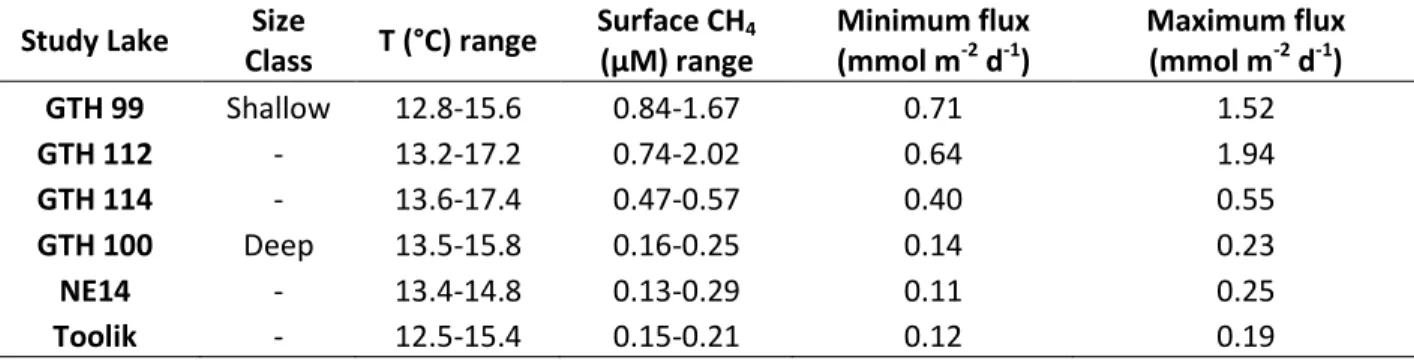
Table 8: Stagnant film model-estimated lake CH4 emissions, with surface temperatures and CH4
concentrations. Study Lake Size
Class T (°C) range
Surface CH4
(µM) range
Minimum flux (mmol m-2 d-1)
Maximum flux (mmol m-2 d-1) GTH 99 Shallow 12.8-15.6 0.84-1.67 0.71 1.52
GTH 112 - 13.2-17.2 0.74-2.02 0.64 1.94
GTH 114 - 13.6-17.4 0.47-0.57 0.40 0.55
GTH 100 Deep 13.5-15.8 0.16-0.25 0.14 0.23
NE14 - 13.4-14.8 0.13-0.29 0.11 0.25
IV. DISCUSSION AND CONCLUSIONS
i. Water Column Studies
Overall, differences between the deep and the shallow lakes in water column
35
In oligotrophic lakes, phytoplankton production and watershed inputs are the
dominant contributors to DOC concentrations (Wetzel, 2001). In Arctic lakes, allochthonous inputs are highest during the spring thaw due to elevated runoff, while autochthonous
production increases in significance later in the summer (Whalen and Cornwell, 1985), when most field sampling was performed. As with chl a, DOC concentrations were significantly higher in shallow lakes, suggesting greater overall productivity. Measured concentrations of DOC (192 to 665 µM) were similar to others reported for lakes in the Arctic Foothills region, which center around 400 to 500 µM (Whalen and Cornwell, 1985; Kling et al., 2000; Crump et al., 2003), and comparable to the lower end of literature values for temperate, boreal, and sub-Arctic lakes (Howard et al., 1971; Chau et al., 1977; Fallon et al., 1980; Mattson and Likens, 1993; Michmerhuizen et al., 1996; Bastviken et al., 2002; Bastviken et al., 2004), which show values varying from 150 to 1800 µM. The decoupling of drainage size and DOC content, together with the high degree of homogeneity in vegetation between study lake drainages, suggests that elevated DOC in shallow lakes may have been related to
autochthonous sources. Kling et al. (2000) noted a similar lack of relationship between DOC and catchment area in a chain of small lakes in the study area.
36
Arctic similar observations of CH4 accumulation in O2-depleted hypolimnia of natural and human-impacted lakes in sub-Arctic to temperate regions, which generally show
hypolimnetic CH4 concentrations of 30 to 80 µM (Rudd and Hamilton, 1978; Harrits and Hanson, 1980; Lilley and Baross, 1988; Liu et al., 1996; Bastviken et al., 2002; Kankaala et al., 2006).
Remarkably, volume-based rates of CH4 oxidation varied over five orders of magnitude (Table 2). In accord with CH4 concentrations, CH4 oxidation rates of <0.001 to 0.025 umol L-1 d-1 in the deep lakes compare favorably to the lowest values reported. These vary from <0.001 to 0.144 µmol L-1 d-1 in lakes of varying trophic status and latitudes (Lilley and Baross, 1988; Utsumi et al., 1998a&b; Bastviken et al., 2002; Bastviken et al., 2004; Sundh et al., 2005; Kankaala et al., 2006). On the other hand, the CH4 oxidation rates of up to 43 µmol L-1 d-1 in the shallow lakes exceeded rates of about 0.5 to 5 µmol L-1 d-1 (Welch et al., 1980) in a CH4-fertilized Canadian Arctic lake, and surpassed the highest observed rates of about 17 to 30 µmol L-1 d-1 in eutrophic north-temperate and sub-Arctic lakes (Rudd and Hamilton, 1975; Harrits and Hanson, 1980).
37
Collectively, remarkably high summer concentrations of hypolimnetic CH4 in waters characterized by a short ice-free season and intermittent circulation, and correspondingly high values for CH4 oxidation and kCH4, indicate the importance of CH4 in carbon cycling in the water columns of shallow Arctic Foothills lakes.
ii. Methanotrophic Bacterial Growth Efficiency and Methanotrophic Production
Methanotrophic bacterial growth efficiency ranged from 23 to 48% (Table 3), with no difference between shallow and deep study lakes. King (1993) reported that MBGE in aquatic environments varied between 15 and 80%, and Bastviken et al. (2003) found a similar range, 6 to 77%, in boreal lakes of varying trophic status; MBGE values measured in this study fall within this range, but were somewhat more constrained, suggesting similar methanotrophic consortium and kinetics across all study lakes. Growth efficiencies similar to those found here indicate dominance by Type II methanotrophs (Auman et al., 2000).
The average area-based CH4 oxidation rate of 0.591 mmol m-2 d-1 for shallow lakes was significantly higher than the average of 0.012 mmol m-2 d-1 for deep lakes (Table 3), despite the depth difference (Table 1). Nonetheless, for all study lakes, area-based rates of CH4 oxidation were similar to the lowest previously observed, which show a generalized decrease with increasing latitude. Reported areal rates of CH4 oxidation range to 20 mmol m -2
38
compensate for reduced hypolimnetic volume, resulting in low area-based rates of CH4 oxidation in waters of Arctic Foothill lakes.
Area-based estimates of methanotrophic biomass production in shallow lakes
corresponded to 1 to 5% of phytoplankton production, compared to about 0.1% in deep lakes (Table 3), again pointing to a greater role for CH4 in C cycling in shallow lakes than in deep lakes. Percentages similar to those calculated for the shallow lakes, 0.3 to 7%, were reported for boreal lakes of variable productivity by Bastviken et al. (2003), while a higher range, 5 to 10%, was found by Kankaala et al. (2006) for a highly humic boreal lake. The relative importance of CH4 as a potential energy source for pelagic food webs in these lakes appears to be roughly similar to benthic food webs, as Bretz (2012) found that methanotrophic biomass production was 1.2 to 6.3% of epipelic primary production.
Compared to the deep study lakes, the shallow lakes have a thinner oxic water column into which CH4 diffusing upward from the sediments can be attenuated by
methanotrophs. Nonetheless, the shallow lakes exhibited significantly greater volume-based, areal, and specific CH4 oxidation rates. Combined with the larger lake-surface CH4
39
iii. Sediment-Water Exchanges and the Role of Radiant Energy
Dissolved O2 concentrations in the benthic chambers declined slowly, and
approached the levels of depletion observed in the hypolimnia of the shallow lakes (<50 µM) only in GTH 112. Still, all lake sediments showed net O2 consumption under clear benthic chambers at , indicating that the sediments were net heterotrophic. The range of benthic O2 depletion rates observed here (Table 5) borders, and frequently falls short of, the low end of literature values of 1.6 to 32 mmol m-2 d-1 compiled by Pace and Prairie (2005) for lake sediments worldwide, pointing to the oligotrophic nature of lakes in the study region.
The lack of correlation between O2 flux in the clear chambers and either epipelic chl a or field irradiance at the sediment surface further points to the complexity of factors influencing dissolved O2 exchange at the sediment-water interface. Nonetheless, the higher rate of O2 consumption in the clear chamber than in the dark chambers in GTH 99 reported here is abstruse. Sediment oxygen demand results from aerobic respiration as well as oxidation of reduced chemical species such as Fe2+ and Mn2+ diffusing upward from anaerobic regions of the sediment to oxic zones. Sediment particles and interstitial water contain reduced chemical constituents, and it is feasible that chamber deployment disturbed the sediments enough to enhance O2 consumption in the light chamber of GTH 99 by mobilizing such species (e.g. Adams et al., 1982).
Rates of benthic CO2 production measured in my dark chambers are comparable to the low-end values reported for other studies utilizing dark sediment core and benthic chamber incubations, while my clear chamber values are among the lowest observed.
40
1988; Hedin, 1990; Pulliam, 1993; Therkildsen and Lomstein, 1993; Ramlal et al., 1993). Ramlal et al. (1994) observed much higher rates of sediment respiration than those reported here in a shallow Canadian arctic lake, up to 47 mmol CO2 m-2 d-1, possibly related to the 80% macrophyte cover of sediments in that lake. Overall, the low rates of CO2 accumulation in benthic chambers further emphasize the oligotrophic status of the study lakes.
Oligotrophic systems are frequently considered to be dominated by aerobic decomposition (Holmer and Storkholm, 2001). The magnitude of excess CO2 production beyond that predicted by aerobic respiration reflects the relative importance of anaerobic respiratory pathways (Pace and Prairie, 2005). Excluding GTH 99, expected dark chamber CO2 fluxes based on O2 consumption data were only 45 to 83% of observed values (Table 5). This suggests an important role for anaerobic pathways in sediment catabolism in these lakes. Methanogenesis is clearly important in the study lakes (Bretz, 2012). Other anaerobic
41
samples would be needed to make quantitative statements about these processes in the study lakes.
Arctic Foothills lakes are oligotrophic, with relatively shallow mean depths and high catchment area : lake area ratios, suggesting that their biogeochemical cycles may be driven by allochthonous inputs. However, sediment C mineralization and sediment-water CH4 exchange here appear to be heavily influenced by autochthonous inputs, and the effect is magnified in shallow relative to deep lakes. The C:N ratios of sedimenting material were similar to those of phytoplankton biomass (Bretz, 2012), indicating dominance by
autochthonously produced material. Water column chl a concentrations (an index of
phytoplankton biomass) were higher in the shallow lakes, and overall were positively related (R2 = 0.60) to rates of C sedimentation. Rates of C sedimentation were also significantly higher in the shallow lakes, averaging 7.5 mmol m-2 d-1, compared to 0.6 mmol m-2 d-1 in the deep lakes (Bretz, 2012). Furthermore, across all lakes, corrected clear chamber CH4 fluxes correlated positively (R2 = 0.40) to C sedimentation rates.
42
inverse relationship (R2 = 0.70) with the extent of the surficial oxic sediment layer (Figure 6), as has been reported for mesotrophic and eutrophic north-temperate and boreal lakes (Frenzel et al., 1990; Sweerts et al., 1991; Huttunen et al., 2006). Corrected CH4 flux in the dark chambers significantly exceeded that in the clear chambers, likely due to decreased oxidized microzone thickness in the dark chambers during incubation. Oremland (1975) observed a similar discrepancy between clear and dark benthic chamber CH4 fluxes in shallow, tropical marine waters.
Figure 6: Relationship between corrected clear chamber sediment-water CH4 exchange rate and
vertical extent of surficial oxic sediment. Oxic layer thickness from Bretz (2012).
43
epipelic photosynthesis may not always exceed community respiration (see above), but some O2 is generated to offset respiratory activity and reduce CH4 emission from the sediments.
The indirect effect of light on sediment CH4 flux plays a unique role in arctic lakes, whose light regime is defined on a yearly, rather than diurnal, basis, with a continuous summer photoperiod, and no influx of radiant energy for roughly 9 months per year due to ice cover. Clear chamber CH4 fluxes reflect typical summer conditions, while dark chamber CH4 fluxes, which were significantly higher considering all data, may be similar to those that occur in the winter. As the sediment oxidized microzone diminishes in thickness, CH4 flux from the sediment may increase and CH4 could accrue in the ice-capped water column rather than diffusing to the atmosphere. This may lead to a large pulse of CH4 from the lake during turnover after spring thaw. The importance of such storage fluxes has been established in boreal and temperate lakes (Strayer and Tiedje, 1978; Fallon et al., 1980; Michmerhuizen et al., 1996; Striegl and Michmerhuizen, 1998; Utsumi et al., 1998 a&b; Casper et al., 2000; Bastviken et al., 2002; Huttunen et al., 2003; Bastviken et al., 2004).
iv. Evasion of CH4 from the Lake Surface
For the duration of benthic chamber deployment, average estimated wind speeds were similar for all lakes and maximum and minimum observed temperatures over the entire sampling period were not significantly different between shallow and deep lakes. Therefore, stagnant film model-estimated CH4 emissions depended primarily on surface CH4
44
average of 0.22 mmol m-2 d-1 for deep lakes is somewhat lower. Shallow lake CH4 fluxes are also very similar to the mean of 1.3 mmol m-2 d-1 observed by Whalen and Reeburgh (1990) in Arctic Alaska ponds, but Bartlett et al. (1992) found greater CH4 emissions than any observed here, averaging 4.8 mmol m-2 d-1, in small (<10 km2) lakes with emergent
macrophytes in the Yukon-Kuskokwim delta. Large (>10 km2) lakes in the same study had CH4 effluxes centering around 0.24 mmol m-2 d-1, very similar to those observed here for deep lakes Globally, shallow lake values compare well even to diffusive CH4 fluxes reported for tropical lakes (about 1.1 mmol m-2 d-1; Barlett et al., 1988; Devol et al., 1988; Boon and Mitchell, 1995), but here only apply for the brief ice-free season.
Considering all data, predicted CH4 emissions from the study lakes compare
favorably to the low end of CH4 fluxes reported for terrestrial tundra environments in Alaska, which are as high as about 10 mmol m-2 d-1 during the thaw season, but average between <0.1 and 3.3 mmol m-2 d-1 (Whalen and Reeburgh, 1988, 1990a, 1992). The highly oxic water columns of Arctic lakes appear to effectively attenuate CH4 emitted from the sediments, often leading to lower emissions from the lake surface than from soils in the surrounding tundra environments, where diffusing CH4 must transit a less extensive oxic zone overlying the zone of CH4 production. Notably, maximum estimated fluxes of CH4 from the shallow lakes are very similar to the average range reported for Alaskan Arctic tundra, suggesting that rates of methanogenesis in the smallest lakes in the region are
sufficient to overcome the effects of water column oxidation. Corrected clear chamber CH4 fluxes were significantly related to maximum estimated CH4 evasion from the lake surface (R2 = 0.76), suggesting that water column methanotrophy is unable to completely
45 v. Methane Mass Balance
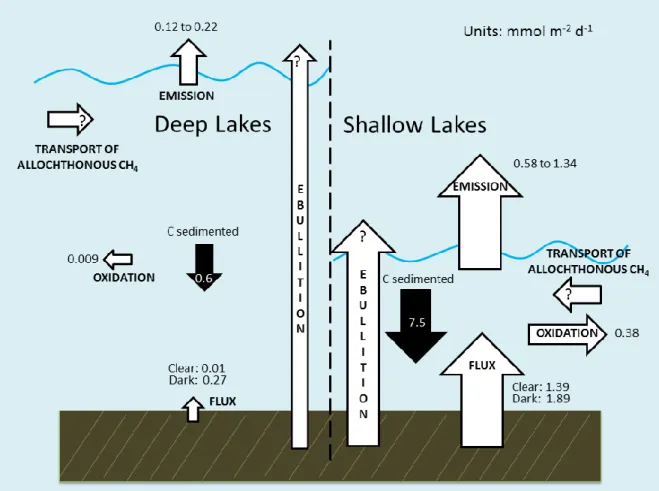
My entire data can be combined into a conceptual model of summer CH4 cycling dynamics in Arctic Foothill lakes, incorporating the sediments as a CH4 source, with water column oxidation and surface evasion as sinks (Figure 7). The results of a simple, arithmetic mass balance are shown in Table 9. Considering both the minimum and the maximum predicted rates of CH4 evasion to the atmosphere, all study lakes besides GTH 112 showed CH4 mass balances <0, that is, CH4 emissions were greater than implied by flux from the sediments and consumption in the water column. Kling et al. (1992) encountered a similar phenomenon in their study of CH4 concentrations and emissions in surface waters from the same region, and suggested that groundwater flow imported significant CH4, subsidizing emissions. This likely accounts for the excess CH4 emission to the atmosphere in most study lakes. The lone exception was GTH 112, where 7% to 47% of clear chamber sediment CH4 flux was unaccounted for by the mass balance as currently framed. Only one clear chamber was deployed in each lake; however, two dark chambers were deployed, with replicate
46
Figure 7: Conceptual model of CH4 cycling dynamics in shallow and deep Arctic Foothill lakes.
Arrows depicting sources and sinks and are sized to represent their approximate relative magnitude.
Ebullition is estimated to contribute 40-60% of total lake CH4 emissions in some instances (Bastviken et al., 2004). Walter et al. (2006, 2008) and others (e.g. Zimov et al., 1997) have shown that CH4 ebullition from Arctic lakes is a significant source of natural CH4 to the atmosphere, and can account for as much as 95% of annual CH4 emission from Arctic lakes. However, benthic chambers have a small footprint and ebullition is spatially
47
48
Table 9: Mass balance of CH4 for study lakes and mean CH4 mass balances for size classes. All units are mmol m-2 d-1.
Study
Lake Size Class
Corr. clear sed.
CH4 flux
Water col. CH4 ox.
Min. est. surface emission
Max. est. surface emission
% Sed. CH4
flux oxidized in
water col.
% CH4 flux
Emitted
Max. balance
Min. balance
% Sed. CH4
flux unaccounted
for GTH 99 Shallow 0.71 0.05 0.71 1.52 7 100-214 -0.05 -0.86 0
GTH 112 - 3.23 1.08 0.64 1.94 33 20-60 1.51 0.21 7 to 47
GTH 114 - 0.24 0.007 0.40 0.55 3 167-229 -0.17 -0.32 0
GTH 100 Deep -0.001 0.011 0.14 0.23 - - -0.15 -0.24 0
NE14 - 0.002 0.001 0.11 0.25 50 5500-12500 -0.11 -0.25 0
Toolik - 0.030 0.014 0.12 0.19 47 400-633 -0.10 -0.17 0
Size Class
Shallow Mean 1.39 0.38 0.58 1.34 27 42-96 0.43 -0.32 0-31
49 vi. Summary and Conclusions
Arctic Foothills lakes show marked contrasts in C cycling characteristics when subdivided by size. Deep lake values for CH4 concentration, water column CH4 oxidation rates, sediment CH4 emission, and surface evasion of CH4 are similar to the lowest reported globally, while shallow lake values are often similar to those reported for lower latitude lakes of higher trophic status. Thus, CH4 plays a more significant role in shallow Arctic lakes, both in their internal food web dynamics and in their contribution to the atmospheric CH4 budget and climate change. All aspects of the CH4 cycle in these systems appear to be strongly tied to autochthonous production in both the water column and epipelon.
50
My data show that CH4 oxidation is an important component of C cycling in Alaskan Arctic lakes, particularly shallow ones, and kCH4 in shallow lake bottom waters in particular were extremely high. This suggests that water column communities of methanotrophs could be capable of mitigating future increases in sediment CH4 flux. However, air-water CH4 exchanges were strongly correlated to sediment CH4 fluxes, indicating that the sediment CH4 signal survived to the surface despite significant CH4 oxidation activity. Therefore, lake surface CH4 effluxes may increase proportionally with sediment CH4 fluxes in a warming climate. This analysis excludes CH4 emission via ebullition, which is expected to increase due to pervasive permafrost thaw (Zimov et al., 2005; Walter et al., 2006, 2008).