LCP NANOPARTICLE FOR TUMOR AND LYMPH NODE METASTASIS
IMAGING
Yu-Cheng Tseng
A dissertation submitted to the faculty of the University of North Carolina at Chapel Hill in partial fulfillment of the requirements for the degree of Doctorate of Philosophy in the Department of Molecular Pharmaceutics, Eshelman School of Pharmacy.
Chapel Hill 2013
ABSTRACT
YU-CHENG TSENG: LCP Nanoparticle for Tumor and Lymph Node Metastasis Imaging (Under the direction of Dr. Leaf Huang)
A lipid/calcium/phosphate (LCP) nanoparticle formulation (particle diameter
~25 nm) has previously been developed to delivery siRNA with superior efficiency. In
this work,
111In was formulated into LCP nanoparticles to form
111In-LCP for
SPECT/CT imaging. With necessary modifications and improvements of the LCP
core-washing and surface-coating methods,
111In-LCP grafted with polyethylene
glycol exhibited reduced uptake by the mononuclear phagocytic system. SPECT/CT
imaging supported performed biodistribution studies, showing clear tumor images
with accumulation of 8% or higher injected dose per gram tissue (ID/g) in
subcutaneous, human-H460, lung-cancer xenograft and mouse-4T1, breast cancer
metastasis models. Both the liver and the spleen accumulated ~20% ID/g.
Accumulation in the tumor was limited by the enhanced permeation and retention
effect and was independent of the presence of a targeting ligand. A surprisingly high
accumulation in the lymph nodes (~70% ID/g) was observed. In the 4T1 lymph node
metastasis model, the capability of intravenously injected
111In-LCP to visualize the
size-enlarged and tumor-loaded sentinel lymph node was demonstrated. By
analyzing the SPECT/CT images taken at different time points, the PK profiles of
111
In-LCP in the blood and major organs were determined. The results indicated that
Larger LCP (diameter ~65 nm) nanoparticles were also prepared for the
purpose of comparison. Results indicated that larger LCP achieved slightly lower
accumulation in the tumor and lymph nodes, but much higher accumulation in the
liver and spleen; thus, larger nanoparticles might not be favorable for imaging
purposes. We also demonstrated that LCP with a diameter of ~25 nm were better
able to penetrate into tissues, travel in the lymphatic system and preferentially
accumulate in the lymph nodes due to 1) small size, 2) a well-PEGylated lipid
surface, and 3) a slightly negative surface charge. The ability of ~25 nm LCP to
deliver genes to the lymph nodes via IV injection was illustrated by RFP cDNA
expression. The results promise the potential use of LCP nanoparticles as
formulations for the multifunctional, systemic delivery of both imaging and
ACKNOWLEDGEMENTS
TABLE OF CONTENTS
LIST OF TABLES ... x
LIST OF FIGURES ... xi
LIST OF ABBREVIATIONS AND SYMBOLS ... xiii
CHAPTER I ... 1
INTRODUCTION ... 1
1.1 Clinical tumor imaging ... 1
1.2 SPECT/CT (Single-photon emission computed tomography) ... 2
1.3 Nanoparticles for therapy and imaging ... 3
1.3.1 MPS clearance and PEGylation ... 4
1.3.2 Enhanced permeability and retention (EPR) effect ... 5
1.3.3 Targeting ligands ... 6
1.3.4 Anisamide and folic acid as targeting ligands ... 6
1.3.5 Radiolabeling of Nanoparticles with 111In ... 7
1.4 LCP (lipid/calcium/phosphate) nanoparticles ... 8
CHAPTER II ... 12
FORMULATING 111IN INTO LCP NANOPARTICLE FORMULATION ... 12
2.1 Introduction ... 12
2.2 Adjusting CaCl2 and Na2HPO4 concentrations for 111In loading ... 13
2.3 The preparation of 111In-LCP cores... 15
2.6 Characterizing LCP nanoparticles ... 22
2.6.1 Size and zeta-potential measurement by dynamic light scattering ... 22
2.6.2 Determine oligo entrapping efficiency with 3H-labeled DNA oligo ... 23
2.6.3 Determine 111In entrapping efficiency ... 24
2.6.4 Determine calcium/phosphate ratio in the LCP core ... 24
2.6.5 Conclusions ... 24
2.7 How does the cell manage calcium toxicity? ... 25
2.7.1 Design of in vitro Fura-2 experiment ... 26
2.7.2 Results and discussion ... 27
2.7.3 Evaluating LCP induced Ca2+ toxicity in vivo with Ca2+ pump inhibitors ... 29
2.7.4 Conclusion ... 31
CHAPTER III ... 33
SPECT/CT IMAGING AND LCP PHARMACOKINETICS STUDY ... 33
3.1 In vivo H460 xenograft tumor imaging ... 33
3.1.1 SPECT/CT imaging protocol ... 33
3.1.2 Results and discussion ... 34
3.2 LCP pharmacokinetics profile study from both SPECT/CT and organ dissections ... 36
3.2.1 PK study from organ dissections ... 36
3.2.2 Compare S-LCP and L-LCP NPs for tumor imaging ... 38
3.2.3 Validate 111In labeling of LCP NPs with 3H-labeled oligo 39 3.2.4 Pharmacokinetics study from SPECT/CT image analysis ... 39
3.3 Can ligands improve the accumulation level of NP in the tumor? ... 41
3.4.1 Tumor blood vessel staining with CD31 ... 43
3.4.2 Demonstration of EPR effect with Evans Blue ... 44
3.4.3 Discussion ... 46
3.5 In vivo lymph node metastasis imaging with 4T1 model ... 47
3.5.1 Establishing 4T1 metastasis model ... 47
3.5.2 Monitoring 4T1 lymph node metastasis ... 48
3.5.3 Imaging lymph node metastasis ... 48
3.5.4 Discussion ... 50
CHAPTER IV ... 51
LCP LYMPHOTROPISM STUDY ... 51
4.1 Introduction ... 51
4.2 Accumulation of S-LCP in the lymph nodes ... 53
4.3 Hypothesis for LCP NP lymphotropism ... 55
4.4 S-LCP NPs was more tissue penetrating... 56
4.4.1 Experimental design ... 56
4.4.2 Results and discussions ... 56
4.5 Different distribution pattern of S-LCP and L-LCP in the draining lymph node ... 58
4.5.1 Experimental design ... 59
4.5.2 Results and discussions ... 59
4.6 PEG coating for S- and L-LCP ... 61
4.7 Intraperitoneal injection of LCP NPs ... 63
4.7.1 Discussions ... 65
4.8 In vivo lymph node gene delivery with LCP NPs... 65
4.8.1 Experimental design ... 66
4.9 Conclusions and discussions ... 68
CHAPTER V ... 70
DISCUSSIONS AND FUTURE PERSPECTIVES ... 70
5.1 Potential of S-LCP as a theranostic formulation for delivery to the lymphatic system ... 70
5.2 LCP as a drug delivery system for water-insoluble drugs ... 71
5.3 LMnP as MR imaging contrast agents ... 72
5.3.1 Making LMnP cores ... 72
5.3.2 Preliminary demonstration of S-LMnP as MR imaging contrast agent ... 73
APPENDIX ... 75
LIST OF TABLES
LIST OF FIGURES
Figure 1.1 Cartoon illustration of LCP NP preparation. ... 9
Figure 1.2 Cartoon illustration of the drug releasing mechanisms of LCP NP. ... 11
Figure 2.1 Improved biodistribution pattern of S-LCP after cyclohexane wash. ... 18
Figure 2.2 Purify LCP NPs using sucrose gradient centrifugation. ... 19
Figure 2.3 TEM images of LCP NPs ... 21
Figure 2.4 TEM images of LCP core made with Igepal system/Triton system = 1/7 in water bath at 65°C. ... ... 22
Figure 2.5 Calcium pumps are important for Ca2+ toxicity management ... 28
Figure 2.6 In vivo necrosis induced by LCP with Ca2+ pump inhibitors ... 30
Figure 2.7 Cartoon illustration of the Ca2+ removing mechanism after LCP dosing ... 32
Figure 3.1 SPECT/CT images at three time points post IV injection. ... 35
Figure 3.2 LCP biodistribution results from organ dissention ... 38
Figure 3.3 PK analysis from the SPECT/CT images using Amide software. ... 40
Figure 3.4 Ligand effects on LCP NP biodistribution and tumor accumulation ... 42
Figure 3.5 Younger tumor had more disorganized blood vessels. ... 44
Figure 3.6 Younger tumor had higher EPR effect. ... 46
Figure 3.7 Imaging 4T1 lymph node metastasis. ... 49
Figure 4.1 Accumulation of S-LCP-DOPC with 20% PEGylation in the lymph nodes of nude mice. ... 53
Figure 4.2 Accumulation of S-LCP-DOPC with 20% PEGylation in the lymph nodes of C57BL/6 mice. ... 54
Figure 4.3 IM injection experiments showing that S-LCP NPs is more tissue penetrating than L-LCP NPs ... 57
Figure 4.5 Evaluation of the effect of PEGylation on S- and L-LCP-DOPC NPs. ... 62
Figure 4.6 Administering LCP NPs by IP injection ... 64
Figure 4.7 Gene delivery to the lymph node by IV injection ... 67
Figure 5.1 TEM images of LMnP cores ... 73
LIST OF ABBREVIATIONS AND SYMBOLS
111In Indium-111
CaP Calcium-Phosphate
CT Computed tomography
DLS Dynamic light scattering DOPA Dioleoylphosphatydic acid DOPC Dioleoylphosphatidylcholine
DOTA 1,4,7,10-tetraazacyclododecane-1,4,7,10-tetraacetic acid DOTAP 1,2-dioleoyl-3-trimethylammonium-propane
DSPE-PEG2000
1,2-distearoyl-sn-glycero-3-phosphoethanolamine-N-poly(ethylene glycol)2000
DTPA Diethylene triamine pentaacetic acid EPR effect Enhanced permeation and retention effect
ER Endoplasmic reticulum
EtOH Ethanol
FOV Field of view
ICP-MS Inductively coupled plasma mass spectrometry ID/g Injected dose per gram tissue
IM Intramuscular
IP Intraperitoneal
IT Intratumoral
IV Intravenous
LCP Lipid/calcium/phosphate
LPD Lipid/protamine/DNA
NBD-PC
1-oleoyl-2-[12-[(7-nitro-2-1,3-benzoxadiazol-4-yl)amino]has beendodecanoyl]-sn-Glycero-3-Phosphocholine
NP Nanoparticle
PDI Polydispersity index PEG Polyethylene glycol
PET Positron emission tomography
PK Pharmacokinetics
PMCA Plasma membrane Ca2+ pumps ROIs Region of interests
CHAPTER I
INTRODUCTION
11.1 Clinical tumor imaging
Accurate and sensitive imaging of tumors and lymph node metastasis is important to the early clinical diagnosis and monitoring of therapeutic effects. During the past 20 years, advances in many basic sciences including chemistry, biology, physics, and engineering have made molecular imaging an autonomous scientific discipline that has extensive impact on clinical healthcare practices. Biomedical imaging is actually 2playing an ever more important role in almost every phase of clinical cancer management [1-3]. These include cancer detection, staging [4], prognosis prediction [5], therapy planning [6], imaging-guided surgery [7, 8], therapy response evaluation [9], recurrence monitoring [10], etc. Many imaging techniques have the great advantage of being non-invasive, thus no surgery is required to obtain invaluable images. Current imaging systems frequently used in the clinic include magnetic resonance imaging (MR imaging), single-photon emission computed tomography (SPECT), positron emission tomography (PET), ultrasound, optical imaging, and X-ray systems, including computed tomography (CT).
1
Parts of the introduction included in this chapter have been published in:
Tseng YC, Mozumdar S, and Huang L. (2009). Lipid-based systemic delivery of siRNA. Adv Drug Deliv Rev. Jul 25;61(9):721-31.
These imaging systems vary in several physical properties such as sensitivity, temporal, and spatial resolution [11]. Nuclear medicine techniques, in particular, PET and SPECT, are the most sensitive achieving sensitivity between nanomole/kg and picomole/kg sensitivity and a resolution of ~1 mm. MR imaging has ~10 mmole/kg sensitivity and a resolution of up to ~50 micron (with a strong magnet). However, a major drawback of MRI is it could take hours of acquisition times to obtain a high resolution image. CT has millimole/kg sensitivity with a high resolution of up to several microns.
Optical imaging has great resolution but their clinical application have been limited to endoscopic, catheter-based devices and superficial imaging due to problems with scattering and absorption by the body tissues. However, success of optical imaging has been demonstrated in aiding surgical resection of tumor nodules [7, 8]. The tissue penetrating depth of fluorescent imaging could be improved to several millimeters by using long wavelength fluorophores or nanomaterials with excitation/emission wavelengths within the first or second near-infrared regions (0.75-0.9 µm, 1.1-1.4 µm, respectively) [12-16]. Two-photon excitation is another available technology that could be applied to enhance the penetrating depth of lights [17, 18]. Adopting Raman spectroscopy with tumor targeted nanoparticles and other promising strategies are the future directions of the field [19-21]. However, in terms of non-invasive deep tissue imaging, the capability of optical imaging is still limited.
1.2 SPECT/CT (Single-photon emission computed tomography)
only surpassed by 99mTc. 111In displays major decay at photon energy levels of 171.3 and 245.4 keV, within the ideal range of the detector device. The short, but sufficient half-life of 111In (2.83 days) is also advantageous because prolonged exposure of normal organs to the radionuclide may cause undesired toxicity and should be prevented. Many studies have demonstrated in vivo imaging of tumors using SPECT/CT or PET/CT technique with various types of NPs [23-26].
SPECT has fairly good resolution of ~1 mm. However, SPECT images alone lack the anatomical details to provide meaningful surgical guidance. Several publications have demonstrated the advantages of fusing SPECT images with separately acquired CT images to address this issue [27-33]. Thus SPECT imaging machines have been commonly outfitted with a CT scanning component to form SPECT/CT imaging. Hybrid imaging systems could provide more detailed anatomical information, making them the future of molecular imaging [34].
1.3 Nanoparticles for therapy and imaging
(Lipid/Polycation/DNA) [36-39] and LCP (Lipid/Calcium/Phosphate) NPs [40-42] developed in our lab). In addition to these, the oncological applications of carbon nanotubes and nanodiamonds as novel materials have also been explored [43-45].
The high payload of the therapeutic agent and favorable pharmacokinetics and consequent reduced toxicity of the cargo drug are two advantages of using NPs as a delivery system. Furthermore, their multi-functionality [24], preferential accumulation in the tumor through the enhanced permeability and retention (EPR) effect [46, 47], and the enhanced binding with target cells due to ligand multivalency [48] are also advantages of this type of delivery system. Chapter 1.3.2-1.3.4 introduces the EPR effect and targeting ligands. With the capability of being multifunctional, NPs could carry therapeutics with contrast imaging agents (i.e., theragnostics) [49]. Also, due to their larger-size, NPs can often produce high signal:background ratios, which is the key to achieving satisfactory imaging results. However, avoiding clearance by the mononuclear phagocyte system (MPS), especially in the liver (Kupffer cells) [50] and spleen, is the first requirement for efficient delivery with NPs.
1.3.1 MPS clearance and PEGylation
to use surface grafted carbohydrate or polyethylene glycol (PEG) to protect the particle and shield the particle’s surface charges [52]. Studies have shown that PEGylated colloids [53, 54] and stealth liposomes [37] could stay in the blood circulation for up to 6– 10 h in mice and 40 h in humans [55].
1.3.2 Enhanced permeability and retention (EPR) effect
Tumor cells are those that rapidly differentiate and grow. A large amount of nutrients is required for tumor growth. Angiogenesis as induced by growth factors including vascular endothelial growth factor (VEGF), is also important for tumor growth [56]. Neo-vasculatures in the tumor are usually leaky and not well organized. However, the degree of leakiness is highly tumor dependent and could vary significantly between tumors. Factors including the site and type of the tumor and the degrees of growth and regression lead to different degrees of vascular leakiness. Matsumura and Maeda [57] discovered that due to the leakiness of the vasculature in solid tumors, macromolecules and colloidal nanoparticles that are too big to penetrate normal blood vessels could extravasate from these leaky vasculatures and preferentially accumulate at the tumor site; termed the EPR effect. Lacking lymphatic drainage might also contribute to the enhanced retention effect [57-60].
However, the penetration of smaller nanoparticles is still highly dependent on the leakiness of the tumor vasculature.
1.3.3 Targeting ligands
The EPR effect is important in guiding nanoparticles to the tumor tissues, but is not enough to deliver siRNA into the cancer cells. Two physical barriers remain, the plasma and endosome membranes, which prohibit siRNA from entering the cytoplasm. Drugs or siRNA outside of the cancer cells are not bio-available and show no therapeutic effect. Nanoparticles with a structure too stable may stay in the tumor extracellular matrix without releasing payload drugs. For example, a stealth liposomal-cisplatin formulation (SPI-077) accumulated efficiently at the tumor site, but showed minimal therapeutic effect compared to free cisplatin [66]. In order to prompt cancer cells to take up nanoparticles, targeting ligands are needed for triggering receptor mediated endocytosis. There are various types of targeting ligands being used for tumor targeting, including peptides, proteins, antibodies (Fab, scFv, etc.), aptamers, and small molecular weight ligands, etc.
1.3.4 Anisamide and folic acid as targeting ligands
cancers, including ovary, lung, breast, endometrium, kidney, and brain cancers. Protein toxins, chemotherapeutic agents, oligonucleotides, radioimaging/therapeutic agents, MRI contrast agents, and liposomes [67] have all been modified with folic acid to enhance their targeting of various tumors [68-70]. Similarly, anisamide [71] and haloperidol [72, 73] are small molecule ligands for use in targeting cancer cells that over-express the sigma receptor. These include melanoma, non-small cell lung carcinoma, breast tumors of neural origin, and prostate cancers [72, 74-76]. The LPD tumor targeting work done in our lab focused on anisamide as the targeting ligand [36-39].
1.3.5 Radiolabeling of Nanoparticles with 111In
Radiolabeling is considered the most quantitative method of labeling in the field of drug delivery in cases where appropriate radiolabeling strategies are used. The major advantage of radiolabeling is the general lack of background signal in the images produced. The in vivo administration of radiolabeled NPs not only provides accurate biodistribution profiles and PK studies of the NPs but can also be used for SPECT/CT or PET/CT imaging. 111In is convenient for studying NPs because of its half-life (2.83 days), which is both long enough for PK evaluations and short enough to reduce safety concerns.
177Lu, 86/90Y, 67/68Ga, and 64Cu) and thus has become popular as a universal chelater [77]. DTPA or DOTA could be bound to PEG to acheive surface functionalization of NPs [53, 78]. Unfortunately, this strategy is not compatible with LCP NPs, most likely due to the destabilization of the LCP core by the chelation of calcium. Since 111In can easily be formulated into the LCP core (demonstrated in Chapter 2), 111In labeling through encapsulation was chosen as the method to be used.
The chelation of 111In on the NP surface has been reported to induce accumulation of 111In signal in the bladder [26, 78]. There is a concern regarding loss of 111In chelating due to the competition or decomposition of NPs leading to the release of the 111In-chelator complex. Functionalization may also affect the surface properties of NPs that could lead to the alteration of the biodistribution behaviors of NPs. Therefore, labeling LCP NPs with 111In via encapsulation should be more reliable.
1.4 LCP (lipid/calcium/phosphate) nanoparticles
outer leaflet for its endosome destabilization activity. Neutral dioleoylphosphatidylcholine (DOPC) on the other hand, provided prolonged circulation time thus was used for tumor and lymph node imaging purpose after intravenous injection
Figure 1.1 Cartoon illustration of LCP NP preparation.
Cartoon was modified from previous publication by Li et al., (2012) [40]. Major modifications for
111
In loading were marked in red and will be discussed in detail in Chapter 2.
Similar to the well-established calcium phosphate-mediated transfection method for plasmid DNA delivery [80], the CaP core in our LCP NPs will form precipitates with siRNA (or DNA). These CaP-siRNA or CaP-DNA co-precipitates are acid sensitive. After cellular internalization, the co-precipitates will dissolve in the acidic endosomal environment to induce an osmotic lysis and thus release the trapped siRNA (or DNA). This releasing mechanism was designed to improve the release of siRNA into the cytoplasm, which was demonstrated by the punctate FITC-siRNA distribution pattern of LPD NPs and the homogeneous FITC-siRNA distribution pattern of LCP NP in the cytoplasm [40].
The dissolution of the CaP core increases the osmotic pressure in the endosome, aiding the process of escape from the endosome. Figure 1.2 illustrated the proposed releasing mechanism. After cellular internalization by receptor mediated endocytosis, the DSPE-PEG will shed and LCP core will decompose due to acidic environment in the endosome. Two endosome escape mechanisms were shown: (1) cationic lipid will interact with anion endosomal membrane to destabilize endosome membrane; (2) the increased osmotic pressure caused by dissolved Ca2+ and PO43- ions will help to burst the endosome. Thus the siRNA, chemical drug, and cDNA will be released in the cytoplasm. The cDNA carried by an oligo-arginine peptide into the nucleus for transcription (Hu et al., manuscript in submission) was also shown.
Figure 1.2 Cartoon illustration of the drug releasing mechanisms of LCP NP.
Endosome escape mechanism and the releasing of therapeutics including siRNA, chemical drug,
and cDNA were shown. (Cartoon drawn by Bethany DiPrete)
CHAPTER II
FORMULATING
111IN INTO LCP NANOPARTICLE FORMULATION
2.1 Introduction
2.2 Adjusting CaCl2 and Na2HPO4 concentrations for 111In loading
The general procedure for LCP preparation was established by Li et al.
[40]. In
order to efficiently formulate 111In into the CaP core; some major adjustments have been made to this procedure for our experiments (Figure 1.4). Since 111In will compete with calcium for phosphate, the CaCl2 concentration has been reduced from 2.5 M to 500 mM and the Na2HPO4 concentration (pH 9.0) has been increased from 12.5 mM to 100 mM. Due to the 8-fold increase in the Na2HPO4 concentration, the total microemulsion working volume was able to be reduced to 1/8 accordingly for the same preparation size. This reduction in volume would be beneficial for future scale-up.
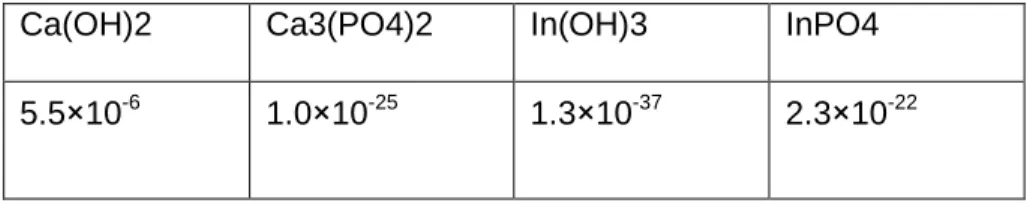
The concentration adjustments did not only enhance the efficiency of encapsulating 111In by reducing calcium competition, but also encouraged the formation of InPO4 and not In(OH)3. The formation of InPO4 (same as Ca3(PO4)2) was desired because for each PO43- ion, there are three delocalized negative charges on four oxygens that allow interaction with multiple In3+ and Ca2+ ions. These interactions build a framework structure for a condensed LCP core. In the case of the OH- ion, the single negative charge did not allow the formation of the framework structure and was not ideal for creating the core.
Table 2.1 Ksp values of Ca(OH)2, Ca3(PO4)2, In(OH)3, and InPO4.
Ca(OH)2 Ca3(PO4)2 In(OH)3 InPO4
Table 2.1 listed the Ksp values of of Ca(OH)2, Ca3(PO4)2, In(OH)3, and InPO4. Consider the starting condition upon mixing of calcium and phosphate microemulsions:
With 50 mM Na2HPO4, pH 9.0:
Ca(OH)2: [Ca2+][10-5]3 = 5.5 x 10⁻⁶ [Ca2+] = 5.5 x 10⁹
Ca3(PO4)2: [Ca2+][5 x 10⁻²]3 = 1.0 x 10⁻²⁵ [Ca2+] = 4 x 10-23
In(OH)3: [In3+][10-5]3 = 1.3 x 10-37 [In3+] = 1.3 x 10⁻²²
InPO4: [In3+][5x10⁻²] = 2.3 x 10⁻²² [In3+] = 4.6 x 10⁻²¹
With 6.25 mM Na2HPO4 pH 9.0:
InPO4: [In3+][6.25x10⁻³] = 2.3 x 10⁻²² [In3+] = 3.68 x 10⁻²⁰
following equation:
As Ca2+ and In3+ consume PO43- to form Ca3(PO4)2 and InPO4, the equilibrium is shifted to the right, generating a significant amount of H+ that neutralizes OH- and lowers the pH value. The formation of CaP was the most dominant reaction since Ca2+ and PO43- were the most abundant ion species in the mixture. The pH value should drop immediately and provide for minimal In(OH)3 formation. Based on this Ksp calculation, we hypothesized that the 111In should mainly form InPO4 and could be formulated into the LCP core efficiently.
2.3 The preparation of 111In-LCP cores
111In-LCP cores were prepared using the previously described method by Li et al. [40] with some modifications (Figure 1.4). Two water-in-oil microemulsions were prepared: 1) a calcium emulsion: 111InCl3 (in 0.05 N HCl, PerkinElmer, Inc.) was premixed with CaCl2 to make a final 50 µL of 500 mM CaCl2 in 4 mL of cyclohexane oil phase (cyclohexane/Igepal CO-520 = 71/29, v/v), and 2) a phosphate emulsion: a sufficient amount of 0.05 N NaOH was added to pH 9.0 Na2HPO4 (to neutralize the extra HCl in the calcium emulsion) to make final 50 µL of 100 mM Na2HPO4 also in 4 mL of cyclohexane oil phase. DOPA (92.5 µL 34.6 mM in chloroform, Avanti Polar Lipids, Inc.) was also added to the phosphate emulsion to form the inner leaflet lipid.
Then, the mixture was centrifuged at 12,500x g for 15 min to collect the 111In -LCP cores.
The cores were then washed once with 10 mL absolute ethanol to remove residual surfactants. Washing with 1.2 mL cyclohexane and an addition of 1.4 mL absolute ethanol removed residual DOPA. Finally, the cores were washed with 2 mL of absolute ethanol to ensure the removal of cyclohexane. After all washes, the pellets were dispersed in 250 µL of chloroform.
The product was centrifuged at 10,000x g for
5 min. Precipitates containing excess salts and aggregates were
discarded and the supernatant containing LCP cores was collected and stored in a glass vial at -20 °C.In the original method described by Li et al. [40], the LCP cores are to be washed extensively only with a large volume of ethanol (EtOH). The use of cyclohexane in our method was inspired by the observation that after chloroform dispersion of the core, if one evaporated the chloroform the LCP core pellets were no longer suspendable or able to be separated in EtOH. The LCP cores bound tightly to each other and the walls of the eppendorf tube. We postulated that since chloroform was a stronger hydrophobic organic solvent than EtOH, it may more efficiently separate and remove excess DOPA and surfactants on the core. Furthermore, chloroform may also make the core surface truly hydrophobic, creating tight binding between the cores that EtOH could not break. However, chloroform has a higher density (1.483 g/mL) than cyclohexane (0.779 g/mL),
Table 2.2 Washing power of cyclohexane.
First
supernatant
EtOH Cyclohexane/ EtOH
EtOH In NPs
NBD-PA 66.5% 0.4% 12.9% 0.3% --
111In 20.6% 0.7% 17.7% 0 30.7%
Figure 2.1 Improved biodistribution pattern of S-LCP after cyclohexane wash.
A) LCP biodistribution pattern before the cyclohexane washing improvement. B) LCP
biodistribution pattern after the cyclohexane washing improvement. The result of B) is actually the
biodistribution data after the SPECT/CT imaging which will be described in Chapter 3.1.
2.4 Coating with an outer leaflet
To form the coating of the outer leaflet, 100 µL of 20 mM cholesterol, 100 µL of 20 mM DOPC (Avanti Polar Lipids, Inc.) or DOTAP (Avanti Polar Lipids, Inc.), and 50 µL of 20 mM of 1,2-distearoyl-sn-glycero-3-phosphoethanolamine-N-poly(ethylene glycol)2000 (DSPE-PEG2000, Avanti Polar Lipids, Inc.) were mixed with the LCP cores in a glass vial. After the complete removal of the CHCl3 using a stream of nitrogen and vacuum desiccation for 1 h, the cores were suspended in 100 µL of pre-warmed absolute alcohol (55 °C) and dispersed in a 1 mL pr e-warmed aqueous solution containing 5% dextrose.
outer leaflet lipids to be used for coating was determined to be 1.56 folds of the inputted inner leaflet, DOPA.
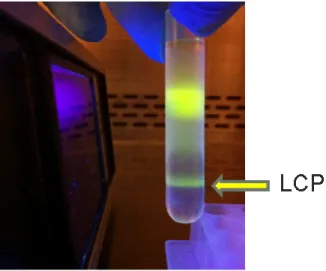
Figure 2.2 Purify LCP NPs using sucrose gradient centrifugation.
A 4 mL Beckman polyallomer ultra-centrifugation tube was used for the 60% to 0% sucrose
gradient. The NBD fluorescent was excited with a hand-held UV lamp for observation.
2.5 Tuning LCP nanoparticle size
NPs, gold NPs, polymeric micelles, and quantum dots with different surface protection coatings [53, 87]. There is no literature that characterizes the in vivo biodistribution behavior of well-PEGylated, lipid-bilayer-coated NPs in such a small size range. In order to study this concept, an enlarged version of LCP (L-LCP) was developed and the in vivo performance of NPs of both sizes was also evaluated for comparison.
Figure 2.3 TEM images of LCP NPs
A) TEM images of 111In -LCP core made with different Igepal system to Triton system mixing ratio. S- and L-LCP were made by Igepal system to Triton system ratio 1:0 and 1:7, respectively.
B) TEM images of S- and L-LCP after outer leaflet coating. C) Negative staining of S- and L-LCP
to show the lipid coating. (Scale bars = 50 nm)
TEM images of the final S- and L-LCP after outer leaflet coating showed that
both S- and L-LCP were well separated individual particles (Figure 2.3B). The lipid
membrane coating of S- and L-LCP was further visualized by negative staining using
uranyl acetate (Figure 2.3C).
indicated by the presence of a number of smaller LCP cores observed in the TEM images. (Figure 2.4).
Figure 2.4 TEM images of LCP core made with Igepal system/Triton system = 1/7 in
water bath at 65°C.
2.6 Characterizing LCP nanoparticles
2.6.1 Size and zeta-potential measurement by dynamic light scattering
Table 2.3 Characterization of S-LCP and L-LCP
DNA oligo entrapment [a]
111In
entrapment [b]
Size/PDI [c]
Zeta potential [c] Calcium/Phosphate ratio of the LCP core [d]
S-LCP 64.4 ± 4.4% 30.7 ± 4.1 % 25.3 ± 1.9 nm/0.3
-19.9 ± 4.1 mV 1.01 ± 0.04
L-LCP 29.2 ± 0.5% 32.3 ± 2.2 % 67.2 ± 2.0 nm/0.4
-18.0 ± 2.0 mV 0.89 ± 0.03
[a] determined by tritium labeled DNA oligo and liquid scintillation counting (N=3)
[b] determined by 111In gamma counting (N=4) [c] measured by dynamic light scattering (N=3)
[d] analyzed by ICP-MS. (N=3)
2.6.2 Determine oligo entrapping efficiency with 3H-labeled DNA oligo
Due to issues with stability and in order to reduce costs, DNA oligo was used as a surrogate for siRNA. 3H labeling of oligonucleotides was prepared using a method of hydrogen exchange, with 3H2O at the C8 positions of the adenine and guanine groups of the oligonucleotides (described by Graham et al.) [88]. One-hundred nmol (1.224 mg) of DNA oligo was lyophilized and put in PBS combined with 0.1 mM EDTA. Two hundred
µL of 3H2O containing 8.3 uL β-mecaptoethanol was added and allowed to incubate at 90°C for 6 h. Then the unexchanged 3H2O was removed via lyophilization. The product was resuspended in 1 mL of regular water and incubated for 1 h at room temerature to allow the rapidly exchangeable protons to dissociate. This lyophilization/resuspension process was repeated for three cycles. The final product was passed through a Centri-Spin oligo purification column (Prince Separation) to remove the PBS salt and EDTA.
oligo was mixed with non-labeled DNA oligo to make the LCP cores. Using scintillation counting, it was determined that S-LCP could entrap DNA oligo at an efficiency of ~60%, which was not affected by the presence of 111In. DNA entrapment of L-LCP was also unaffected by the presence of 111In, but could only entrap ~30% of the DNA oligo (Table 2.3). The reason for this difference in entrapment is not fully understood.
2.6.3 Determine 111In entrapping efficiency
The 111In entrapment efficiencies of both S- and L-LCP were around 30%, determined by gamma counting (Table 2.3).
2.6.4 Determine calcium/phosphate ratio in the LCP core
Inductively coupled plasma mass spectrometry (ICP-MS) was used to analyze the LCP core compositions. For both S- and L-LCP, the Ca/P ratio were about 1, which was different from that of the naturally occurring hydroxyapatite (Ca10(PO4)6(OH)2, Ca/P = 1.67), suggesting an amorphous CaP precipitation in the LCP (Table 2.3).
2.6.5 Conclusions
2.7 How does the cell manage calcium toxicity?
The dissolution of LCP core in the endosome is designed to release the drug (siRNA, plasmid, chemical drug, etc.) and increase the osmotic pressure to promote the bursting of the endosome and the consequential escape. The elevated cytoplasmic Ca2+ concentration has been demonstrated through a Fura-2 experiment [40]. Fura-2 is a ratiometric fluorescent Ca2+ sensitive dye. It was the first widely-used calcium indicator and remains very popular, especially in the field of neuroscience. The Ca2+ free Fura-2 excitation wavelength profile peaked at 380 nm. Upon Ca2+ binding, there is a blue-shift in the excitation peak to 340 nm. The emission wavelength remains unchanged at 510 nm.
Under physiological conditions, the Ca2+ concentration is ~1.2 mM extracellularly and ~0.1µM in the cytosol. The cytosolic Ca2+ concentration is associated with several cellular signaling events. Low to moderate Ca2+ concentrations (0.2-0.4 µM) triggers apoptosis, higher concentrations of Ca2+ (>1 µM) are associated with necrosis [89-93]. For this reason, it is necessary to address whether the Ca2+ delivered by LCP would be toxic to the cells.
Based on the calcium homeostasis mechanism, we hypothesized that when cells take up LCP and release Ca2+ into the cytoplasm, the two major Ca2+ pumps on the plasma membrane and the mitochondria will rapidly respond to the elevated cytosolic Ca2+ concentration and prevent the cells from Ca2+ induced apoptosis or necrosis.
2.7.1 Design of in vitro Fura-2 experiment
Two specific Ca2+ pump inhibitors were selected to exam the hypothesis. The plasma membrane Ca2+ pump (PMCA) inhibitor, Caloxin 2A1, is a peptide (Val-Ser-Asn-Ser-Asn-Trp-Pro-Ser-Phe-Pro-Ser-Ser-Gly-Gly-Gly-NH2, purchased from American Peptide Company) developed by using the phage display technology [95-97]. The mitochondrial calcium uniporter (MCU) specific inhibitor, Ru360 (EMD Millipore), is a cell-permeable, oxygen-bridged dinuclear ruthenium amine complex that binds to mitochondria with high affinity (Kd = 340 pM) and blocks Ca2+ uptake into mitochondria at IC50 = 184 pM in vitro [98, 99].
temperature, humidity control, and 5% CO2 supply was used for cell viability control. We recorded the ratio imaging video for 10 sec, paused for LCP addition, then recording was resumed for additional 8 min.
2.7.2 Results and discussion
During the ratio imaging, red pseudo color was applied to fluorescent signal detected with 380 nm excitation. Green pseudo color was applied when using 340 nm as excitation. Red and green channels were superimposed and adjusted to be in red color before adding LCP (Figure 2.5). It is important to add the LCP only when the cells are on the verge of transitioning from red to green. In the group without inhibitors, after adding LCP some cells turned green occasionally, indicating elevated Ca2+ concentration in the cytosol. Note that the cells were incubated with LCP throughout the imaging experiments. The uptake of LCP and the pumping of Ca2+ were both continuous processes. As a result, some cells actually switched color several times during the observation period.
indicating that the observed Ca2+ concentration change was not due to the cationic lipid.
Figure 2.5 Calcium pumps are important for Ca2+ toxicity management
Shown here are stills taken from the recorded video at the indicated time points for four different
treatment groups. Red color indicates low intracellular Ca2+ concentration under physiological conditions. Green color indicates elevated intracellular Ca2+ concentration. Phase contrast images taken at 8 min are included to show round, swollen cells.
conclude that the Ca2+ delivered by LCP is unlikely to cause Ca2+ induced apoptosis or necrosis in vivo. Several in vivo studies delivering siRNA with the LCP formulation also reported minimum toxicities in the animal models [41, 42]. Nevertheless, we had proceeded to test the hypothesis in vivo.
2.7.3 Evaluating LCP induced Ca2+ toxicity in vivo with Ca2+ pump inhibitors
Figure 2.6 In vivo necrosis induced by LCP with Ca2+ pump inhibitors
H460 subcutaneous tumor sections with H&E staining showing that LCP toxicity was only
observed in the presence of Ca2+ pump inhibitors. (A) Control H460 tumor without any treatment. (B) Tumor that has received an IT injection of two Ca2+ pump inhibitors. (C) Tumor that has received an IV injection of LCP. (D1, D2) Tumors that have received an IT injection of two Ca2+ pump inhibitors and an IV injection of LCP. (E1, E2) Tumors that have received an IT injection of
2.7.4 Conclusion
Figure 2.7 Cartoon illustration of the Ca2+ removing mechanism after LCP dosing
CHAPTER III
SPECT/CT IMAGING AND LCP PHARMACOKINETICS STUDY
3.1 In vivo H460 xenograft tumor imaging
Employing all the adjustments made to the procedure to load 111In and improve the washing and coating of the cores, S-LCP NPs coated with DOPC/cholesterol/DSPE-PEG2000 at a ratio of 2/211 were prepared for in vivo SPECT/CT imaging of H460 xenograft tumors. S-LCP containing ~0.5 mCi of 111In was injected into the tail vein of mice bearing H460 tumors.
3.1.1 SPECT/CT imaging protocol
All animal work was approved by and performed in accordance with the
guidelines of the University of North Carolina Institutional Animal Care and Use
Committee. Athymic nude (nu/nu) mice bearing H460 human lung cancer tumors
were used. SPECT/CT experiments were performed using a GE eXplore speCZT
system. A 7-pin-hole collimator for mice was used to achieve high resolution SPECT
imaging. In order to
include both the tumor and heart in the same field of view (FOV), 5 x 10⁶ or 2 x 10⁷ (for the younger tumor model) H460 tumor cells were inoculated subcutaneously on either side of therib cage.
Mice
were anesthetized with isoflurane and their body temperature was controlled
using a water circuit and warm air.
Following injection, the mice were continuously scanned for 2 h to ensure capture of early distribution in blood circulation. Imaging was facilitated through the inoculation of the tumor close to the chest and the reduction of the axial FOV to cover only the chest region. Twelve time points of imaging were acquired during the first 2 h. The mice were scanned at 4, 6, 8, 24, and 26 h post injection.3.1.2 Results and discussion
Figure 3.1 SPECT/CT images at three time points post IV injection.
CT images and SPECT/CT overlay images were presented side by side to show anatomical
details. Nude mice bearing H460 tumors of two different ages were injected through the tail vein
with S-LCP containing ~0.5 mCi 111In. Different horizontal sections and vertical sections were included to show organ images on different section planes.
However, larger iron oxide NPs coated with dextran similar to or larger than our L-LCP preferentially accumulated in the liver and spleen [87]. Other NPs with similar sizes and PEG grafting exhibited, like our S-LCP, prolonged time in circulation in the blood. However, no preferential accumulation in the lymph nodes was reported [53, 78, 86]. For example, one recent publication reported that PET imaging demonstrated a long-circulating, 15 nm, micellar NP (circulation time longer than S-LCP) that had minimal accumulation in the liver and spleen, with ~6% injected dose per gram tissue (ID/g) tumor accumulation. However, this micellar NP did not exhibit lymphotropism [86]. The authors hypothesized that monomer desorption and cellular internalization and digestion were responsible for the NP clearance. The PET images also indicated that a portion of the 64Cu signal was excreted into the intestine. Another recent publication reported 30 nm Au nanocages for use in PET imaging of tumors also exhibit minimal accumulation in the liver and spleen and no lymphotropism [78]. In this case, rapid and significant clearance of 64Cu signal was observed in the bladder. Therefore, NP lymphotropism may be correlated with NP size and dependent on their surface properties. Coating of the NP surface with a lipid bilayer or dextran may contribute to the unusual lymphotropism. Further studies on LCP lymphotropic behavior will be discussed in Chapter 4.
3.2 LCP pharmacokinetics profile study from both SPECT/CT and organ
dissections
3.2.1 PK study from organ dissections
the MPS of ~20% ID/g in the liver and ~13% ID/g in the spleen (Figure 3.2A). This reduced accumulation in the liver and spleen is comparable with many other NPs with similar particle size. For instance, the aforementioned 30 nm Au nanocage showed ~40% ID/g accumulation in the liver and ~30% ID/g in the spleen in a mouse model bearing EMT-6 tumors
[78].
A PEGylated, 20 nm gold NP had been reported to achieve ~30% ID/g in the liver and ~15% ID/g in the spleen, which is very close to the levels of S-LCP [53]. The long-circulating, 15 nm micellar NP exhibited the lowest accumulation in the liver and spleen (~4.5% and ~4.6% ID/g, respectively)[86].
However, since the micellar NP was biodegradable and there were 64Cu signals excreted into the intestine, shown in the PET images, it is difficult to ascertain the true levels of accumulation in the liver and spleen in this case.Figure 3.2 LCP biodistribution results from organ dissention
A) S-LCP biodistribution after SPECT/CT imaging. (N=3) B) Biodistribution of S-LCP and L-LCP
at 4 h post injection. (N=3)
3.2.2 Compare S-LCP and L-LCP NPs for tumor imaging
To compare whether S- or L-LCP is better for the purpose of tumor imaging, trace amounts of 111In were loaded into both S- and L-LCP and the particles were coated with DOPC/cholesterol/DSPE-PEG2000 at a ratio of 2:2:1. A biodistribution study of these particles was then performed. Figure 3.2B showed the results collected 4 h post IV injection. Tumor accumulation level of L-LCP was slightly lower than S-LCP. However, S-LCP showed better MPS evasion and a higher concentration in the blood.
are consistent with reports on SPIO or gold NPs [53, 87]. Twenty-four hours after administration via tail vein injection, L-LCP also showed lower accumulation in the lymph nodes at 15.6 ± 3.1% (N=3). This pattern could be due to the population of smaller particles generated during the formulation of the L-LCP cores (Figure 2.3A). Because a small amount of uptake by the MPS is preferred in order to avoid toxicity in the liver and spleen and because accumulation of S-LCP was higher than L-LCP in both the tumor and lymph nodes, we conclude that S-LCP is better than L-LCP for the purpose of imaging tumors and lymph nodes.
3.2.3 Validate 111In labeling of LCP NPs with 3H-labeled oligo
To rule out the possibility that 111In encapsulation is not an accurate label for LCP NPs, another biodistribution experiment was completed using S-LCP containing 3 H-labeled DNA oligo. The results from the experiment using 111In agreed with those of the study using 3H-labeled oligo, suggesting that labeling LCP cores with either 111In or 3 H-labeled oligo accurately represents the biodistribution of S-LCP [105]. However, unlike 3
H, which has a low energy beta particle emission, 111In is advantageous for its in vivo imaging and real-time NP tracking capabilities.
3.2.4 Pharmacokinetics study from SPECT/CT image analysis
performed after the images have been taken. Using AMIDE software, PK profiles of S-LCP NPs loaded with 111In were studied in the blood (using heart as sampling region), tumor, kidneys, and liver (Figure 3.3).
Figure 3.3 PK analysis from the SPECT/CT images using Amide software.
The radioactivity in mCi/g was determined from the SPECT images using Amide software with a
standard curve. A) PK trends in the blood indicated a rapid distribution phase in the first 1.5 h
(half-life 4.4 h), followed by a slow blood-elimination phase (half-life 18.4 h). B) Tumor had an
instant S-LCP accumulation partially explained by the blood content. C) Kidney accumulation
could be a combination of rich blood content and a slow accumulation curve which is probably
very similar to tumor. D) Liver slowly accumulated S-LCP throughout the scanning period. The
instant accumulation had a high contribution by the blood since the liver is a blood-rich organ.
tumor. Precise contouring along the ventricles was not possible due to imaging resolution and manual drawing limitations. Thus, the method might result in the under-estimation of blood and tumor curves. However, the PK trend in the blood clearly suggested a two-compartment model with a rapid distribution phase within the first 2 h, followed by a slow blood-elimination phase (Figure 3.3). The half-lives of the rapid distribution and slow blood-elimination phases were ~4.4 h and ~18.4 h, respectively. The tumor on the other hand, displayed an initial accumulation of NPs, partially due to blood perfusion and vascular fraction, continued to accumulate. Although there was a significant amount of S-LCP in the blood, the rate of tumor accumulation was determined by the degree of EPR effect in the individual tumors. Prolonged blood circulation of NPs is believed to be the key to enhancing NP tumor accumulation. In our study, however, PK data demonstrated that after a decently long circulation profile was achieved, NP accumulation in the tumor was actually restricted by the tumor-dependent EPR effect. Therefore, reduced MPS uptake and enhanced NP blood circulation are not sufficient for high levels of NP accumulation in the tumor. Additional improvements must be considered.
3.3 Can ligands improve the accumulation level of NP in the tumor?
demonstrated that PEG density above 10% on a nanoemulsion NP may inhibit the function of targeting ligands [106]. When the ligands were conjugated on the distal ends of PEG chains, the increased interactions between the chains, due to the high density of chains, could reduce the ligand’s ability to interact with its receptor. To study whether this was the reason why targeting ligands could not improve S-LCP tumor accumulation, the total percentage of DSPE-PEG2000 was decreased from 20% to 10%. The results still indicated that neither ligand could enhance levels of accumulation in the tumor (Figure 3.4B).
Figure 3.4 Ligand effects on LCP NP biodistribution and tumor accumulation
A) Tumor accumulation and blood retention of S-LCP coated with cholesterol/DOPC and grafted
with indicated PEG (and PEG-ligand) contents at 24 h post injection. B) Decrease the total PEG
content still cannot enhance accumulation of S-LCP NPs in the tumor. (N=3)
neo-vasculature [109] or vasodilatants [110] to fundamentally enhance the EPR effect have been shown to successfully improve NP accumulation in the tumor
3.4 Tumor age (size) effect on NP accumulation
3.4.1 Tumor blood vessel staining with CD31
Figure 3.5 Younger tumor had more disorganized blood vessels.
A) Tumor blood vessel stained with CD31-PE. Younger tumor sections (upper two) have more
disorganized pattern of staining in the blood vessels compared to the older ones (lower two). B)
Quantification analysis using ImageJ software and Student’s t-test. (N=7, P<0.0001)
3.4.2 Demonstration of EPR effect with Evans Blue
Next, Evans Blue (purchased from Sigma) was used to demonstrate the EPR effects in both younger and older tumors. Evans Blue binds to serum albumin with high affinity, and has been widely used to quantitatively access the degree of EPR effect in tumor [60], permeability of blood-brain-barrier [111], and peripheral inflammation [112].
to remove the blood component of any organ. The tumors were collected and the Evans Blue color in the tumor was visually documented (Figure 3.6A).
Figure 3.6 Younger tumor had higher EPR effect.
A) Photo of younger and older tumors showing that the younger tumor has higher EPR effect and
accumulated Evans Blue at higher level. B) Quantification after extracting Evans Blue from tumor
tissue. Absorbance at 575 nm was converted into % ID/g with a standard curve. (N=3, P= 0.017
by Student’s t-test)
3.4.3 Discussion
inoculating more cells, the younger tumor grew at an increased rate, subsequently causing an increased EPR effect and accumulation of NPs. Manipulating the inoculation protocol to work on younger or smaller tumors could potentially result in better imaging or therapeutic outcomes. However, naturally occurring tumor malignancies are usually slow growing and start with a small number of tumor cells. Hence, the question of whether xenografts are valid pre-clinical models for naturally occurring tumors has been raised during the past decade. Genetically engineered mouse models [113, 114] or patient-derived tumor xenografts [115] have provided better, more clinically relevant tumor models and show promise for the future of the field. However, these models still suffer from poor consistency and limited availability [113-115].
3.5 In vivo lymph node metastasis imaging with 4T1 model
A variety of human cancers disseminate via regional lymph node metastasis [116]. The ability to image sentinel lymph nodes and evaluate the stage of the metastasis is highly desirable. To demonstrate whether S-LCP can be used to detect lymph node metastasis, a 4T1 murine, breast cancer cell line that expresses both luciferase and green fluorescent protein (4T1-luc2-GFP) was used to establish a lymph node metastasis model [117, 118].
3.5.1 Establishing 4T1 metastasis model
6-8 weeks old female BALB/c mice [117, 116-8].
3.5.2 Monitoring 4T1 lymph node metastasis
The luciferase expression allowed tumor and metastasis progress monitoring starting around 10 d after hock inoculation. Bioluminescence imaging was taken using a Kodak In-Vivo FX PRO system within 15 min after intraperitoneal (IP) injection of luciferin at 150 mg luciferin/kg body weight (Caliper).
3.5.3 Imaging lymph node metastasis
Figure 3.7 Imaging 4T1 lymph node metastasis.
A) Bioluminescence image of two BALB/c mice with strong luciferase activity in their sentinel
popliteal lymph nodes. Image was taken 10 d after hock inoculation. B) SPECT/CT images taken
24h post IV injection of 111In loaded S-LCP. Two horizontal and two vertical sections were shown. The size enlarged and tumor loaded sentinel popliteal lymph node was clearly visualized and
could be directly compared with the counter side popliteal lymph node. C) GFP fluorescent
images of the metastatic 4T1-luc2-GFP cancer cells in the lymph nodes. Eight lymph nodes (from
top to bottom: 2 axillary, 2 brachial, 2 inguinal, and 2 popliteal) from both side of one mouse were
signals, indicating tumor metastasis. D) S-LCP biodistribution 28h post injection at liver, spleen,
4T1 tumor, and various lymph nodes by gamma counting. (N=3)
An uneven pattern of 111In signal distribution in the metastatic lymph node was probably due to the presence of the tumor mass, an observation that was also reported in other studies [100, 119]. After SPECT/CT imaging, the mouse was sacrificed for GFP imaging of the metastatic cancer in the lymph nodes (Figure 6C) using an IVIS Kinetic imaging system. Organ biodistribution analysis by gamma counting was also conducted to confirm the SPECT/CT imaging results (Figure 6D).
3.5.4 Discussion
CHAPTER IV
LCP LYMPHOTROPISM STUDY
4.1 Introduction
The lymphatic system is a central component of the immune system and serves as the secondary circulation system responsible for the drainage of fluid from the extracellular space, proteins, and waste products into the blood. Lymph nodes also play an important role in diseases such as infection, inflammation, and cancer [120]. Primary tumors usually begin metastasis by invading the sentinel lymph nodes, which then serve as a reservoir for further spread of cancer cells [121-123].
The delivery of genes and drugs to both the local, draining lymph nodes and the lymphatic system as a whole is a challenging task. Certain lipophilic compounds such as long-chain fatty acids, cholesterol esters, triglycerides, and lipid-soluble vitamins can be transported through the lymphatic channels [120, 124]. However, most chemotherapy agents cannot gain access to the lymphatic system after conventional IV infusion, including the lymph node metastasis [120, 124]. Consequently, the development of clinical treatments of lymph node metastasis and other cancers has remained elusive.
injection) increase in doxorubicin concentration in the draining lymph nodes in rats compared to the increase caused by free doxorubicin [125]. However, no significant difference was observed after IV administration. Thus, effective delivery by IV administration to the lymphatic system allowing the detection of lymph node metastasis is still in demand.
LCP NPs were first developed for siRNA delivery [40-42] and have recently been successful in delivering gemcitabine mono-phosphate (Zheng et al, manuscript in submission). Successful loading of 111In into LCP NPs has also been demonstrated in Chapter 3 for SPECT/CT imaging and PK/biodistribution studies. In the SPECT/CT imaging study, an accumulation level as high as ~70% ID/g in lymph nodes throughout the body was observed following IV injection. That 111In can form precipitate with phosphate in a manner very similar to calcium is the principle behind 111In loading and entrapment in the LCP core. Taking advantage of the Ca-P core formation principle, a variety of anti-viral nucleoside analogue drugs [82-85] could be entrapped via a similar strategy as gemcitabine mono-phosphate. This property of the LCP, along with its lymphotropism, allows the use of the NP formulation for the delivery of nucleoside-analog drugs for the treatment of diseases such as metastasis and HIV infection in the lymph nodes.
4.2 Accumulation of S-LCP in the lymph nodes
As was demonstrated in Chapter 3, S-LCP with an outer-leaflet coating of DOPC/Cholesterol/DSPE-PEG2000 (2:2:1) had little accumulation via MPS in both the liver and spleen. The particle did, however, accumulate at a level of 8% ID/g or higher in H460, subcutaneous tumor and 4T1 metastasis models (Chapter 3.2 & 3.5). Furthermore, lymph node accumulation as high as ~70% ID/g was observed (Figure 4.1).
Figure 4.1 Accumulation of S-LCP-DOPC with 20% PEGylation in the lymph nodes of
nude mice.
Yellow arrows indicated high accumulation level at ~70% ID/g in the symmetrical lymph nodes.
Four different SPECT/CT sections were presented. SPECT/CT images were taken at 27 h post IV
injection.
were observed to accumulate significant amounts of In-111 loaded S-LCP-DOPC with 20% PEGylation. This confirmed that the lymphotropism of S-LCP NPs also existed in normal and healthy mice.
Figure 4.2 Accumulation of S-LCP-DOPC with 20% PEGylation in the lymph nodes of
C57BL/6 mice.
symmetrical lymph nodes (yellow arrows) throughout the body accumulated significant amount of
S-LCP.
4.3 Hypothesis for LCP NP lymphotropism
When coating S-LCP NP with DOTAP/Cholesterol/DSPE-PEG2000 (2:2:1), accumulation of the particles in the hepatocytes of the liver was high and uptake by the Kupffer cells was low (Liu et al, manuscript in submission). This efficient delivery to the hepatocytes could be partly attributed to the small particle size of S-LCP NPs, which allows them access to the fenestrated endothelial cells of the liver and encourages hepatocyte targeting mediated by apolipoprotein-E [130].
111In gamma counting indicated that 24 h after injection, the mice retained ~85% of the injected dose. However, when all major organs (heart, liver, spleen, lung, kidney, and 8 lymph nodes) were collected and measured, only ~45% of the injected dose was recovered (Figure 3.2A). Furthermore, SPECT/CT imaging confirmed that there was no significant excretion of the particles from the bodies of the mice during the experiment (Figure 3.1 & 4.1).
4.4 S-LCP NPs was more tissue penetrating
4.4.1 Experimental design
Due to the difficulty of directly observing particles penetrating into tissues from circulation, we designed an intramuscular (IM) injection experiment comparing S- (~25 nm in diameter) and L-LCP (~67 nm in diameter) NPs with or without a coating of 20% PEG in the outer leaflet to test our hypothesis. The NPs were IM injected to the right hind leg of C57BL/6 mice. The volume of the injection was limited to 10µL to reduce tissue damage. After 3 or 24 h, the mice were sacrificed and major organs, including lymph nodes and the injected leg, were collected for gamma counting. Draining popliteal lymph nodes were collected and 4 counter-side, distal lymph nodes (1 axillary, 1 brachial, 1 inguinal, and 1 popliteal from the counter side of the IM injection) were also collected for comparison. The gamma reading was corrected for the 111In decay factor during analysis. Statistical analysis was performed using a Student’s t-test. Our hypothesis was that if S-LCP NPs have the ability to achieve high tissue penetration following local intramuscular injection, they can move more freely in the tissue, enter into circulation in the blood, and accumulate in the distal lymph nodes.
4.4.2 Results and discussions
the circulation. Although there was some accumulation of LCP NPs in the liver, the S-LCP NP depot at the IM injection site served as a reservoir to provide a continuous supply of NPs to the blood. Distal lymph nodes were able to accumulate ~41% ID/g of IM injected S-LCP NPs.
Figure 4.3 IM injection experiments showing that S-LCP NPs is more tissue penetrating
than L-LCP NPs
Biodistribution comparison after IM injection of 111In loaded S- and L-LCP coated with or without 20% DSPE-PEG2000. Mice were sacrificed at 3 h or 24 h post IM injection.
by the MPS uptake processes; PEGylation in a manner similar to that of the smaller NPs did not alter this pattern [53, 78]. This phenomenon may explain why PEGylated, L-LCP NPs accumulate in the draining lymph node more than S-LCP NPs. In either case, however, the effects of PEG protection in reducing their uptake by the MPS (i.e., local macrophages and dendritic cells) were clear.
Without PEGylation, both S- and L-LCP NPs had limited mobility (though S-LCP NPs were still more mobile), trapping more than 80% of the injected dose at the site of injection after 3 h. Since there was no PEG protection against MPS, rapid and efficient phagocytic uptake lead to high accumulation in the draining lymph nodes at both 3 and 24 h post-injection. Larger particles without PEGylation were preferentially taken up by the MPS, as demonstrated by their accumulation levels of ~3000% ID/g in the draining lymph nodes after 3 h.
4.5 Different distribution pattern of S-LCP and L-LCP in the draining lymph node
4.5.1 Experimental design
Double-stranded oligo DNA (synthesized by Sigma, Texas-Red was labeled on the sense strand, sequence: 5’-TxRd-CAAGGGACTGGAAGGCTGGG-3’) was added to the calcium emulsion during the preparation of the LCP cores. Followed by the same core preparation and outer leaflet coating methods with or without 20% DSPE-PEG2000, 10 µL IM injection of this Texas-Red oligo loaded LCP NPs were used for the experiment examining the distribution in the draining lymph nodes.
After 24 h, the draining lymph nodes were collected and fixed with formalin for frozen section and observation under confocal microscopy. The lymph nodes were fixed in formalin overnight then put in 30% sucrose solution for another overnight to help preserve the morphology of the tissue. The lymph nodes were then mounted in OCT (optimum cutting temperature) compound and snap-frozen using liquid nitrogen. Frozen sections were cryosectioned at a thickness of 20 µm. FITC labeled antibodies against CD11c or CD11b were diluted to a concentration of 1:500 for immunostaining. After wash with phosphate-buffered saline, the slides were mounted with DAPI containing mounting medium for confocal microscopy observation using a Leica SP2 confocal microscope.
4.5.2 Results and discussions
L-LCP, Texas-Red fluorescence was mostly overlapped with CD11c and partially overlapped with CD11b. Combined with the observation that IV injected L-LCP had low accumulation in the lymph nodes, this result suggested that after IM injection, L-LCP accumulation in the draining lymph nodes was mainly mediated by uptake by MPS at the injection site, after which the MPS cells migrated to the draining lymph nodes.
Figure 4.4 Different biodistribution patterns of S- and L-LCP NPs in the lymph nodes
Co-localization of LCP with phagocytic cells in the draining lymph node observed with confocal
dendritic cells and CD11b for macrophages) were labeled with green. Left panels are for S- and
right panels are for L-LCP, respectively.
4.6 PEG coating for S- and L-LCP
To demonstrate the importance of PEGylation to the lymphotropism of S-LCP, an experiment varying the amount of PEG coating on the S- and L-LCP was conducted. Geometrically, NPs will have increased curvature as the NPs become smaller. In order to provide a comparable degree of surface protection, a higher degree of PEGylation would be required by an S-LCP (~25 nm) than an L-LCP (~67 nm). However, smaller NPs might inherently possess a stealth property that allows them to avoid uptake by the MPS and thus require less PEGylation. In order to address this apparently contradictory question, the in vivo biodistribution of S- and L-LCP-DOPC loaded with 111In and coated with either 0%, 5%, 10%, or 20% DSPE-PEG2000 was studied following IV injection.
uptake by the MPS in the liver, while the spleen seemed to be very sensitive to the size of NPs. Only when the NP size was reduced, could we achieve significant reduction in the amount of accumulation of the NPs in the spleen. This accumulation pattern holds true for many other types of NPs in addition to the one described here [53, 78].
Figure 4.5 Evaluation of the effect of PEGylation on S- and L-LCP-DOPC NPs.
Effect of PEGylation on the biodistribution of S-LCP (A) and L-LCP (B) with different degree of
Even when PEGylated at 20% PEG, L-LCP exhibited much lower accumulation in the lymph nodes compared to S-LCP NPs (~21% vs 70% ID/g, respectively). The lower degree of accumulation in the lymph nodes could be explained by the population of smaller particles that was generated as a by-product during the process to create the L-LCP cores (Figure 2.3A). Alternatively, NPs could be carried by MPS cells in the periphery and migrated into the lymph nodes [131].
4.7 Intraperitoneal injection of LCP NPs
Figure 4.6 Administering LCP NPs by IP injection
A) IP injection of both S- and L-LCP-DOPC with 20% PEGylation led to very similar biodistribution
result as IV injection. B) SPECT/CT images showing that the IP injected S-LCP-DOPC with 20%
PEGylation could be fully absorbed into circulation in the blood and result in similar accumulation
in the lymph nodes at 24 h (yellow arrows). C) Blood PK profile analyzed from SPECT/CT images
by AMIDE software using heart as reference.


![Table 2.3 Characterization of S-LCP and L-LCP DNA oligo entrapment [a] 111 In entrapment [b] Size/PDI [c]](https://thumb-us.123doks.com/thumbv2/123dok_us/8322659.2206283/37.918.133.846.181.356/table-characterization-lcp-lcp-oligo-entrapment-entrapment-size.webp)


