MINERALIZATION OF ANTHROPOGENIC CO2 VIA WATER-GAS-ROCK REACTION
Isaac T. Westfield
A dissertation submitted to the faculty of the University of North Carolina at Chapel Hill in partial fulfillment of the requirements for the degree of Doctor of Philosophy in the
Department of Marine Sciences.
Chapel Hill 2013
Approved by:
iii ABSTRACT
Isaac T. Westfield: Mineralization of anthropogenic CO2 via water-gas-rock reaction (Under the direction of Justin Ries)
Atmospheric CO2 has increased 50% since the Industrial Revolution due to
anthropogenic combustion of fossil fuels, deforestation, and cement production.
Mineralization of fossil-fuel-derived CO2 is one method of reducing emission of
anthropogenic CO2. Mineralization via aqueous precipitation (MAP) removes CO2 from
anthropogenic waste-streams (e.g., fossil-fuel-fired power plants) and creates
negative mineral byproducts (Mg-Sr-Ca-Na-Fe-carbonates) to supplement/replace
carbon-positive building materials (cement, drywall). However, sequestration of anthropogenic CO2
as carbonate minerals requires large sources of alkalinity (to convert CO2 to CO32-) and
divalent cations (e.g., Mg2+-Ca2+-Fe2+). Ultramafic and mafic silicate rocks (peridotites,
serpentinites, basalts) are globally abundant sources of the divalent cations and alkalinity
required for CO2 mineralization.
Fifty water-gas-rock batch-reaction experiments were performed on seven igneous
rock-types to quantify and model MAP reactions under controlled and natural conditions.
Rocks were pulverized (40-180 µm) and reacted with water under pure-CO2 and low-pCO2
(ca. 44 ppm in air) and under 25 and 200°C for two weeks. CO2-sequestration increased an
grain size decreased with reaction time, although late-stage flocculation occurred. CO2-
sequestration was maximized for rock-types as follows: serpentinite—low-CO2/low-T;
iv
Peridotites sequestered the most CO2. CO2-sequestration was modeled as a function of
solution pH, total alkalinity (TA), temperature (T), pCO2, dissolved inorganic carbon (DIC),
and/or total dissolved solids (TDS) via multiple linear regression. Rock-agnostic models
were also generated so CO2-sequestration could be predicted when solution/groundwater chemistry was known but rock type wasn’t. Empirical relationships between TDS and TA
were established for each rock-type for rapid, field-based assessment.
Elemental (Mg/Ca-Sr/Ca-Ba/Ca) and isotopic (87Sr/86Sr-δ18O-δ13C)
chemostratigraphy of a well-stratified carbonate vein from the Del Puerto Ophiolite
(California) revealed that carbonate-formation waters within the system have transitioned
between domination by meteoric waters, marine limestones, and ultramafic rocks. Although
these periodic flow-changes are likely caused by carbonate-precipitation-induced
fracture-sealing, such fracture sealing did not destroy the permeability of these systems—
demonstrating that CO2-sequestration in natural ultramafic deposits is not necessarily
self-limiting.
These results advance basic understanding of CO2-induced silicate weathering—one
of few globally scalable mechanisms of sequestering atmospheric CO2 over human
v
ACKNOWLEDGEMENTS
I would like to thank my advisor, Dr. Justin Ries, for the opportunity to do this work.
I would also like to thank all of my committee members, Dr. Brent McKee, Dr. Jaye Cable,
Dr. Drew Coleman, and Dr. Sarah Carmichael, for their support—academic, logistical, and
otherwise—through this long and challenging process. Thanks also to: John Gunnell, M.S.,
for his assistance with the principal component analysis; Veronica Butler, Maite Ghazaleh,
and Aaron Gross for their assistance with the various stages of sample preparation and
analysis; and Dr. John Diemer and John Watkins of UNC-Charlotte for the use of their lab
and their assistance.
I would also like to thank Calera Corporation for the generous funding that made this
work possible. Acknowledgment is also made to the Donors of the American Chemical
Society Petroleum Research Fund, for support (or partial support) of this research.
Lastly, I would like to thank my parents, Brian and Trudy Westfield, and all of my
friends for their much needed support through all the good times and bad times.
A doctorate involves much more than simply performing and presenting a scientific
vi
TABLE OF CONTENTS
LIST OF TABLES ... xiii
LIST OF FIGURES ... xiv
CHAPTER 1: INTRODUCTION Consequences of increased atmospheric partial pressure of carbon dioxide ...1
Strategies for slowing the rise of atmospheric partial pressure of carbon dioxide ...2
Background ...4
The role of ultramafic and mafic rocks in sequestering carbon dioxide from the Earth’s early atmosphere ...4
The potential rol of ultramafic and mafic rocks in sequestering anthropogenic carbon dioxide ...5
Prior MAP Research ...10
Research Objectives ...14
Objective #1 ...15
Overview ...15
Field sampling ...16
Reactor design ...17
Analytical methods ...19
Objective #2 ...21
Overview ...21
Field sampling ...21
Analytical methods ...22
vii
Overview ...22
Field sampling ...23
Analytical methods ...24
Objective #4 ...25
Overview ...26
Analytical methods ...26
BIBLIOGRAPHY ...27
CHAPTER 2: FLUID-ROCK-GAS BATCH REACTIONS Introduction ...33
Use of mafic/ultramafic rocks for sequestration via Mineralization ...35
Mineralization equations ...36
Determination of reaction kinetics of different rock types ...37
Methods...37
Field Sites...37
Experimental Technique ...39
Analytical Techniques ...41
ICP-MS/OES...41
SEM-EDS ...41
LOI/LOA...42
TA/DIC/pH/TDS...42
Grain Size...43
Results and Discussion ...43
viii
Frank Intermediate Rock (Figure 2.3) ...44
Snake River Flood Basalt (Figure 2.4) ...44
Newdale Dunite (Figure 2.5) ...45
Webster Websterite (Figure 2.6) ...46
Mendocino Serpentinite (Figure 2.7) ...46
Del Puerto Peridotite (Figure 2.8) ...47
Complexion Spring Peridotite (Figure 2.9) ...47
Analytical variable vs. time ...55
pH vs. time (Figure 2.10) ...55
TDS vs. time (Figure 2.11) ...56
TA vs. time (Figure 2.12) ...57
DIC vs. time (Figure 2.13) ...58
Aqueous [Ca2+], [Mg2+] vs. time (Figure 2.14)...59
[CO32-] vs. time (Figure 2.15) ...61
Solid carbonate vs. time (Figure 2.16) ...62
Total CO2 sequestered (Figure 2.17) ...63
Grain Size...66
Intermediate Rock Type ...71
Basalt Rock Type ...74
Dunite Rock Type ...76
Websterite Rock Type...78
Serpentinite Rock Type...80
ix
CS Peridotite Rock Type ...83
Treatment Comparisons ...85
SEM-EDS ...88
Source Materials ...89
Reacted Samples ...100
Carbonate from SEM-EDS ...116
Conclusions ...117
BIBLIOGRAPHY ...120
CHAPTER 3: CARBONATE EVOLUTION WITHIN A NATURAL ULTRAMAFIC CO2 SEQUESTRATION SYSTEM Introduction ...123
Geology ...125
Methods...128
Field Sampling and Analysis ...128
13 C and 18O ...129
Principle Component Analysis (PCA) ...130
Results and Discussion ...130
Vein carbonate chemostratigraphy ...130
87 Sr/86Sr ...131
87 Sr/86Sr vs. 1/Sr ...132
87 Sr/86Sr vs. 1/Sr vs. elemental concentrations in vein carbonate ...134
Principle Component Analysis (PCA) ...136
x
Temporal and Spatial Variation in the DPO Groundwater
System ...141
Large-Scale System Changes ...142
(1) Water Availability ...142
(2) Location of meteoric rainfall ...143
(3) Aquifer development ...143
Conclusions ...145
BIBLIOGRAPHY ...146
CHAPTER 4: COMPARISON OF NATURAL SEQUESTRATION SYSTEMS TO LABORATORY REACTIONS FOR POTENTIAL ASSESSMENT OF FUTURE MAP ROCK TYPES Introduction ...150
Geology ...151
Del Puerto Ophiolite ...152
Complexion Spring Peridotite...153
Mendocino Serpentinite ...153
Frank Intermediate ...153
Newdale Dunite ...154
Webster Websterite ...154
Snake River Flood Basalt...154
Methods...155
Three-Phase Batch Reactions ...155
ICP-MS/OES...156
LOI/LOA...157
xi
Total CO2 Sequestered ...158
Multiple Linear Regressions ...158
Results and Discussion ...158
Reactions vs. Natural Waters ...159
TA (Figure 4.3) ...159
DIC (Figure 4.4)...161
TDS (Figure 4.5) ...162
pH (Figure 4.6)...163
pCO2 (Figure 4.7)...165
Total CO2 (Figure 4.8) ...166
Variable Proxy ...168
TA vs. DIC ...168
TA vs. TDS ...169
TA vs. pH ...171
Individual Rock Type Multiple Linear Regression Models ...175
Mixed Lithology Multiple Linear Regression Models ...184
Conclusions ...189
BIBLIOGRAPHY ...192
CHAPTER 5: CONCLUSIONS Objective #1: Conduct laboratory batch reactions to constrain the kinetics of intermediate/mafic/ultramafic fluid- rock-CO2 reactions under various CO2 and temperature scenarios ...194
xii
as in-ground sites for sequestering and storing
anthropogenic CO2 as carbonate minerals ...204
Objective #3: Investigate the isotopic/elemental geochemistry and carbonate mineralogy of secondary carbonate
deposits within natural ophiolite sequences to determine the sources of groundwater, alkalinity and divalent cations that are involved in the precipitation of
these carbonates ...208
Objective #4: Develop numerical models from natural and experimentally derived data to be used for rapid assessment of sequestration potential of a mafic or
ultramafic rock deposit ...211
BIBLIOGRAPHY ...217
APPENDIX A: SEM-EDS PROBE ANALYSES ...218
APPENDIX B: GEOCHEMICAL DATA USED FOR MLR
xiii
LIST OF TABLES
2.1. Select points and all points Mg/Si ratios for each rock type ...89
2.2. Average Mg/Si ratio for select reacted grains and the percent difference from the rock type source material ...100
4.1. Dunite rock type MLR models ...176
4.2. CS Peridotite rock type MLR models ...177
4.3. Basalt rock type MLR models ...179
4.4. DP Peridotite rock type MLR models ...180
4.5. Intermediate rock type MLR models ...182
4.6. Websterite rock type MLR models ...183
4.7. Serpentinite rock type MLR models ...184
4.8. All rock type combined MLR models with and without natural samples at all temperatures ...186
4.9. All rock types combined MLR models without natural water samples at 25⁰C ...187
xiv
LIST OF FIGURES
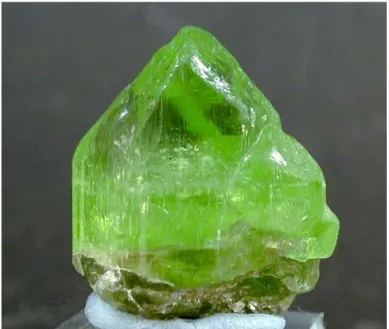
1.1. Olivine—a key reactant in the MAP process ...5
1.2. A: Idealized ophiolite sequence (from Philpotts and Ague, 2009). B: Emplacement of the Samail Ophiolite in Oman through obduction (from Searle and Cox, 1999) ...7
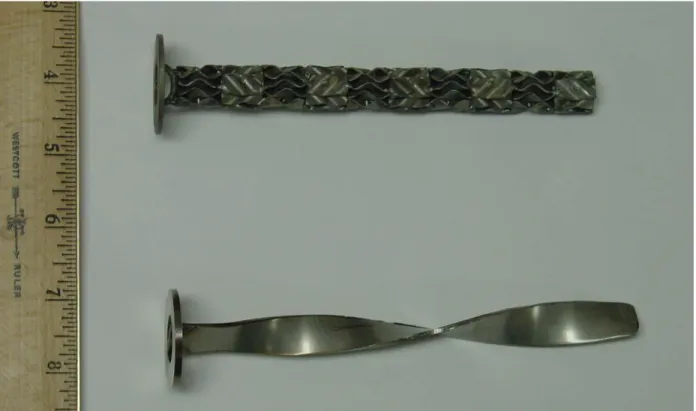
1.3. Internal mixing inserts used by Penner et al. (2005) during flow-loop reactor experiments ...11
1.4. Calculated change in solution pH of typical basalt groundwater as a function of pCO2 and its effects on olivine dissolution. Dashed lines represent calculated pH assuming that equilibrium is established with calcite and magnesite (from McGrail et al., 2006) ...12
1.5. Effect of temperature on olivine reactivity (from Gerdemann et al., 2003) ...13
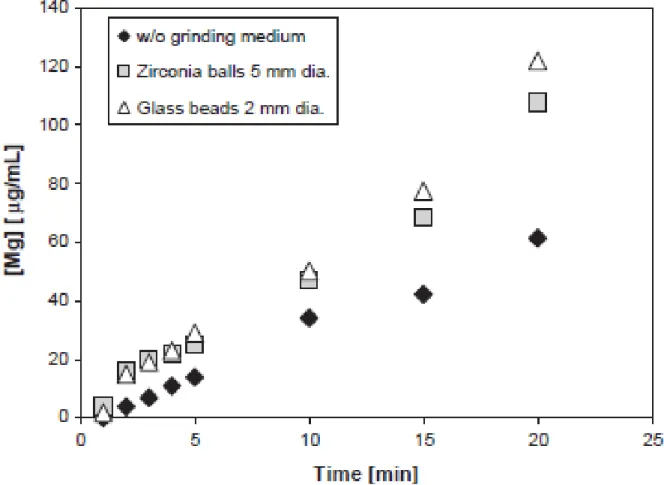
1.6. Effect of internal grinding, via addition of glass beads and zirconium balls, on serpentine reactivity under neutral pH (from Park and Fan, 2004) ...14
1.7. Sampling localities and rock types ...17
1.8. A. Three-phase (fluid-gas-rock) batch reactor system. B. Batch reactions in progress ...18
1.9. Picture of DPO carbonate vein showing the approximate sampling area (black box) ...23
1.10. Extinct DPO spring ...24
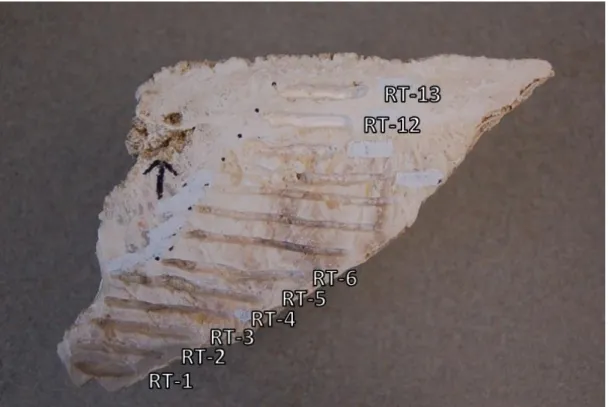
1.11. Upper portion of sampled carbonate vein from the DPO ...25
2.1. Map of sample sites and rock types ...39
xv
2.3. pH, TDS, TA, DIC, [CO32-], [Ca2+], [Mg2+], percent solid carbonate, and total CO2 sequestered vs. time for the Frank
Intermediate ...48
2.4. pH, TDS, TA, DIC, [CO32-], [Ca2+], [Mg2+], percent solid carbonate, and total CO2 Sequestered vs. time for the Idaho Flood Basalt ...49
2.5. pH, TDS, TA, DIC, [CO32-], [Ca2+], [Mg2+], percent solid carbonate, and total CO2 sequestered vs. time for the Newdale Dunite ...50
2.6. pH, TDS, TA, DIC, [CO32-], [Ca2+], [Mg2+], percent solid carbonate, and total CO2 sequestered vs. time for the Webster Websterite ...51
2.7. pH, TDS, TA, DIC, [CO32-], [Ca2+], [Mg2+], percent solid carbonate, and total CO2 sequestered vs. time for the for the Mendocino Serpentinite ...52
2.8. pH, TDS, TA, DIC, [CO32-], [Ca2+], [Mg2+], percent solid carbonate, and total CO2 sequestered vs. time for the Del Puerto Peridotite...53
2.9. pH, TDS, TA, DIC, [CO32-], [Ca2+], [Mg2+], percent solid carbonate, and total CO2 sequestered vs. time for the Complexion Spring Peridotite...54
2.10. pH versus time for all treatments ...56
2.11. TDS versus time for all treatments ...57
2.12. TA versus time for all treatments ...58
2.13. DIC versus time for all treatments ...59
2.14. Aqueous [Ca2+], [Mg2+] versus time for all treatments ...60
2.15. [CO32-] versus time for all treatments ...61
2.16. Solid MgCO3 precipitate versus time for all treatments ...63
xvi
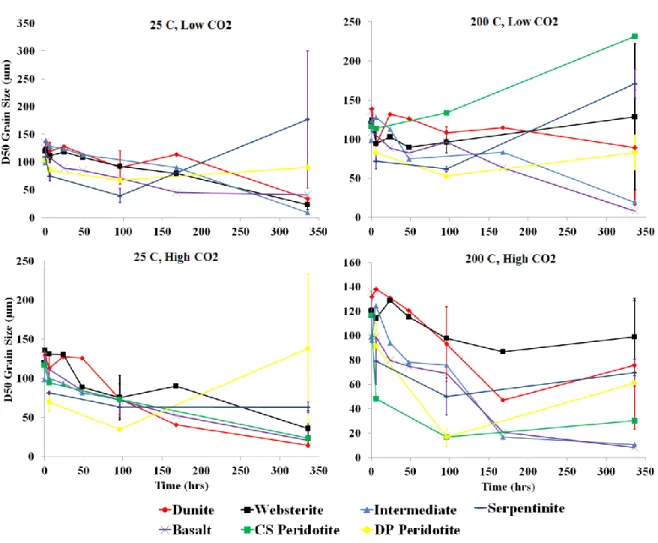
2.18. Changes in D50 grain size over time for dunite, websterite, DP peridotite, CS peridotite, and intermediate rock types
under each treatment ...69
2.19. Changes in D50 grain size over time for basalt and serpentinite
rock types under each treatment. ...70
2.20. Changes in D50 grain size over time for each rock
type and each condition ...71
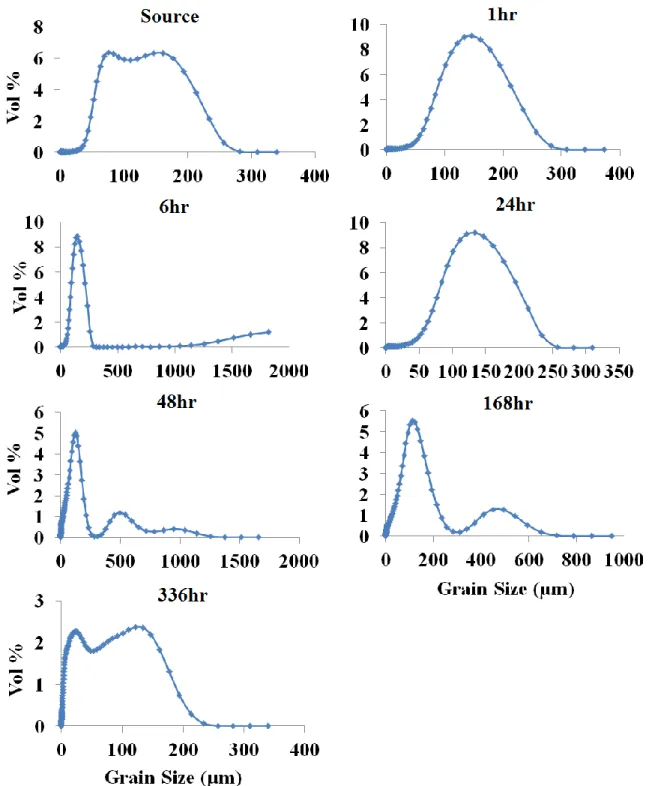
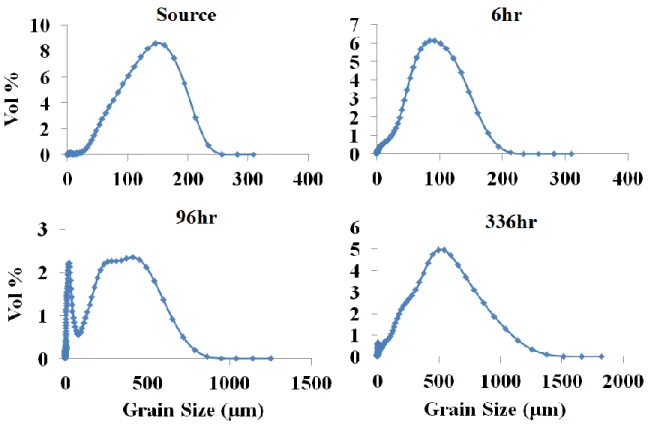
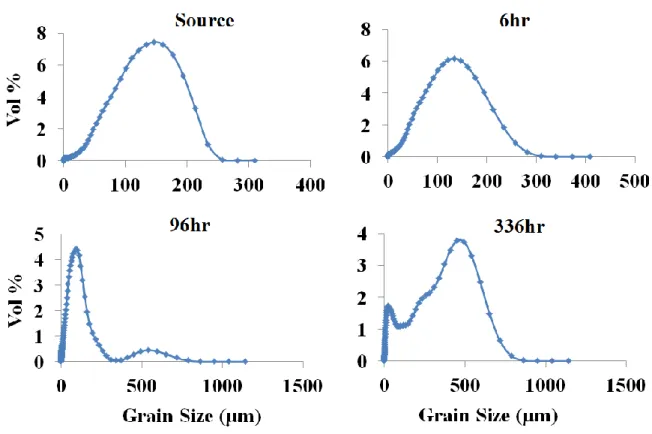
2.21. Grain size range (in vol%) for each sample over time for the
intermediate 200⁰C, low-CO2 treatment ...73
2.22. Grain size range (in vol%) for each sample over time for the
basalt 200⁰C low-CO2 treatment ...75
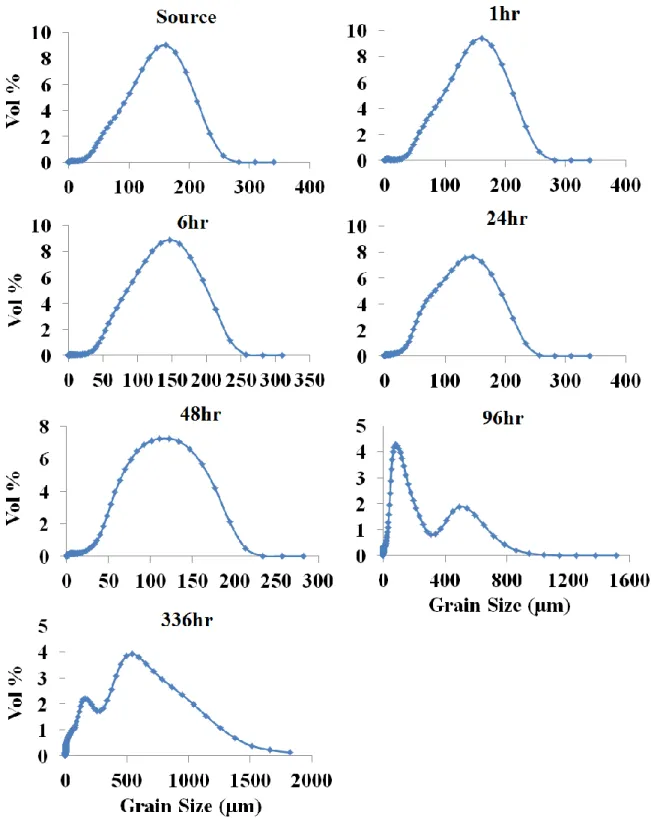
2.23. Grain size range (in vol%) for each sample over time for the
dunite 200⁰C low-CO2 treatment ...77
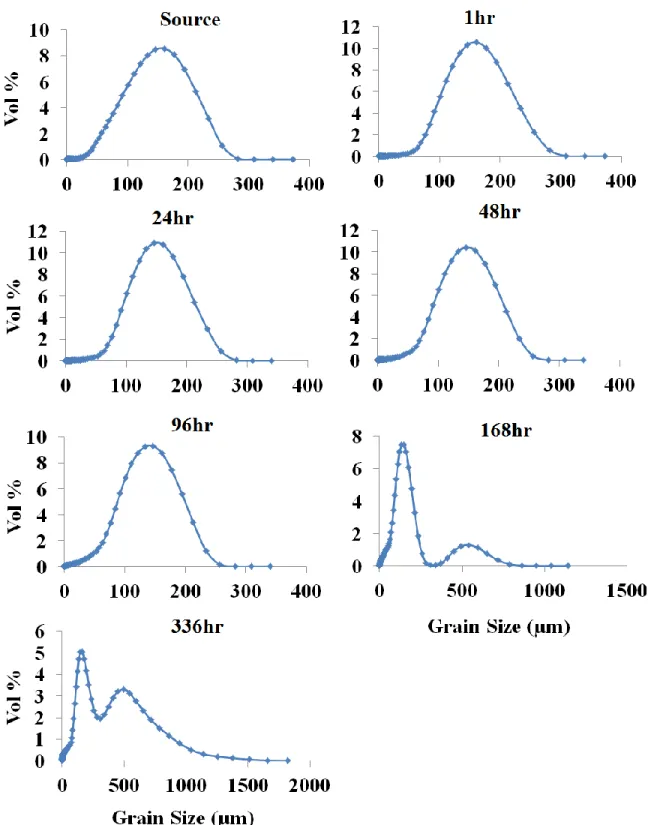
2.24. Grain size range (in vol%) for each sample over time for the
websterite 200⁰C low-CO2 treatment ...79
2.25. Grain size range (in vol%) for each sample over time for the
serpentinite 25⁰C low-CO2 treatment ...81
2.26. Grain size range (in vol%) for each sample over time for the
DP peridotite25⁰C, low-CO2 treatment ...82
2.27. Grain size range (in vol%) for each sample over time for the
DP peridotite 200⁰C, low-CO2 treatmen ...83
2.28. Grain size range (in vol%) for each sample over time for the
CS Peridotite 200⁰C high-CO2 treatment ...85
2.29. The averaged D50 grain sizes for all for all rock types across
treatments at sample times of 6, 96, and 336 hours ...86
2.30. SEM micrograph and EDS maps of grain 2 of the intermediate
source material ...93
2.31. SEM micrograph and EDS maps of grain 4 of the basalt source
Material ...94
2.32. SEM micrograph and Mg, Si EDS maps of grain 4 of the dunite
xvii
2.33. SEM micrograph and EDS maps of grain 2 of the websterite
source material ...96
2.34. SEM micrograph and EDS maps of grain 5 of the DP
peridotite source material ...97
2.35. SEM micrograph of grain 5 from CS peridotite source material ...98
2.36. SEM micrograph and EDS maps from grains 5 and 6 of
the serpentinite source material ...99
2.37. SEM micrograph of grain 2 from the basalt 200⁰C
high-CO2168 hour material ...106
2.38. SEM micrograph and EDS maps for Mg and Si of an agglomerated grain in the basalt 200⁰C high-CO2168
hour material ...107
2.39. SEM micrograph of grain 2 from dunite 200⁰C low-CO2
336 hour material ...108
2.40. SEM micrograph of grain 3 from websterite 200⁰C
low-CO2 168 hour material ...109
2.41. SEM micrograph and EDS maps of grain 1 from DP
peridotite 25⁰C low-CO2 6 hour material ...110
2.42. SEM micrograph of a grain 5 from DP peridotite 25⁰C
low-CO2 6 hour material ...111
2.43. SEM micrograph of grains 2 and 3 from CS peridotite
25⁰C high-CO2 336 hour material ...112
2.44. SEM micrograph and EDS maps of grain 6 from the
CS peridotite 25⁰C high-CO2 6 hour reacted material ...113
2.45. SEM micrograph and EDS maps of grain 2 from
serpentinite 200⁰C low-CO2 336 hour material ...114
2.46. SEM micrograph and EDS maps of grain 7 from serpentinite
200⁰C low-CO2 336 hour material ...115
3.1. Geologic map of the DPO and surrounding area. (From
xviii
3.2. Picture of DPO carbonate vein showing the approximate
sampling area (black box) ...129
3.3. Chemostratigraphic trends of [Ca2+], [Mg2+], [Ba2+], and [Sr2+], 87Sr/86Sr isotopic ratios, and 13C and 18O stable isotopic ratios. Colors indicate primary driver of precipitating fluid chemistry; yellow for ultramafic rock, green for ancient marine carbonate rock, and blue
for meteoric water ...131
3.4. 87Sr/86Sr verses 1/Sr. The arrows indicate the increasing chemical control on the precipitating fluid from different rock:water interactions (meteoric water, ultramafic rock,
and ancient marine carbonate...133
3.5. 87Sr/86Sr versus 1/Sr versus normalized elemental
concentration. The colors indicate the three predicted main geochemical controls (blue = meteoric water, yellow = ultramafic rock, green = ancient carbonate rock). The data point size
indicates the relative concentration within each element (Mg, Ca, and Ba). A. shows the normalized [Mg2+] concentrations of each sample. B. shows the normalized [Ca2+] concentrations of each sample. C. shows the normalized [Ba2+] concentrations of each sample. The dashed lines define the quadrants of the three main geochemical controls. The ranges of absolute elemental
concentrations are listed in the legend ...135
3.6. The principle component analysis of all samples and all
geochemical/isotopic values. The same colors from Figure 3.5 have been applied to the sample IDs (blue = meteoric water,
green = ancient marine carbonates, yellow = ultramafic rock) ...137
3.7. Comparison of 18O and Ca# (Ca#=Ca/(Ca+Mg)) as a function of distance from grain boundary for a carbonate cement found on a serpentinized clast in Del Puerto Creek
(from Blank et al., 2009) ...139 3.8. 18O vs. 13C for the carbonate vein samples. The same
coloring for the different sample groups is used here ...140
3.9. Modified figure from Kelemen et al. (2011) of 13C and 18O samples from various carbonate precipitates with he values from the DPO carbonate vein (black dots circled in yellow and black) their minor inverse relationship, represented by the black
xix
4.1. Map of sample sites and rock types ...152
4.2. Three-phase (fluid-rock-gas) batch reactors ...155
4.3. Comparison of TA found in natural water samples and
the four reaction conditions. The line is a linear fit for all data ...160
4.4. Comparison of DIC found in natural water samples and
the four reaction conditions ...162
4.5. Comparison of TDS found in natural water samples and
the four reaction conditions ...163
4.6. Comparison of pH found in natural water samples and
the four reaction conditions ...165
4.7. Comparison of pCO2 found in natural water samples and
the four reaction conditions ...166
4.8. Comparison of the Total CO2 sequestered in natural samples
and the four reaction conditions ...167
4.9. TA vs DIC for dunite, basalt, CS peridotite, and DP peridotite under all temperature conditions and CO2 treatments. The lines represent linear fits for individual
rock types and the R2 value is the goodness of fit ...169
4.10. TA vs TDS for dunite, basalt, CS peridotite, and DP peridotite under all temperature conditions and CO2 treatments. The lines represent linear fits for individual
rock types and the R2 value is the goodness of fit ...170
4.11. TA vs pH for dunite, basalt, CS peridotite, and DP peridotite at 25⁰C. The lines represent linear fits for individual rock
types and the R2 value is the goodness of fit ...172
4.12. TA vs pH for dunite, basalt, CS peridotite, and DP peridotite at 200⁰C. The lines represent linear fits for individual rock
types and the R2 value is the goodness of fit ...174
5.1. Total CO2 sequestered versus time for all treatments ...197
5.2. Scanning electron micrographs of CS peridotite grains. A. CS peridotite source material. Boxed area indicates MgCO3
precipitate. B. CS 200 high-CO2 6 hour reacted material. Boxed
xx
5.3. SEM micrograph and EDX map of Mg and Si for a grain
from the Serp 200 low-CO2 336 hour sample ...199
5.4. SEM micrograph of a conglomerate grain from the Bas 200
high-CO2168 hour sample...200
5.5. Change in D50 for the intermediate, basalt, dunite, websterite,
and serpentinite rock types throughout each batch reaction ...202
5.6. Change in D50 for the CS peridotite and DP peridotite rock
types throughout each batch reaction ...203
5.7. Comparison of TA found in natural water samples and the
four reaction conditions. The line is a linear fit for all data ...205
5.8. Comparison of the Total CO2 sequestered in natural samples and
the four reaction conditions ...206
5.9. 87Sr/86Sr verses 1/Sr. 1/Sr is the inverse measure of the Sr concentration. The arrows indicate the increasing aqueous chemical control from different rock:water interactions (meteoric water, ultramafic rock,
and ancient marine carbonate...209
5.10. 87Sr/86Sr versus 1/Sr versus relative elemental concentration. The colors indicate the three predicted main geochemical controls (blue = meteoric water, yellow = ultramafic rock, green = ancient carbonate rock). The data point size indicates the relative concentration within each element (Mg, Ca, and Ba). A. shows the relative [Mg2+] concentrations of each sample. B shows the relative [Ca2+]
concentrations of each sample. C shows the relative [Ba2+] concentrations of each sample. The dashed lines define the
1
CHAPTER 1: INTRODUCTION
Consequences of increased atmospheric partial pressure of carbon dioxide
It is predicted that the anthropogenic elevation of atmospheric pCO2 will result in serious
environmental repercussions, with global warming and ocean acidification producing the most
critical impacts.
Global warming is caused by increased levels of atmospheric CO2, a ‘greenhouse gas’,
trapping solar radiation between the Earth’s surface and the outer atmosphere. This global
warming will cause warming in both terrestrial and marine systems, which is predicted to cause
increased storm frequency and intensity (Emanuel, 2005), increased river flooding (Christensen
and Christensen, 2003), more intense droughts (Sheffield and Wood, 2008), melting of polar ice
caps (Yafeng and Shiyin, 2000), rising sea level (IPCC, 2007), and changing ocean circulation
patterns (Toggweiler and Russell, 2008).
Ocean acidification is the depression of ocean pH via increased absorption of
atmospheric CO2 by the oceans, creating increased concentration of carbonic acid (Kleypas et al.,
2006). Ocean acidification will impair calcification rates of marine calcifying organisms, such as
corals, mollusks, and algae (e.g. Ries et al., 2009; Fabry et al., 2009). Ocean acidification may
also change the speciation of metals in seawater (Millero, 2009), alter the behavior of
soundwaves in seawater, and impact acid-base chemistry, even in non- induced changes in the
2
Strategies for slowing the rise of atmospheric partial pressure of carbon dioxide Strategies proposed to combat the predicted rise in anthropogenic CO2 include the
taxation of carbon emissions (Pearce, 1991), limiting carbon emissions through cap and trade
legislation (Stavins, 2008), mandating increased efficiencies for automobiles and other fossil-fuel
powered devices (Leduc et al., 2003), development and use of more renewable energy sources
such as solar, wind, and hydroelectric power (Turner, 1999), terrestrial carbon sequestration
(Post and Kwon, 2000), storage in the deep sea (Fujioka et al., 1995), storage in basinal brine
reservoirs (Bachu, 2000), geological carbon capture and storage (CCS) (Gibbins and Chalmers,
2008), and the mineralization of fossil-fuel derived CO2 via aqueous precipitation (MAP)
(Seifritz, 1990).
Carbon capture and storage is the process of pressurizing gaseous CO2 to a supercritical
state and storing it in depleted subsurface oil and gas reservoirs. Although geological CCS is
presently the primary strategy employed for the industrial sequestration of anthropogenic CO2,
recent work (Damen et al., 2006) has shown that the high buoyancy of supercritical CO2 causes it
to migrate through the overlying geological strata and reenter the atmosphere over relatively
short timescales.
The MAP process sequesters anthropogenic CO2 as solid carbonate minerals via reaction
with naturally occurring and globally abundant ultramafic and mafic rocks, such as peridotites,
serpentinites, and basalts (Seifritz, 1990). Reaction of anthropogenic CO2 and fluids with the
silicate minerals within these ultramafic and mafic rocks increases the alkalinity, pH, and
concentration of divalent cations (Ca2+, Mg2+, Fe2+) in the resulting solution. These are the three
required components for natural precipitation of solid carbonate material. Industrial exploitation
3
with anthropogenic CO2 gas, causing the precipitation of solid carbonate phases, such as Ca-,
Mg-, and FeCO3. MAP therefore confers the advantage, over conventional geological CCS, of
locking anthropogenic CO2 in a solid mineral phase that is stable under atmospheric conditions
over geologic timescales. Carbonate minerals already comprise 30% of sedimentary rocks on the Earth’s surface and are the Earth’s largest sink of atmospheric CO2 by several orders of
magnitude (Boggs Jr., 1995).
Fossil-fuel-fired power generation is the largest source of anthropogenic CO2 to the
atmosphere and cement production is the third largest source. The United States used 122 million
metric tons of cement and its 2,775 power plants produced 2.5 billion tons of CO2 in 2006. At
least one company is proposing to use CO2 and excess heat from power plant flue gas in the
MAP process to simultaneously sequester anthropogenic CO2 as solid carbonate mineral, while
producing a carbon-negative cement as a byproduct (Biello, 2008). This approach would
simultaneously reduce CO2-emissions from two of the world’s top sources of anthropogenic
CO2, while generating a useful byproduct.
An important requirement for implementation of MAP CO2-sequestration is that the
anthropogenic CO2 must either be generated in or transported to a region that has an abundance
of ultramafic/mafic rock material. Alternatively, the ultramafic/mafic rocks can be mined and
transported to sites of CO2 generation. Regardless, the closer the sources of CO2 and
ultramafic/mafic rock deposits, the lower the costs of the MAP process. O’Connor et al. (2004)
identified seven major ultramafic regions within the United States that have the potential to
sequester substantial quantities of anthropogenic CO2. He estimates that these seven regions have
the potential to sequester 100% of US CO2 emissions over the next 33 years (463 Mt of CO2 per
4
An important challenge to implementing MAP sequestration involves the relatively low
efficiency of the process. The primary objective of the proposed research is to conduct controlled
laboratory experiments to investigate rates of MAP CO2 sequestration for a range of igneous and
metamorphic rock types under various pCO2 and temperature regimes. A second objective of the
proposed research is to investigate the chemostratigraphy of a carbonate vein deposit within a
terrestrial ophiolite deposit to elucidate how atmospheric CO2 is naturally sequestered in an
ultramafic system. Comparison of naturally carbonating waters to those resulting from laboratory
reactions could indicate how well an industrial process mimics the natural system. Finally, the
experimental results and natural carbonates can be used to create models to provide the general
sequestration potential of various mafic and ultramafic deposits.
Background
The role of ultramafic and mafic rocks in sequestering carbon dioxide from the Earth’s early atmosphere
Early in Earth history, atmospheric pCO2 was very high, in excess of 10-times modern
levels (Morse and Mackenzie, 1998), due to intense, global-scale volcanism (Stanley, 2004).
Such high levels of atmospheric pCO2 led to highly acidic (pH=6.5±0.2) rain and ocean waters
(Morse and Mackenzie, 1998). This high atmospheric pCO2 was ultimately drawn down to near
modern levels by the reaction of atmospheric CO2 with mafic and ultramafic rocks that
composed the Earth’s young crust. Atmospheric and dissolved CO2 reacted with the mafic and
5
ultramafic rocks was Earth’s primary mechanism of sequestering the large quantity of CO2 in the
early atmosphere.
The potential role of ultramafic and mafic rocks in sequestering anthropogenic carbon dioxide
The process of CO2 mineralization via reaction with ultramafic/mafic rocks relies upon
the unique properties of the magnesium-iron silicate mineral olivine (Figure 1.1). The weathering
of olivine in an aqueous solution will increase the alkalinity, pH, and concentration of divalent
cations (Ca2+, Mg2+, Fe2+) of that solution. The elevated alkalinity and pH converts dissolved
CO2 into carbonate anions (CO32-). The divalent cations will react with the CO32- to precipitate
solid carbonate minerals (Ca-, Mg-, and FeCO3). Olivine is found in highest concentrations in
ultramafic (e.g., peridotite, pyroxenite, serpentinite) and mafic (e.g., basalt) igneous and
metamorphic rocks.
6
A mafic rock contains >50% mafic minerals, such as olivine, pyroxene, and amphibole
(Philpotts and Ague, 2009). Flood basalts are globally abundant mafic rocks that form from the
volcanic eruption of low-viscosity magma, which spreads laterally over the ocean floor or
continent through which it erupts. Continental flood basalts are regarded as the mafic rock with
the greatest potential for industrial CO2 mineralization because of their high olivine content and
their abundance on continents, which makes them easier to acquire than seafloor basalts (O’Connor et al., 2004). Continental flood basalt deposits can be hundreds of thousands to
millions of km3 in volume (Oelkers et al., 2008). Several of these large flood basalt deposits (or ‘traps’) are easily accessible on the continents: the Columbia River Plateau and the Snake River
Basalt Flood Plain in the northwestern United States; the Deccan Traps of central India; and the
Siberian Traps in northern Russia (McGrail et al., 2006; Oelkers et al., 2008).
Ultramafic rocks contain >90% mafic minerals, are generally dark in color, and are found
within ophiolite deposits (Philpotts and Ague, 2009). An ophiolite is a suite of ultramafic, mafic,
and sedimentary rocks that were originally deposited on the seafloor and were subsequently
obducted onto a continent at a subduction zone (Figure 1.2B) or uplifted within a mountain range
and exhumed by erosion (Dilek and Robinson, 2003; Shervais, 2001). The stratigraphic structure
of an idealized ophiolite mirrors seafloor stratigraphy (Figure 1.2A). Limestones in the upper
portions of ophiolites were deposited as biogenic carbonates that settled out of the water column
and covered the ocean floor. The extrusion of magma along the mid-ocean ridge created the
underlying basaltic pillow lava. Beneath the pillow lavas are basaltic, sheeted dikes and sills.
Beneath the sheeted dikes and sills is a thick section of non-cumulate gabbro, underlain by
cumulate gabbro. Beneath the cumulate gabbro are cumulate ultramafics, which are underlain by
7
Figure 1.2: A. Idealized ophiolite sequence (from Philpotts and Ague, 2009). B. Emplacement of
the Samail Ophiolite in Oman through obduction (from Searle and Cox, 1999).
Serpentine is a metamorphic mineral that is an important component of ophiolites. It
forms from the hydrothermal alteration of olivine within ophiolites as they are uplifted and
weathered along zones of tectonic activity (Coleman and Keith, 1971). Serpentinization of
olivine increases the pH, alkalinity and concentration of divalent cations in ophiolitic
groundwaters, which can lead to the precipitation of various carbonate minerals within and/or
proximal to the serpentine via the mineralization processes. Various industrially relevant
materials are obtained from ophiolites. The chrysotile polymorph of serpentine is the primary
source of asbestos. Ophiolites have also been mined for chromite minerals, as well as for
valuable metals such as gold, palladium, iridium, etc. (Leblanc and Violette, 1983; Oshin and
Crocket, 1982; Thayer, 1964). Because of their economic value, most major ophiolite deposits
8
ultramafic rocks for MAP-sequestration can sometimes be extracted at relatively low marginal
cost, especially when coupled with ancillary mining activity.
Prior research on ophiolites has been focused on their tectonic history and their mineral
and ore resources (Evarts and Schiffman, 1983; Hagstrum, 1998; Harper et al., 1994; Lipin,
1984; Snoke, 1977). Much of the research into ophiolite systems in the western United States is
centered on the tectonic origins of the discontinuous ophiolite bodies located throughout the
Coastal Range of central California (Shervais et al., 2004), on hydrothermal terrains in northern
California (Goff, 1999), and on the process of serpentinization (Barnes et al., 1972).
Ophiolites can produce hydrologic systems with anomalously high alkalinity (>9400 µEq/L, Neal and Shand, 2002) and pH (>12.00, Barnes and O’Neil, 1969). The pioneering works
of Feth et al. (1960) and Barnes and O’Neil (1969), which investigated high alkaline/pH fluids in
ultramafic deposits in central and northern California, catalyzed broad interest in this unique
groundwater system. Barnes et al. (1978) subsequently expanded their work on ophiolites and
low-temperature serpentinization to include ophiolites from other areas of the world, including
New Caledonia, Yugoslovia, and Oman. Kresic and Papic (1990) used the groundwater
chemistry of ophiolites in Yugoslovia to constrain their model of subsurface geology in the
region. Blank et al. (2009) investigated the microbial activity in the highly alkaline waters of the Del Puerto ophiolite (DPO), originally studied by Barnes and O’Neil (1969), as a potential
analog for primitive life on Mars.
Seifritz' (1990) initial proposal to sequester anthropogenic CO2 via reaction with
ultramafic minerals has led to more thorough and detailed investigations of the utility of
ultramafic/mafic rock deposits and high-alkaline spring waters in the MAP process. McGrail et
9
et al. (2008) investigated CO2 injection in permeable basalts in Iceland (CarbFix project). Teir et
al. (2005) investigated the use of acetic acid to extract Ca2+ from silicates for use in the MAP
process.
Matter and Keleman (2008) conducted an in-depth investigation into the carbonation
potential of the Samail Ophiolite, in Oman. They found that two distinct water types result from
the weathering of the ultramafic rocks within the ophiolite. Type 1 waters are rich in Mg2+ and
HCO3- and results from early stage reaction between groundwater and peridotites. Type 2 waters
are rich in Ca2+ and OH- with pH approaching 12 and result from late stage reactions between
groundwater and peridotites. They found that addition of CO2 to each water type resulted in rapid
precipitation of their corresponding carbonate mineral (MgCO3, CaCO3) and sequestration of the
added CO2.
The MAP reaction can be summarized in three steps:
Step 1 describes the hydration of CO2 when dissolved in water, forming carbonic acid
(H2CO3) that rapidly dissociates into free hydrogen (H+) and bicarbonate (HCO3-) ions. Step 2
describes the hydrolysis of the silicate mineral, in this case olivine, which generates free Mg2+
and silicic acid (H4SiO4). Step 3 describes carbonate mineralization. Free magnesium bonds with free bicarbonate to form solid magnesite (MgCO3) and free hydrogen ions (O’Connor et al.,
2004). Calcium and iron bearing silicates may also be used in place of, or in concert with,
10
(FeCO3), respectively. Hydrated magnesium silicates, serpentine [Mg3Si2O5(OH)4], can also be
used as a mineralization reactant. Serpentine will react with CO2 and water to form magnesite and silicic acid (Equation 6) (O’Connor et al., 2004).
Prior MAP Research
Most prior investigations of the carbonation potential of silicate rocks have focused on a
single mafic/ultramafic rock type (Huijgen et al., 2006), on optimizing the MAP process with
chemical additives and under various physical conditions (Park and Fan, 2004; Gerdemann et al.,
2007), and on reactor and process design (Penner et al, 2005). Workers have also begun
exploring how this natural process may be adapted to an industrial setting (Biello, 2008), both as
a strategy for sequestering carbon released via fossil fuel combustion and as a source of
carbon-negative building materials, such as cement (conventional cement production is carbon-positive).
Huijgen et al. (2006) conducted laboratory experiments to investigate the viability of
wollastonite, a calcium silicate, in MAP sequestration. They found that wollastonite carbonated
more rapidly (70% conversion to carbonate in 15 min) than its Mg-rich mineral counterparts, but
such high reactions rates required grinding the rock particles to a minute size (<38 µm).
Wollastonite is also less abundant on continents than Mg-rich silicates, which makes it less
11
Chemical additions to the MAP process have also been shown to improve its efficiency.
Gerdemann et al. (2007) found that use of a NaHCO3-NaCl solution instead of distilled water
increased the reactive potential of all tested minerals (olivine, serpentine, and wollastonite).
Penner et al. (2005) investigated the effectiveness of various mixing devices, as well as
the impact of temperature and pressure on reactions rates, within a flow-loop reactor. They found
that a simpler inline mixer design was less efficient than more complex inserts, but was much
less prone to clogging and maintained twice the flow rate of the more complex inserts (Figure
1.3).
Figure 1.3: Internal mixing inserts used by Penner et al. (2005) during flow-loop reactor
12
McGrail et al., (2006) illustrated how increased CO2 partial pressure increases the
dissolution rate of basalt and the concentrations of Ca2+ and Mg2+ in the product solution, but
reduces the pH due to increased carbonic acid (Figure 1.4). Temperature also impacts MAP
kinetics. Gerdemann et al. (2003) found that olivine was most reactive at 185⁰C (Figure 1.5).
Figure 1.4: Calculated change in solution pH of typical basalt groundwater as a function of
partial pressure of carbon dioxide and its effects on olivine dissolution. Dashed lines represent
calculated pH assuming that equilibrium is established with calcite and magnesite (from McGrail
13
Figure 1.5: Effect of temperature on olivine reactivity (from Gerdemann et al., 2003).
Park and Fan (2004) assessed the impact of various physical pre-treatments on the
reactivity of serpentine. Ultrasonic agitation and internal grinding were shown to remove layers
of SiO2 that precipitated on the reactant grain surfaces during MAP sequestration, which inhibit
further rock-water interaction. Addition of glass beads to fluidized serpentine was shown to be a
14
Figure 1.6: Effect of internal grinding, via addition of glass beads and zirconium balls, on
serpentine reactivity under neutral pH (from Park and Fan, 2004).
Research Objectives
The central objective of the proposed research is to investigate the viability of igneous
rocks (ultramafic, mafic, and intermediate) as sources of alkalinity and divalent cations for
mineralizing anthropogenic CO2. This has been accomplished through four independent, yet
15
(1) Conduct laboratory batch reaction experiments to constrain the kinetics of
intermediate/mafic/ultramafic rock-fluid-CO2 reactions under various CO2 and
temperature regimes.
(2) Analyze the carbonate and cation geochemistry of high-pH spring waters issuing
from mafic/ultramafic deposits to assess the viability of these rock deposits as in-ground
sites for sequestering and storing anthropogenic CO2 as carbonate minerals.
(3) Investigate the isotopic/elemental geochemistry and carbonate mineralogy of
secondary carbonate deposits within natural ophiolite sequences to determine the sources
of groundwater, alkalinity and divalent cations that are involved in the precipitation of
these carbonates.
(4) Develop numerical models from natural and experimentally derived data to be used
for rapid assessment of sequestration potential of a mafic/ultramafic rock deposit.
Objective #1:
Perform batch reactions to constrain the kinetics of intermediate/mafic/ultramafic
rock-fluid-CO2 reactions under various CO2 and temperature scenarios.
Overview
Pulverized igneous and metamorphic rock samples were sieved to a specific size fraction
rock-16
water samples were be taken at different intervals throughout the reaction and separated via
vacuum filtration. The solid samples were dried in a N2 atmosphere, to prevent oxidation of Fe
grains, and the water sample saved and stored to preserve their geochemistry. Solid samples were
scraped from the filters following drying and stored for later analyses.
Samples from batch reactions were subjected to a large suite of analyses to generate a
time series of the reactions. Solid field samples and reaction products were be analyzed for
elemental composition, mineralogy, carbonate content, grain size, and micron-scale structure.
Aqueous field samples and reaction products were analyzed for pH, total dissolved solids (TDS),
total alkalinity (TA), dissolved inorganic carbon (DIC), and elemental composition.
Field sampling
Seven individual rock types were used for this research, which include two peridotites
(DP peridotite: 37°24'30.70"N, 121°24'32.80"W, CS peridotite: 39°10'12.85"N,
122°30'39.37"W) and a serpentinite from the Coastal Range of Northern California
(38°45'52.60"N, 122°35'43.01"W), a flood basalt from the Snake River Plain of Idaho
(43⁰18'12.09" N, 116⁰31'13.77" W), a dunite (35°54'41.09"N, 82°11'17.13"W) and intermediate
rock type (36° 3'44.60"N, 82° 0'34.92"W, hereafter referred to as ‘intermediate’) from the
northern Blue Ridge Mountains of North Carolina, and a websterite (35°20'31.60"N,
83°12'54.18"W) from the southern Blue Ridge Mountains of North Carolina (Figure 1.7). Rock
samples were trimmed of weathered surfaces, crushed, and sieved to a specified grain-size
interval for use in subsequent MAP reactions. Concentrations of major, minor, and trace
17 Figure 1.7: Sampling localities and rock types.
Reactor design
Three-phase (fluid-gas-rock) batch reactors (Figures 1.8A-B) were employed in these
experiments. 200 g of crushed rock, sieved to a grain size range of 40-180 µm, and 3 L of DI
water were added to a 4 L Pyrex glass flask with attached glass reflux condenser. Each reactor
was placed on a 10-inch stirring hotplate with digital temperature control. The reaction solutions were stirred constantly with a 1” magnetic stir-bar and heated to either 25 or 200 °C. Water for
the glass reflux condenser was chilled with a ½ hp chiller and continuously circulated through
the reflux condensers to limit evaporation of fluids from the reactors, but to allow gas to escape
freely. One of two gas types was introduced to the reactors: (1) pure CO2 or (2) a mixture of N2 +
air (yielding an average of ~44 ppm pCO2). All rock powders were filter-washed with acetone
and allowed to dry prior to the start of the experiment in order to remove fine grain
18
Figure 1.8: A. Three-phase (fluid-gas-rock) batch reactor system. B. Batch reactions in progress.
Approximately 350 mL samples of the reaction slurry were obtained at 1, 6, 24, 48, 96,
168, and 336 hour intervals throughout the experiment via a plastic syringe with an attached rigid
plastic sampling tube. Each sample was filtered through a 0.4 μm cellulose filter. All filtering
was performed in a N2-gas filled glove box to minimize oxidation of Fe minerals in the reaction
products. 50 mL of filtrate was apportioned for pH measurement, followed by acidification with
18% HNO3 in order to stabilize it for future elemental analyses. The remaining filtrate was stored
in a glass-stoppered borosilicate glass bottle and refrigerated for subsequent TA and DIC
analyses. The solid samples were allowed to dry in the N2-gas filled glovebox with constant N2
19
masses and water volumes (100 g/1.5 L), while maintaining the same rock:water ratio. Sampling
frequency was reduced for these reactions (6, 96, and 336 hours) due to lower overall volume
availability.
Methods
ICP-MS/OES were used to measure the elemental composition of both solid and aqueous
samples. These analyses indicate the pathways by which various elements migrate from within
the source rock into the liquid and solid reaction products.
The amount of carbonate produced within each reaction was obtained via loss-on-ignition
(LOI) and loss-on-acidification (LOA) techniques. During the LOI process, samples are
combusted at varying temperatures such that organic material is removed and then carbonate is
removed. Mass measurements at each step allow for calculation of carbonate percentages (Heiri
et al., 2001). During the LOA process, carbonate is removed via dissolution in weak HCl acid.
The latter technique is better suited for serpentines, which dehydrate at elevated temperatures, as
well as basalt, which forms hydrophilic zeolites that take up water immediately after the final
stage of heating and result in false carbonate masses.
A scanning electron microscope (SEM) was used to generate micron-scale images
of individual grains within the solid source material and solid reaction products. These images
show how the individual grains have changed physically as well as where carbonate has
precipitated within the grain structures. The Energy Dispersive Spectrometer (EDS) within the
SEM provides the major elemental composition of individual grains and precipitated carbonates.
This allows for mapping of the changes in elemental composition of the grains from the core to
20
The pH and TDS of the reaction fluids were measured with a single-junction Ag/AgCl
glass electrode calibrated with NBS buffers (NIST-traceable) and a conductivity probe designed
for high TDS fluids (K=10), respectively. Field waters were measured with a portable field pH
meter. pH and TDS are both necessary for calculating the other carbonate system parameters and
are indicative of the reactivity of the different rock types under the various experimental
conditions.
Total alkalinity (TA) and dissolved inorganic carbon (DIC) of all aqueous samples were
measured concurrently via closed-cell potentiometric titration and coulometry, respectively. TA
is the best indicator of the carbonate mineralization potential for a given fluid/rock type. DIC
reveals the molar quantity of CO2 dissolved within the fluid. Combination of the DIC and the
solid carbonate precipitated will yield the total sequestered CO2 (Total CO2) at each time point
for each reaction. TA and DIC are also used along with TDS, temperature, and pH in calculating
the remaining carbonate system parameters.
Grain size was measured for all solid reaction samples using a laser particle size analyzer.
Solid sample is added to a constantly recirculating water stream that passes through a bank of
detectors, yielding a distribution curve of the average grain sizes (McCave et al., 1986). These
distribution curves can be used as indicators of reactive surface availability within the samples as
21 Objective #2:
Perform geochemical analysis of high-pH spring waters issuing from mafic/ultramafic
deposits to constrain water/rock reactions and assess their potential for in-situ carbon dioxide
sequestration.
Overview
Reaction dynamics between sampled rock and spring waters can be inferred by
comparing geochemical analyses of the mafic/ultramafic rocks and the natural spring waters
issuing from these deposits. These field-based relationships were compared to rock-water
relationships derived from the laboratory batch reactions to determine how well the laboratory
process mimics the natural process.
Field sampling
Natural spring waters were obtained from mafic/ultramafic deposits in the Coastal Range
of Northern California, the Blue Ridge province of western North Carolina, and the Snake River
Flood Basalt Plains of southwestern Idaho (Figure 1.7). Water samples were obtained from the
major rock types to be investigated in the laboratory reaction experiments. Samples were
obtained as near to the spring source as possible. These sites include various locations
throughout the DPO (7 samples), Complexion Springs (2 samples), the Snake River Plain basalts
(1 sample), Webster (16 samples), Bartlett Springs, California (1 sample), and near Newman
Springs, California (1 sample). Three separate water samples were taken from each site. Samples
for TA and DIC analyses were stored in 500 mL sealed borosilicate glass bottles. Samples for
22
and stored in 50 mL plastic vials. Bulk 1 L samples were stored in HDPE Nalgene bottles.
Concentrations of most major, minor, and trace elements, total inorganic carbon, total alkalinity,
and pH were determined for each of the sampled spring waters.
Analytical methods
Water analyses were performed as described previously for the aqueous batch reaction
samples.
Objective #3:
Investigation of the isotopic/elemental geochemistry and carbonate mineralogy of
secondary carbonate deposits within natural ophiolite sequences to determine the sources of
groundwater, alkalinity and divalent cations that are involved in the precipitation of these
carbonates.
Overview
A large carbonate vein (Figure 1.9) was deposited within the Del Puerto Ophiolite (DPO)
by an extinct subsurface spring (Figure 1.10). The vein carbonate was sampled at discrete layers
and analyzed for elemental chemistry, 87Sr/86Sr, 13
C, and 18O isotopic composition.
Elemental/isotopic analyses of the carbonate vein’s layers, which appear to have been deposited
sequentially, provide insight into the elemental and isotopic composition of the groundwater
present at the time of precipitation of the vein. These analyses, in combination with chemical
23
composition of the vein’s formation waters, ultimately leading to the precipitation of the
carbonate vein.
Figure 1.9: Picture of Del Puerto Ophiolite carbonate vein showing the approximate sampling
area (black box).
Field sampling
Secondary carbonate deposits were sampled from the various ultramafic/mafic collection
sites (Fig. 1.7). A large carbonate vein deposit was sampled within the DPO (Figure 1.10).
Surface spring cements and fracture-veins were also sampled within the DPO. Secondary
carbonate precipitates associated with basalts were sampled from the Snake River Flood Basalt
24
websterite in Webster, NC—the type locality for this mineral—and from an ultramafic rock
outcrop near Newman Springs. Carbonate samples were obtained from active precipitation sites
at Bartlett Springs in NC and Complexion Springs in CA.
Figure 1.10: Extinct DPO spring.
Analytical methods
Each layer within the DPO carbonate vein found in the DPO was sampled using a dental drill with 1/16” diamond bit (Figure 1.11). These samples were analyzed for elemental chemistry
25
performed using a thermal ionization mass spectrometer (TIMS). 87Sr/86Sr serves as an indicator
of original water source and the general rock types with which the water has interacted in the
subsurface. 18O and 13C were measured with an isotope ratio mass spectrometer (IRMS), and
also serve as an indicator of water source. Combining these isotopic data with elemental
composition help constrain rock-water interactions that have occurred over the life of the spring
that produced the carbonate vein.
Figure 1.11: Upper portion of sampled carbonate vein from the Del Puerto Ophiolite.
Objective #4:
Develop numerical models from natural and experimentally derived data to be used for
26 Overview
Production of simple numerical models that can be used to assess the sequestration
potential of various known or unknown rock deposits could be very valuable for determining
viable in-situ sequestration sites. These simple models will make use of variables that can either
be measured in the field or relatively easily in the laboratory. This would significantly cut the
initial costs of site assessment and possibly increase the viability of the in-situ MAP process.
Analytical Methods
Multiple linear regression analysis was employed to construct numerical models that can
be used to assess the potential Total CO2 (dissolved CO2 + solid carbonate) of a rock deposit.
MLR uses multiple explanatory variables (x1, x2, … xp), such as TA, TDS, pH, Temperature,
pCO2, etc., to create a predictive model for the dependent variable y (Total CO2), by fitting an
equation to the observed data (Zar, 1999). Model output includes the numerical model itself, Pr,
which measures the significance of the variables, R2, which is the goodness of fit of the model,
and the Akaike information criterion (AIC), which measures the general quality of the model
(Zar, 1999). Measuring the various explanatory variables and applying them to a given model
will result in a predicted Total CO2 in g CO2 Sequestered/kg Source Rock. By using these models
in the field or laboratory, an investigator could determine whether or not a specific field location
27
BIBLIOGRAPHY
Andrews, J. E., Riding, R., & Dennis, P. F. (1993). Stable isotopic compositions of Recent freshwater cyanobacterial carbonates from the British Isles: local and regional environmental controls. Sedimentology, 40(2), 303-314.
Arcilla, C. A., Pascua, C. S., & Russell Alexander, W. (2011). Hyperalkaline groundwaters and tectonism in the Philippines: Significance to natural carbon capture and sequestration. Energy Procedia, 4, 5093-5101.
Bachu, S. (2000). Sequestration of CO2 in geological media: criteria and approach for site selection in response to climate change. Energy Conversion and Management, 41(9), 953-970.
Barnes, I., & O’Neil, J. R. (1969). The relationship between fluids in some fresh alpine-type ultramafics and possible modern serpentinization, western United States. Geological Society of America Bulletin, 80(10), 1947-1960.
Barnes, I., Rapp, J. B., O'Neil, J. R., Sheppard, R. A., & Gude III, A. J. (1972). Metamorphic assemblages and the direction of flow of metamorphic fluids in four instances of serpentinization. Contributions to Mineralogy and Petrology, 35(3), 263-276.
Barnes, I., O’Neil, J. R., & Trescases, J. J. (1978). Present day serpentinization in New Caledonia, Oman and Yugoslavia. Geochimica et Cosmochimica Acta,42(1), 144-145.
Barnes, I. V. A. N., Downes, C. J., & Hulston, J. R. (1978). Warm springs, South Island, New Zealand, and their potentials to yield laumontite. American journal of science, 278(10), 1412-1427.
Benson, L. V., Lund, S. P., Burdett, J. W., Kashgarian, M., Rose, T. P., Smoot, J. P., & Schwartz, M. (1998). Correlation of late-Pleistocene lake-level oscillations in Mono Lake, California, with North Atlantic climate events. Quaternary Research, 49(1), 1-10.
Biello, D. (2008). Cement from co2: a concrete cure for global warming. Scientific American, Retrieved from http://www.scientificamerican.com/article.cfm.
Blank, J. G., Green, S. J., Blake, D., Valley, J. W., Kita, N. T., Treiman, A., & Dobson, P. F. (2009). An alkaline spring system within the Del Puerto Ophiolite (California, USA): A Mars analog site. Planetary and Space Science, 57(5), 533-540.
Boschi, C., Dini, A., Dallai, L., Ruggieri, G., & Gianelli, G. (2009). Enhanced CO2-mineral sequestration by cyclic hydraulic fracturing and Si-rich fluid infiltration into serpentinites at Malentrata (Tuscany, Italy). Chemical Geology, 265(1), 209-226.
28
Christensen, J. H., & Christensen, O. B. (2003). Climate modeling: severe summertime flooding in Europe. Nature, 421(6925), 805-806.
Coleman, R. G., & Keith, T. E. (1971). A chemical study of serpentinization—Burro Mountain, California. Journal of Petrology, 12(2), 311-328.
Damen, K., Faaij, A., & Turkenburg, W. (2006). Health, safety and environmental risks of
underground CO2 storage–overview of mechanisms and current knowledge. Climatic
Change, 74(1-3), 289-318.
Degens, E. T., & Epstein, S. (1964). Oxygen and carbon isotope ratios in coexisting calcites and dolomites from recent and ancient sediments. Geochimica et Cosmochimica Acta, 28(1), 23-44.
Dilek, Y., & Robinson, P. T. (2003). Ophiolites in earth history. Geological Society of London Special Publication, 218, 717.
Emanuel, K. (2005). Increasing destructiveness of tropical cyclones over the past 30 years. Nature, 436(7051), 686-688.
Evarts, R. C., & Schiffman, P. (1983). Submarine hydrothermal metamorphism of the Del Puerto ophiolite, California. American Journal of Science, 283(4), 289-340.
Fabry, V. J., Seibel, B. A., Feely, R. A., & Orr, J. C. (2008). Impacts of ocean acidification on marine fauna and ecosystem processes. ICES Journal of Marine Science: Journal du Conseil, 65(3), 414-432.
Feth, J. H., Rogers, S. M., & Roberson, C. E. (1961). Aqua de Ney, California, a spring of unique chemical character. Geochimica et Cosmochimica Acta,22(2), 75-86.
Fouke, B. W., Farmer, J. D., Des Marais, D. J., Pratt, L., Sturchio, N. C., Burns, P. C., & Discipulo, M. K. (2000). Depositional facies and aqueous-solid geochemistry of travertine-depositing hot springs (Angel Terrace, Mammoth Hot Springs, Yellowstone National Park, USA). Journal of Sedimentary Research,70(3), 565-585.
Fujioka, Y., Ozaki, M., Takeuchi, K., Shindo, Y., Yanagisawa, Y., & Komiyama, H. (1995). Ocean CO2 sequestration at the depths larger than 3700 m. Energy Conversion and Management, 36(6), 551-554.
Geological Survey (US), & Davis, G. H. (1961). Geologic Control of Mineral Composition of Stream Waters of the Eastern Slope of the Southern Coast Ranges, California-Geochemistry of Water. US Government Printing Office.
29
Gerdemann, S. J., O'Connor, W. K., Dahlin, D. C., Penner, L. R., & Rush, H. (2007). Ex-situ aqueous mineral carbonation. Environmental Science & Technology, 41(7), 2587-2593.
Gibbins, J., & Chalmers, H. (2008). Carbon capture and storage. Energy Policy,36(12), 4317-4322.
Goff, F., & Guthrie, G. (1999). Field Trip Guide to Serpentinite, Silica-Carbonate Alteration, and Related Hydrothermal Activity in the Clear Lake Region, California (No. LA-13607-MS). Los Alamos National Lab., NM (US).
Goldstein, J., Newbury, D. E., Joy, D. C., Lyman, C. E., Echlin, P., Lifshin, E., & Michael, J. R. (2003). Scanning electron microscopy and X-ray microanalysis. Springer.
Hagstrum, J. T., & Jones, D. L. (1998). Paleomagnetism, paleogeographic origins, and uplift history of the Coast Range ophiolite at Mount Diablo, California. Journal of Geophysical Research: Solid Earth (1978–2012), 103(B1), 597-603.
Harper, G. D., Saleeby, J. B., & Heizler, M. (1994). Formation and emplacement of the Josephine ophiolite and the Nevadan orogeny in the Klamath Mountains, California-Oregon: U/Pb zircon and 40Ar/39Ar geochronology. Journal of geophysical research, 99(B3), 4293-4321.
Heiri, O., Lotter, A. F., & Lemcke, G. (2001). Loss on ignition as a method for estimating organic and carbonate content in sediments: reproducibility and comparability of results. Journal of Paleolimnology, 25(1), 101-110.
Hughes, L. (2000). Biological consequences of global warming: is the signal already apparent?. Trends in Ecology & Evolution, 15(2), 56-61.
Huijgen, W. J., Witkamp, G. J., & Comans, R. N. (2006). Mechanisms of aqueous wollastonite carbonation as a possible CO2 sequestration process. Chemical Engineering Science, 61(13), 4242-4251.
Kelemen, P. B., & Matter, J. (2008). In-situ carbonation of peridotite for CO2 storage. Proceedings of the National Academy of Sciences, 105(45), 17295-17300.
Kelemen, P. B., Matter, J., Streit, E. E., Rudge, J. F., Curry, W. B., & Blusztajn, J. (2011). Rates and mechanisms of mineral carbonation in peridotite: natural processes and recipes for enhanced, in-situ CO2 capture and storage. Annual Review of Earth and Planetary Sciences, 39, 545-576.
Kim, S. T., & O'Neil, J. R. (1997). Equilibrium and nonequilibrium oxygen isotope effects in synthetic carbonates. Geochimica et Cosmochimica Acta,61(16), 3461-3475.
30
Kresic, N., & Papic, P. (1990). Specific chemical composition of karst groundwater in the Ophiolite Belt of the Yugoslav Inner Dinarides: A case for covered karst. Environmental Geology and Water Sciences, 15(2), 131-135.
Leblanc, M., & Violette, J. F. (1983). Distribution of aluminum-rich and chromium-rich chromite pods in ophiolite peridotites. Economic Geology, 78(2), 293-301.
Leduc, P., Dubar, B., Ranini, A., & Monnier, G. (2003). Downsizing of gasoline engine: an efficient way to reduce CO2 emissions. Oil & gas science and technology, 58(1), 115-127.
Lipin, B. R. (1984). Chromite from the Blue Ridge Province of North Carolina. American Journal of Science, 284(4-5), 507-529.
McCrea, J. M. (1950). On the isotopic chemistry of carbonates and a paleotemperature scale. The Journal of Chemical Physics, 18, 849.
McGrail, B. P., Schaef, H. T., Ho, A. M., Chien, Y. J., Dooley, J. J., & Davidson, C. L. (2006). Potential for carbon dioxide sequestration in flood basalts. Journal of Geophysical Research: Solid Earth (1978–2012), 111(B12).
Mook, W. G., Bommerson, J. C., & Staverman, W. H. (1974). Carbon isotope fractionation between dissolved bicarbonate and gaseous carbon dioxide. Earth and Planetary Science Letters, 22(2), 169-176.
Morse, J. W., & Mackenzie, F. T. (1998). Hadean ocean carbonate geochemistry. Aquatic Geochemistry, 4(3-4), 301-319.
Millero, F. J. (2009). Effect of Ocean Acidification on the Speciation of Metals in Seawater. Oceanography, 22(4), 72.
Neal, C., & Shand, P. (2002). Spring and surface water quality of the Cyprus ophiolites. Hydrology and Earth System Sciences Discussions, 6(5), 797-817.
Noiriel, C., Renard, F., Doan, M. L., & Gratier, J. P. (2010). Intense fracturing and fracture sealing induced by mineral growth in porous rocks. Chemical Geology, 269(3), 197-209.
O’Connor, W. K., Dahlin, D. C., Rush, G. E., Gerdemann, S. J., & Nilsen, D. N. (2004). Final report: aqueous mineral carbonation. Albany Research Center, Albany, OR.
Oelkers, E. H., Gislason, S. R., & Matter, J. (2008). Mineral carbonation of CO2. Elements, 4(5), 333-337.
31
Park, A. H. A., & Fan, L. S. (2004). CO2 mineral sequestration: physically activated dissolution of serpentine and pH swing process. Chemical Engineering Science, 59(22), 5241-5247.
Pearce, David. "The role of carbon taxes in adjusting to global warming." The economic journal 101.407 (1991): 938-948.
Penner, L. R., Dahlin, D. C., Gerdemann, S. J., & Saha, K. K. (2005, April). Modeling flow of mineralized carbon dioxide slurry. In Proceedings 22nd Annual International Pittsburgh Coal Conference (CD-ROM) (Vol. 22, No. DOE/ARC-2005-056). Albany Research Center (ARC), Albany, OR; Mechanical and Aerospace Engineering Dept., Computational Fluid Dynamics Laboratory, Arizona State University.
Philpotts, A. R., & Ague, J. J. (2009). Principles of igneous and metamorphic petrology, 2nd Edition (p. 667). Cambridge University Press.
Post, W. M., & Kwon, K. C. (2000). Soil carbon sequestration and land‐use change: processes and potential. Global Change Biology, 6(3), 317-327.
Potty, G. R. (2009, November). Ocean acidification: Implications to underwater acoustics. In Ocean Electronics (SYMPOL), 2009 International Symposium on (pp. 106-109). IEEE.
Quade, J., Cerling, T. E., & Bowman, J. R. (1989). Systematic variations in the carbon and oxygen isotopic composition of pedogenic carbonate along elevation transects in the southern Great Basin, United States. Geological Society of America Bulletin, 101(4), 464-475.
Ries, J. B., Cohen, A. L., & McCorkle, D. C. (2009). Marine calcifiers exhibit mixed responses to CO2-induced ocean acidification. Geology, 37(12), 1131-1134.
Searle, M., & Cox, J. (1999). Tectonic setting, origin, and obduction of the Oman ophiolite. Geological Society of America Bulletin, 111(1), 104-122.
Seifritz, W. (1990). CO2 disposal by means of silicates. Nature, 345, 486.
Sheffield, J., & Wood, E. F. (2008). Projected changes in drought occurrence under future global warming from multi-model, multi-scenario, IPCC AR4 simulations. Climate Dynamics, 31(1), 79-105.
Shervais, J. W. (2001). Birth, death, and resurrection: The life cycle of suprasubduction zone ophiolites. Geochemistry, Geophysics, Geosystems, 2(1).
Shervais, J. W., Kimbrough, D. L., Renne, P., Hanan, B. B., Murchey, B., Snow, C. A., & Beaman, J. (2004). Multi-stage origin of the Coast Range ophiolite, California: implications for the life cycle of supra-subduction zone ophiolites. International Geology Review, 46(4), 289-315.