Comparing Outcomes with Bone Marrow or Peripheral Blood
Stem Cells as Graft Source for Matched Sibling Transplants in
Severe Aplastic Anemia across Different Economic Regions
Rajat Kumar1, Fumihiko Kimura2, Kwang Woo Ahn3, Zhen-Huan Hu3, Yachiyo
Kuwatsuka3,4, John P. Klein3, Marcelo Pasquini3, Koichi Miyamura5, Koji Kato6, Ayami Yoshimi7, Yoshihiro Inamoto8, Tatsuo Ichinohe9, William Allen Wood Jr10, Baldeep Wirk11, Matthew Seftel1, Philip Rowlings12, David I Marks13, Kirk R. Schultz14, Vikas Gupta15, Laurence Dedeken16, Biju George17, Jean-Yves Cahn18, Jeff Szer19, Jong Wook Lee20, Aloysius YL Ho21, Anders Fasth22, Theresa Hahn23, Nandita Khera24, Jignesh Dalal25, Carmem Bonfim26, Mahmoud Aljurf27, Yoshiko Atsuta28,29, and Wael Saber3
1CancerCare Manitoba, University of Manitoba, Winnipeg, MB, Canada
2Division of Hematology, National Defense Medical College, Tokorozawa, Japan
3CIBMTR (Center for International Blood and Marrow Transplant Research), Department of
Medicine, Medical College of Wisconsin, Milwaukee, WI
4Center for Advanced Medicine and Clinical Research, Nagoya University Hospital, Nagoya,
Japan
5Department of Hematology, Japanese Red Cross Nagoya First Hospital, Nagoya, Japan
6Department of Hematology and Oncology, Children's Medical Center, Japanese Red Cross
Nagoya First Hospital, Nagoya, Japan
7Department of Pediatrics and Adolescent Medicine, University of Freiburg, Freiburg, Germany
8Division of Hematopoietic Stem Cell Transplantation, National Cancer Center Hospital, Tokyo,
Japan
9Department of Hematology and Oncology, Research Institute for Radiation Biology and
Medicine, Hiroshima University, Hiroshima, Japan
10Division of Hematology/Oncology, Department of Medicine, University of North Carolina, Chapel
Hill, NC
11Division of Bone Marrow Transplant, Seattle Cancer Care Alliance, Seattle, WA
Corresponding Author: Name: Rajat Kumar; Address: CancerCare Manitoba, 675 McDermot Ave, Winnipeg, MB R3E 0V9, Canada. [email protected]; Phone: 1- 204-787-8640, Fax: 1-204-786-0196.
Contribution: RK, MP, and WS contributed to study design; FK, YK, ZH, TI and KWA contributed to data preparation; ZH, JPK and KWA performed the statistical analysis; RK, WS, MP, KWA, ZH, CB and YA participated in data interpretation, manuscript preparation and final approval; KM, KK, AY, YI, WAW, BW, MS, PR, DM, KRS, VG, LD, BG, JC, JS, JWL, AHYL, AF, TH, NK, JD, MA contributed to manuscript revisions; RK and WS gave final approval for manuscript submission.
Publisher's Disclaimer: This is a PDF file of an unedited manuscript that has been accepted for publication. As a service to our
customers we are providing this early version of the manuscript. The manuscript will undergo copyediting, typesetting, and review of
HHS Public Access
Author manuscript
Biol Blood Marrow Transplant
. Author manuscript; available in PMC 2017 May 01.Published in final edited form as:
Biol Blood Marrow Transplant. 2016 May ; 22(5): 932–940. doi:10.1016/j.bbmt.2016.01.012.
A
uthor Man
uscr
ipt
A
uthor Man
uscr
ipt
A
uthor Man
uscr
ipt
A
uthor Man
uscr
12Calvary Mater Newcastle, HAPS-Pathology North, University of Newcastle, Australia
13Pediatric Bone Marrow Transplant, University Hospitals Bristol NHS Trust, Bristol, United
Kingdom
14BC Children's Hospital and Child and Family Research Institute, Vancouver, Canada
15Department of Medical Oncology and Hematology, Princess Margaret Cancer Centre. Toronto,
Ontario, Canada
16Department of Hematology-Oncology, Hopital Universitaire des Enfants Reine Fabiola,
Brussels, Belgium
17Christian Medical College, Vellore, India
18Department of Hematology, University Hospital, Grenoble, France
19Department Clinical Haematology and Bone Marrow Transplantation, Royal Melbourne Hospital,
Victoria, Australia
20BMT Center, Seoul St. Mary's Hospital, The Catholic University of Korea, Seoul, South Korea
21Singapore General Hospital, Singapore, Singapore
22Department of Pediatrics, University of Gothenburg, Gothenburg, Sweden
23Roswell Park Cancer Institute, Buffalo, NY
24Department of Hematology/Oncology, Mayo Clinic, Phoenix, AZ
25Rainbow Babies& Children's Hospital/Case Western Reserve University, Cleveland, OH
26Hospital de Clinicas - Federal University of Parana, Curitiba, Brazil
27Department of Oncology, King Faisal Specialist Hospital Center & Research, Riyadh, Saudi
Arabia
28Japanese Data Center for Hematopoietic Cell Transplantation, Nagoya, Japan
29Nagoya University Graduate School of Medicine, Nagoya, Japan
Abstract
Bone marrow (BM) is the preferred graft source for hematopoietic stem cell transplantation (HSCT) in severe aplastic anemia (SAA) compared to mobilized peripheral blood stem cells (PBSC). We hypothesized that this recommendation may not apply to those regions where patients present later in their disease course, with heavier transfusion load and with higher graft failure rates. Patients with SAA who received HSCT from an HLA-matched sibling donor from 1995 to 2009 and reported to the Center for International Blood and Marrow Transplant Research or the Japan Society for Hematopoietic Cell Transplantation were analyzed. The study population was categorized by gross national income per capita (GNI) and region/countries into four groups. Groups analyzed were high income countries (HIC), which were further divided into US-Canada (N=486) and other HIC (N=1264), upper middle-income (UMIC) (N=482), and combined lower middle, low income countries (LM-LIC) (N=142). In multivariate analysis, overall survival (OS) was highest with BM as graft source in HIC compared to PBSC in all countries or BM in UMIC or
A
uthor Man
uscr
ipt
A
uthor Man
uscr
ipt
A
uthor Man
uscr
ipt
A
uthor Man
uscr
LM-LIC (p<0.001). There was no significant difference in OS between BM and PBSC in UMIC (p=0.32) or LM-LIC (p=0.23). In LM-LIC the 28-day neutrophil engraftment was higher with PBSC compared to BM (97% vs. 77%, p<0.001). Chronic GVHD was significantly higher with PBSC in all groups. Whereas BM should definitely be the preferred graft source for HLA-matched sibling HSCT in SAA, PBSC may be an acceptable alternative in countries with limited resources when treating patients at high risk of graft failure and infective complications.
Introduction
A combined Center for International Blood and Marrow Transplant Research (CIBMTR) and European Group for Blood and Marrow Transplantation (EBMT) report on the outcome of 692 HLA-matched sibling transplants for severe aplastic anemia (SAA) performed from 1995 to 2003, concluded that use of peripheral blood stem cells (PBSC) resulted in a worse outcome and more chronic graft-versus-host disease (GVHD) in patients younger than 20 years.1 Another study from the CIBMTR compared different stem cell sources in sibling hematopoietic stem cell transplantation (HSCT) for SAA and reached a similar conclusion.2 A more recent study from EBMT analyzed 1886 patients with SAA who received a first sibling HSCT between 1999 and 2009 and showed a survival advantage of BM over PBSC in all age groups.3 In the unrelated transplant setting too, mortality was higher in the PBSC stem cell recipients as compared to BM transplants.4 The general consensus based on these studies is that there is no benefit of PBSC over BM in reducing graft rejection, but there is an added adverse consequence of an increased GVHD, and hence there is no compelling reason to use PBSC for transplants in SAA.
Despite these recommendations, literature from developing countries suggests that PBSC is more frequently used than BM.5-9 The rationale being given is that there is a higher risk of graft failure and mortality when BM is used, although this is at variance with the large published registry data. As the majority of HSCT are performed in countries with advanced health facilities, any analysis of pooled data from international registries may predominantly reflect the outcome in more affluent countries. To assess if there were differences in
outcome in different economic regions using the two graft sources, we analyzed 2374 patients of SAA transplanted from 1995 to 2009, according to the economic regions where the transplants were performed.
Methods
This is a retrospective study of patients who had undergone their first HSCT from an HLA-matched sibling for SAA from 1995 to 2009 and reported to the CIBMTR or the Japan Society for Hematopoietic Cell Transplantation (JSHCT). The Center for International Blood and Marrow Transplant Research (CIBMTR) database is a voluntary research affiliation of more than 450 transplantation centers worldwide that contribute detailed data on all completed autologous and allogeneic hematopoietic cell transplantation (HCT) to a Statistical Center at the Medical College of Wisconsin in Milwaukee. Observational studies conducted by the CIBMTR are performed in compliance with the Health Insurance
A
uthor Man
uscr
ipt
A
uthor Man
uscr
ipt
A
uthor Man
uscr
ipt
A
uthor Man
uscr
Portability and Accountability Act (HIPAA) as a Public Health Authority, as well as all applicable federal regulations pertaining to the protection of human research participants.
The Japan Society for Hematopoietic Cell transplantation (JSHCT) collects HCT recipient clinical data in collaboration with Japan Society for Pediatric Hematology and Oncology, Japan Marrow Donor Program and cord blood banks in Japan by using the Transplant Registry Unified Management Program (TRUMP), as described previously.10 This study was approved by the data management committee of the JSHCT, and by the institutional review board of National Defense Medical College.
The data were analyzed according to the World Bank Economic classification, based on the gross national income (GNI) per capita and according to the country and region. As per the GNI, countries were divided into: high-income countries (HIC), upper middle-income countries (UMIC), lower middle-income countries (LMIC) and low-income countries (LIC). The HIC were divided into USA-Canada (US-C) and other HIC (OHIC), due to the greater representativeness of country data from US-C. The LMIC and LIC were combined into lower middle, low-income countries (LM-LIC) due to small numbers from each.11
The outcome measures were (a) Overall survival (OS): time to death from any cause with patients censored at last follow-up, (b) Neutrophil engraftment: achievement of absolute neutrophil count (ANC) ≥ 0.5 × 10⁹/L for 3 consecutive days; this was used as a marker of primary engraftment, (d) Acute GVHD, coded as present if grade 2 or greater, based on the Glucksberg grading system, (e) Chronic GVHD, including both limited and extensive disease.
Statistical Analysis
The probabilities of overall survival were calculated using the Kaplan-Meier method. Death from any cause was considered as an event and surviving patients were censored at last follow-up. Log-rank p-values were calculated to evaluate the overall differences of the survival rates between BM and PBSC. The probabilities of all other outcomes were estimated using the crude cumulative incidence function to account for competing risks (death without the event). The Gray's test p-values were calculated to evaluate the overall differences across the cumulative incidence functions. 95% confidence intervals (CI) were calculated using arcsine- square root transformation. Cox proportional hazards regression models were constructed with economic status classification and graft source as main effects. The proportional hazards assumption was tested. The covariates included in the analysis were the main effect, age, ATG/alemtuzumab, donor-recipient CMV status prior to the transplantation, time from diagnosis to transplantation, Karnofsky performance score (KPS) at the time of transplantation, conditioning regimen, GVHD prophylaxis, sex, prior therapy, and year of transplantation. Significant covariates were selected using backward elimination. Logistic regression was used for neutrophil recovery. A binary outcome variable was created based on neutrophil recovery status at day 28. The interactions between the main effect and significant covariates were also examined. All analyses were performed with SAS (SAS Institute Inc.). Having a p-value of less than 0.05 was considered statistically significant.
A
uthor Man
uscr
ipt
A
uthor Man
uscr
ipt
A
uthor Man
uscr
ipt
A
uthor Man
uscr
Results
Patient Characteristics
During the period 1995 to 2009, 2374 HLA identical sibling transplants for aplastic anemia were reported to CIBMTR (N=1814) and JSHCT (N=560). Bone marrow was used as a stem cell source in 1927 patients and PBSC in 447. Most of the transplants were from high income countries, with US-C having 486, OHIC: 1264, UMIC: 482 and LM-LIC reporting only 142 (Table 1). There were marked differences in number of transplants reported from different WHO regions, with Africa reporting 29, Americas: 896, Eastern Mediterranean: 236, Europe: 278, South East Asia: 35 and Western Pacific: 900 (country and WHO data shown in supplementary Table S1).
More males underwent transplant compared to females. The gender difference was highest in the LM-LIC and least in the higher income countries. Age at transplant was higher in PBSC compared to BM in all economic zones. Performance status was lower in PBSC recipients compared to BM, except in LM-LIC. Time to transplant was longer in PBSC group compared to BM recipients, except in LM-LIC. Prior therapy with ATG was given to a higher proportion of patients in high income countries (23%) compared to UMIC (5%) and LM-LIC (8%). Androgen as prior therapy was used in about 23% cases in LM-LIC, with lower percent in UMIC (11%) and very few in high income countries. Cyclophosphamide (Cy) and ATG (Cy-ATG) was the most common conditioning regimen, followed by Cy without ATG.
Overall Survival
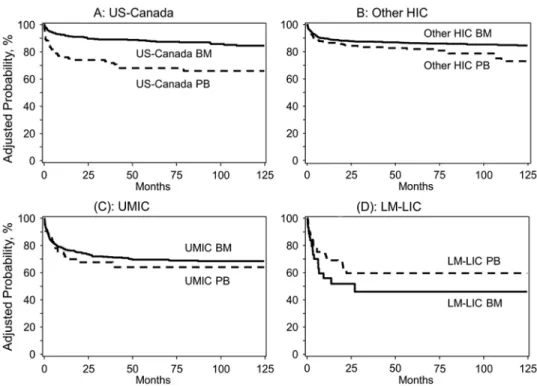
On univariate analysis, the 1-yr and 5-yr OS was significantly better with BM compared to PBSC in high- income countries (p<0.001 at both 1-yr and 5-yr for US-C; p=0.006 at 1-yr, and p=0.001 at 5-yr for other HIC) (Table 2). In UMIC at 1 and 5 years, there was a non-significant trend for better survival with BM as a graft source compared to PBSC (1-year: 76% vs. 67%, p=0.13; 5-year: 69% vs. 57%, p=0.15, respectively). In LM-LIC, there was also a non-significant trend for worse survival with BM compared to PBSC (1-year: 56% (95% CI, 39-73%) vs. 72% (61-81%), p=0.14; 5-year: 46% (27-65%) vs. 61% (49-73%), p=0.19).
On multivariate analysis, as compared to BM in US-C, the OS with BM was not
significantly different in other HIC (relative risk (RR) 1.1, p=0.71), and was inferior with BM in UMIC (RR 2.5, p<0.0001) and LMIC (RR 5.4, p<0.0001); it was also inferior with PBSC as a graft source in US-C, other HIC, UMIC, LM-LIC (RR 2.9, p<0.0001; RR 1.5, p=0.02; RR 3.1, p<0.0001; RR 3.7, p<0.0001 respectively) (Table 3). Comparing BM as a graft source between UMIC and LM-LIC, the OS was superior in UMIC (RR 0.47, p=0.002). Comparing BM and PBSC within the same GNI group, OS was not significantly different between BM and PBSC in either UMIC (RR 0.8, p=0.33) or LM-LMIC (RR1.4, p=0.23) (Fig 1a, b, c, d).
Age at transplant had a significant effect on OS, with age at transplant < 20 years showing better OS compared to ages 20-39 or ≥ 40 years (RR 1.7, p<0.0001; RR 3.97, p<0.0001). A better performance status (KPS 90% or more) showing significantly better OS compared to
A
uthor Man
uscr
ipt
A
uthor Man
uscr
ipt
A
uthor Man
uscr
ipt
A
uthor Man
uscr
poorer performance (RR 1.4, p=0.0003). The year of transplant had an influence on OS. As compared to transplants performed in the years 1995-1997, OS was better in transplants performed in the years 1998-2000, 2001-2003, 2004-2006 and 2007-2009 (RR 0.77, p=0.04; RR 0.6, p=0.0009; RR 0.5, p<0.0001; RR 0.4, p<0.0001),(Table 3). The effect of the conditioning regimen and GVHD prophylaxis on survival was analyzed, and there was no significant effect of these on OS (data not shown).
Neutrophil Engraftment
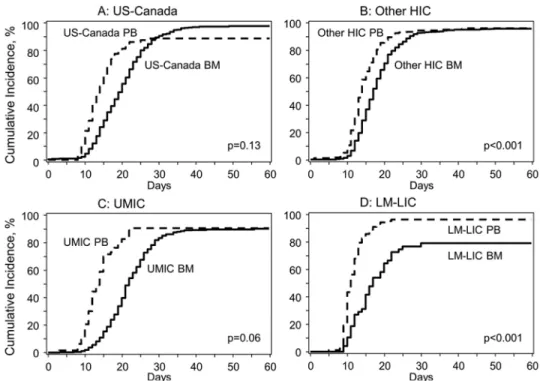
On univariate analysis, there was no significant difference in the 28-day neutrophil engraftment between the BM and PBSC groups in US-C (85% (95% CI, 81-88) vs. 89% (81-95), p=0.31) or other HIC (91% (89-92) vs. 93% (90-9%), p=0.14). There was a significantly lower 28-day neutrophil engraftment in the BM group compared to the PBSC group in UMIC (75% (95% CI, 71-79) vs. 90% (82-96), p<0.001) and LMIC (77% (64-88) vs. 97% (92-99), p=0.002) (Table 2).
On multivariate analysis for the 28-day neutrophil engraftment comparing groups within the same economic zones, there was no significant difference in neutrophil engraftment between BM and PBSC recipients within US-C (p=0.12) or other HIC (p=0.33), respectively (Table 4). In contrast, there was a significantly lower neutrophil engraftment in BM recipients compared to PBSC in UMIC (odds ratio [OR] 0.20 (95% CI, 0.047 - 0.844), p = 0.028) and LM-LIC (OR 0.057 (0.006 – 0.47), p=0.008) for the day 28 neutrophil engraftment. Comparing different economic zones, neutrophil recovery in BM recipients in US-C was lower compared to BM or PBSC recipients in OHIC (data not shown). The neutrophil engraftment as per different economic classification is shown in Figure 2.
The primary graft failures in US-C, other HIC, UMIC and LM-LIC with BM were 2%, 4%, 11% and 19% while with PBSC were 10%, 4%, 8% and 2% respectively. Secondary graft failure rates in US-C, other HIC, UMIC and LM-LIC with BM were 3%, 3%, 6% and 6% while with PBSC were 4%, 2%, 2% and 5% respectively.
Graft versus host disease
On univariate analysis, acute GVHD (grade 2-4) was higher with PBSC compared to BM in US-C and LIC (at 100-day, US-C: 20% (95% CI, 12-30) vs. 11% (8-14), p=0.05; LM-LIC: 39% (30-49) vs. 23% (12-36), p=0.04, respectively); there was no significant difference in other HIC and UMIC (at 100-day, other HIC: 16% (95% CI, 10-23) vs. 10% (8-13), p=0.11; UMIC: 10% (4-18) vs. 10% (7-13), p=0.96, respectively). Grade 3-4 acute GVHD was not different at day 100 between the two graft sources. Chronic GVHD at 1 and 5 years was higher with PBSC compared to BM in US-C (at 1-year, 31% (95% CI, 21-42) vs. 17% (14-21), p=0.02; at 5-year, 39% (29-51) vs. 22% (18-26), p=0.003); other HIC (at 1-year, 20% (14-26) vs. 11% (9-13), p=0.005; at 5-year, 25% (13-31) vs. 13% (11-16), p <0.001); UMIC, (at 1-year 28% (17-41) vs. 13% (10-17), p=0.02; at 5-year 28% (17-41) vs. 16% (13-20), p=0.07); and LM-LIC (at 1-year 43% (31-56) vs. 9% (2-22), p<0.001; at 5-year 53% (40-66) vs. 9% (2-22) p<0.001), shown in Table 2.
A
uthor Man
uscr
ipt
A
uthor Man
uscr
ipt
A
uthor Man
uscr
ipt
A
uthor Man
uscr
Cause of Death
The various causes of death are shown in Table 5. In the combined high income countries, there were few deaths due to graft failure (1.2%) or infections (2.9%) using BM as a graft source. In contrast, there were higher deaths due to graft failure and infections using BM as a graft source in UMIC (4.5% and 11.2% respectively) and LM-LIC (14.6% and 12.5% respectively). When PBSC was used as a graft source, there were more deaths due to graft failure and infections in US-C (8.7% and 12.5% respectively) compared to other HIC (1.4% and 8.6% respectively). Deaths attributed to graft failure were lower with PBSC as a graft source compared to BM in UMIC (0% vs. 4.5%, respectively) and in LM-LIC (5.3% vs. 14.6%, respectively). Deaths due to infections were lower with PBSC (7.4%) compared to BM (12.5%) in LM-LIC. Causes of death as reported to the registries have inherent limitations, as death is often caused by multiple factors.
Economic Regions
The regions classified as LM-LIC were mainly located in Asia and the Middle-East. A color figure of the map of the world, showing how the regions were divided according to their GNI is attached. (Figure 3)
Discussion
Registry based studies have the advantage of providing large, pooled, real-world data to answer clinical questions. For complex and expensive therapies like HSCT, the data would mainly be generated by centers in affluent countries, with potential for limited
generalizability in less affluent countries. Our study shows that 73.7% transplants were from the high income countries, 20.3% from upper middle income countries and only 6% percent from the LM-LIC. The increased number of transplants in the more affluent countries is expected, as the HSCT rates are closely linked with gross national income per capita. 12 The incidence of aplastic anemia is estimated to be around 2 per million in the western
world, 13-16 and is likely two to three times higher in Asia 17,18 with relatively larger number of aplastic anemia patients admitted to hospitals in Asia relative to Europe and US.19 The recent analyses on HSCT in SAA have not looked for any differences in outcomes from the less economically developed regions.1-3 If there are any differences in transplant practices and outcomes in the UM or LM-LIC these are likely to be missed in pooled registry analysis. This study was conducted to determine if any such differences exist.
Our results show that the outcomes of transplant were better in high income countries compared to UMIC and LM-LIC. The OS with BM as a graft source in US-Canada and other HIC was better than with PBSC. This finding is similar to that reported in previous studies.1,2,20 However, in UMIC and LM-LIC, there were no significant differences in OS between BM and PBSC. The likely reasons for these differences may be inferred by the differences in neutrophil engraftment, GVHD and causes of death.
There were lower neutrophil engraftment rates with BM compared to PBSC in LM-LIC and UMIC. These findings are at variance with the study by Bacigalupo et al. who did not observe any difference in engraftment between the two graft sources.3 Even in our study,
A
uthor Man
uscr
ipt
A
uthor Man
uscr
ipt
A
uthor Man
uscr
ipt
A
uthor Man
uscr
there was no difference in the combined HIC (US-Canada and OHIC) and if we had not analyzed as per GNI, we would not have detected these differences. There were higher deaths due to graft failure and infections in BM recipients compared to PBSC, in UMIC and LM-LIC. Chronic GVHD was higher in all economic zones with PBSC, as expected.
The retrospective nature of our study does not allow us to offer explanations for all the observed differences. There are also limitations of low numbers from LM and LIC and even the HIC and UMIC are not uniformly represented. These constraints are inherent in any registry data, as international participation is influenced by local resources as well as choice of other registries. Nevertheless, this analysis has the largest number of cases compared to recent registry studies on aplastic anemia.1-4 A review of literature may allow us to make logical inferences. The superior outcome in HIC compared to UMIC and LM-LIC is expected as health outcomes correlate with economic development. The World Health Statistics 2014 report shows that even in 2012, life expectancy and mortality rates in LM-LIC were inferior to those seen in HIC in 1990. While the rates in UMIC are also inferior to HIC, the differences are less marked.21 These indicators suggest that in developing
countries, socioeconomic factors, along with health care infrastructure, lag behind the economically advanced countries by many years.
Hence the past experiences of high income countries may be relevant to the present
transplant outcomes in the less economically advanced countries. In the 1970s the outcomes of transplant for SAA in HIC were inferior to current results, since graft rejection rates varied from 30% to 70% in multiply transfused patients and mortality was high in them.22-26 Over time, survival increased significantly to levels as high as 90% in the 1990s.27,28
A major cause of graft rejection is transfusion associated sensitization to minor
histocompatibility antigens due to prior blood transfusions.29,30 Comparison of transplants between transfused versus untransfused patients confirmed the finding of lower graft rejection and higher survival in untransfused patients.31,32 A cell marrow dose of < 3 × 10⁸ cells/ kg was also associated with graft rejection.27,33,34 A number of factors led to improved outcomes, such as a decrease in time from diagnosis to HSCT, transplants in untransfused patients, use of leucodepleted blood, universal leucodepletion in many countries, improvement in conditioning and better immunosuppression for GVHD.27,32,35-37
Our study shows that in UM and LM-LIC, the OS was not significantly different with BM compared to PBSC despite having a higher chronic GVHD. The rate of neutrophil recovery with PBSC in UM and-LM-LIC was significantly faster compared to BM. Deaths due to graft failure and infections were higher with BM recipients compared to PBSC group in LM-LIC as well as UMIC. This suggests that the benefits of earlier and reliable engraftment compensated for the complications of higher GVHD with PBSC.
We do not have data about the number of blood transfusions pre-HSCT and whether the blood products were leucodepleted, irradiated or CMV selected. Studies from less
economically developed countries suggest that because of delays in HSCT, patients in these countries are multitransfused with high risk of graft rejection and may be infected with high risk of graft rejection and may be infected at the time of HSCT.7,8,38,39 Patients are also at
A
uthor Man
uscr
ipt
A
uthor Man
uscr
ipt
A
uthor Man
uscr
ipt
A
uthor Man
uscr
higher risk due to CMV positivity present in almost 100% donors and recipients in many of these countries.39-41 Leucodepletion of blood is uncommon in LIC.6,35,42-44
In transplant literature, cost of transplant is not recognized as a risk factor for poor outcome, as most HIC have state or insurance funded health care. But in LM-LIC, and some UMIC, the cost of HSCT is a special concern, as majority of patients pay out of pocket.45,46 Funding is through sponsorship by government, non-governmental organizations (NGOs) and charitable organizations.6,7,38,40,44 Delay in engraftment or in resolution of infections would lead to exhaustion of funds for further treatment leading to fatality. Hence, unlike in HIC where patients can be supported for long periods of time, limited funds compel transplant programs for the fastest engraftment and independence from blood component transfusions as well as control of infections. Most centers use G-CSF to hasten neutrophil recovery.7,8 The adverse consequence of PBSC use would be a greater risk of chronic GVHD and hence a higher cost of treating this complication. For patients paying out of pocket, managing costs of chronic GVHD spread over time may be easier than arranging immediate finances for a complicated transplant admission.
It is also known that graft failure may be reduced or salvaged by increasing the number of stem cells infused, and supplementation with PBSCs.47,48 PBSCs offer advantages in terms of earlier neutrophilic engraftment, and shorter hospitalization, issues which are relevant in these countries. Hence in many developing countries, PBSC is used as the predominant or sole graft source in SAA.5,6,40,49-51 Survival rates in this high risk population, with PBSC are reported as 75-80%.40,43,49,51
Our data also showed that in LM-LIC there were lower numbers of females compared to the HIC groups, possibly representative of social factors. Additionally, there was poorer performance status, higher CMV prevalence (data not shown), delay in HSCT (from
diagnosis >3 months) and lower use of prior ATG therapy. These factors are likely indicators of poor socio-economic factors and limitations in health resources. In UMIC there was a lower use of ATG in conditioning compared to HIC which may explain the lower survival compared to BM grafts in high income countries. In US-Canada, the results of PBSC transplants were inferior compared to PBSC in other HIC, for reasons that are not clear. It is possible that in US-Canada, PBSC grafts were used in patients with pre-existing
complications in order to achieve early engraftment, and the higher mortality was partly a reflection of the underlying co-morbidities. Despite the limitations of numbers from certain countries, the differences in survival based on economic regions are provocative.
Conclusions
The major findings of our study confirm the general recommendation that the best outcomes of HSCT in SAA are with BM as a graft source.1-3 However, as there was no significant survival difference between the two graft sources in UMIC and LM-LIC, PBSC may also be an acceptable graft source in countries with resource constraints when dealing with high risk SAA patients. This should be a decision based on the assessment of risk of graft failure, earlier neutrophil recovery and shorter hospitalization versus a higher risk of chronic GVHD with its attendant long term consequences. Our study also demonstrates that pooled analysis
A
uthor Man
uscr
ipt
A
uthor Man
uscr
ipt
A
uthor Man
uscr
ipt
A
uthor Man
uscr
from registry data may miss important differences in transplant practices and outcomes in different parts of the world. Since any combined registry study dealing with expensive therapies would mainly reflect the outcomes of HIC, recommendations based on such studies should cater for variations in different economic zones to make them more relevant to the population there.
Supplementary Material
Refer to Web version on PubMed Central for supplementary material.
References
1. Schrezenmeier H, Passweg JR, Marsh JC, et al. Worse outcome and more chronic GVHD with peripheral blood progenitor cells than bone marrow in HLA-matched sibling donor transplants for young patients with severe acquired aplastic anemia. Blood. 2007; 110(4):1397–1400. [PubMed: 17475907]
2. Chu R, Brazauskas R, Kan F, et al. Comparison of outcomes after transplantation of G-CSF-stimulated bone marrow grafts versus bone marrow or peripheral blood grafts from HLA-matched sibling donors for patients with severe aplastic anemia. Biol Blood Marrow Transplant. 2011; 17(7): 1018–1024. [PubMed: 21034842]
3. Bacigalupo A, Socie G, Schrezenmeier H, et al. Bone marrow versus peripheral blood as the stem cell source for sibling transplants in acquired aplastic anemia: survival advantage for bone marrow in all age groups. Haematologica. 2012; 97(8):1142–1148. [PubMed: 22315497]
4. Eapen M, Le Rademacher J, Antin JH, et al. Effect of stem cell source on outcomes after unrelated donor transplantation in severe aplastic anemia. Blood. 2011; 118(9):2618–2621. [PubMed: 21677312]
5. Herrera-Garza J, Jaime-Perez J, Montemayor J, Ibarra-Peart R, Gomez-Almaguer D. High-dose peripheral blood stem cell transplant for multitransfused severe aplastic anaemia patients without antithymocyte globulin in the conditioning regimen. Bone Marrow Transplant. 1999; 24(8):845– 848. [PubMed: 10516694]
6. Kumar R, Prem S, Mahapatra M, et al. Fludarabine, cyclophosphamide and horse antithymocyte globulin conditioning regimen for allogeneic peripheral blood stem cell transplantation performed in non-HEPA filter rooms for multiply transfused patients with severe aplastic anemia. Bone Marrow Transplant. 2006; 37(8):745–749. [PubMed: 16518427]
7. George B, Mathews V, Viswabandya A, Srivastava A, Chandy M. Fludarabine-based reduced intensity conditioning regimens for allogeneic hematopoietic stem cell transplantation in patients with aplastic anemia and fungal infections. Clin Transplant. 2009; 23(2):228–232. [PubMed: 19402215]
8. Seth T, Kanga U, Sood P, Sharma V, Mishra P, Mahapatra M. Audit of peripheral stem cell transplantation for aplastic anemia in multitransfused infected patients. Transplant Proc. 2012; 44(4):922–924. [PubMed: 22564586]
9. Farzana T, Shamsi TS, Irfan M, Ansari SH, Baig MI, Shakoor N. Allogeneic peripheral blood stem cell transplantation for aplastic anaemia: a single centre experience. J Pak Med Assoc. 2003; 53(9): 381–384. [PubMed: 14620309]
10. Atsuta Y, Suzuki R, Yoshimi A, et al. Unification of hematopoietic stem cell transplantation registries in Japan and establishment of the TRUMP System. Int J Hematol. 2007; 86(3):269–274. [PubMed: 17988995]
11. [accessed 13 December 2014] Definition of region groupings: World Health Organization. 2014.
http://www.who.int/healthinfo/global_burden_disease/definition_regions/en/
12. Gratwohl A, Baldomero H, Aljurf M, et al. Hematopoietic stem cell transplantation: a global perspective. JAMA. 2010; 303(16):1617–1624. [PubMed: 20424252]
A
uthor Man
uscr
ipt
A
uthor Man
uscr
ipt
A
uthor Man
uscr
ipt
A
uthor Man
uscr
13. Mary JY, Baumelou E, Guiguet M. Epidemiology of aplastic anemia in France: a prospective multicentric study. The French Cooperative Group for Epidemiological Study of Aplastic Anemia. Blood. 1990; 75(8):1646–1653. [PubMed: 2183887]
14. Montane E, Ibanez L, Vidal X, et al. Epidemiology of aplastic anemia: a prospective multicenter study. Haematologica. 2008; 93(4):518–523. [PubMed: 18322256]
15. Maluf EM, Pasquini R, Eluf JN, Kelly J, Kaufman DW. Aplastic anemia in Brazil: incidence and risk factors. Am J Hematol. 2002; 71(4):268–274. [PubMed: 12447955]
16. Young NS, Kaufman DW. The epidemiology of acquired aplastic anemia. Haematologica. 2008; 93(4):489–492. [PubMed: 18379007]
17. Issaragrisil S, Kaufman DW, Anderson T, et al. The epidemiology of aplastic anemia in Thailand. Blood. 2006; 107(4):1299–1307. [PubMed: 16254144]
18. Yong AS, Goh AS, Rahman M, Menon J, Purushothaman V. Epidemiology of aplastic anaemia in the state of Sabah, Malaysia. Med J Malaysia. 1998; 53(1):59–62. [PubMed: 10968139]
19. Young NS, Issaragrasil S, Chieh CW, Takaku F. Aplastic anaemia in the Orient. Br J Haematol. 1986; 62(1):1–6. [PubMed: 3942690]
20. Bacigalupo A, Locatelli F, Lanino E, et al. Fludarabine, cyclophosphamide and anti-thymocyte globulin for alternative donor transplants in acquired severe aplastic anemia: a report from the EBMT-SAA Working Party. Bone Marrow Transplant. 2005; 36(11):947–950. [PubMed: 16205733]
21. World Health Statistics 2014. [accessed 17 January 2015] Switzerland: World Health Organization. 2014. http://www.who.int/gho/publications/world_health_statistics/2014/en/
22. Storb R, Thomas ED, Buckner CD, et al. Allogeneic marrow grafting for treatment of aplastic anemia. Blood. 1974; 43(2):157–180. [PubMed: 4149232]
23. Storb R, Prentice RL, Thomas ED. Marrow transplantation for treatment of aplastic anemia. An analysis of factors associated with graft rejection. N Engl J Med. 1977; 296(2):61–66. [PubMed: 136605]
24. U.C.L.A Bone Marrow Transplant Team. Bone-marrow transplantation in severe aplastic anaemia. Lancet. 1976; 308(7992):921–923.
25. Advisory Committee of the International Bone Marrow Transplant Registry. Bone marrow transplantation from donors with aplastic anemia. A report from the ACS/NIH bone marrow transplant registry. JAMA. 1976; 236(10):1131–1135. [PubMed: 781333]
26. Storb R, Prentice RL, Thomas ED, et al. Factors associated with graft rejection after HLA-identical marrow transplantation for aplastic anaemia. Br J Haematol. 1983; 55(4):573–585. [PubMed: 6231046]
27. Stucki A, Leisenring W, Sandmaier BM, Sanders J, Anasetti C, Storb R. Decreased rejection and improved survival of first and second marrow transplants for severe aplastic anemia (a 26-year retrospective analysis). Blood. 1998; 92(8):2742–2749. [PubMed: 9763558]
28. Storb R, Leisenring W, Anasetti C, et al. Long-term follow-up of allogeneic marrow transplants in patients with aplastic anemia conditioned by cyclophosphamide combined with antithymocyte globulin. Blood. 1997; 89(10):3890–3891. [PubMed: 9160700]
29. Storb R, Epstein RB, Rudolph RH, Thomas ED. The effect of prior transfusion on marrow grafts between histocompatible canine siblings. J Immunol. 1970; 105(3):627–633. [PubMed: 4917249] 30. Storb R, Rudolph RH, Graham TC, Thomas ED. The influence of transfusions from unrelated
donors upon marrow grafts between histocompatible canine siblings. J Immunol. 1971; 107(2): 409–413. [PubMed: 4398184]
31. Storb R, Thomas ED, Buckner CD, et al. Marrow transplantation in thirty ‘untransfused’ patients with severe aplastic anemia. Ann Intern Med. 1980; 92(1):30–36. [PubMed: 6985782]
32. Anasetti C, Doney KC, Storb R, et al. Marrow transplantation for severe aplastic anemia. Long-term outcome in fifty ‘untransfused’ patients. Ann Intern Med. 1986; 104(4):461–466. [PubMed: 3006565]
33. Niederwieser D, Pepe M, Storb R, Loughran TP Jr, Longton G. Improvement in rejection, engraftment rate and survival without increase in graft-versus-host disease by high marrow cell dose in patients transplanted for aplastic anaemia. Br J Haematol. 1988; 69(1):23–28. [PubMed: 3289603]
A
uthor Man
uscr
ipt
A
uthor Man
uscr
ipt
A
uthor Man
uscr
ipt
A
uthor Man
uscr
34. McCann SR, Bacigalupo A, Gluckman E, et al. Graft rejection and second bone marrow transplants for acquired aplastic anaemia: a report from the Aplastic Anaemia Working Party of the European Bone Marrow Transplant Group. Bone Marrow Transplant. 1994; 13(3):233–237. [PubMed: 8199566]
35. Angelbeck JH, Ortolano GA. Universal leukocyte reduction: Is it appropriate medical practice or not? J Infus Nurs. 2005; 28(4):273–281. [PubMed: 16106211]
36. Wortham ST, Ortolano GA, Wenz B. A brief history of blood filtration: clot screens, microaggregate removal, and leukocyte reduction. Transfus Med Rev. 2003; 17(3):216–222. [PubMed: 12881782]
37. Gluckman E, Horowitz MM, Champlin RE, et al. Bone marrow transplantation for severe aplastic anemia: influence of conditioning and graft-versus-host disease prophylaxis regimens on outcome. Blood. 1992; 79(1):269–275. [PubMed: 1728315]
38. Aljurf MD, Zaidi SZ, El Solh H, et al. Special issues related to hematopoietic SCT in the Eastern Mediterranean region and the first regional activity report. Bone Marrow Transplant. 2009; 43(1): 1–12. [PubMed: 19043456]
39. Chandy M, Srivastava A, Dennison D, Mathews V, George B. Allogeneic bone marrow transplantation in the developing world: experience from a center in India. Bone Marrow Transplant. 2001; 27(8):785–790. [PubMed: 11477434]
40. Shamsi T, Hashmi K, Adil S, et al. The stem cell transplant program in Pakistan--the first decade. Bone Marrow Transplant. 2008; 42(Suppl 1):S114–S117. [PubMed: 18724282]
41. Aljurf M, Zaidi SZ, Hussain F, et al. Status of hematopoietic stem cell transplantation in the WHO Eastern Mediterranean Region (EMRO). Transfus Apher Sci. 2010; 42(2):169–175. [PubMed: 20110194]
42. Chandy M. Stem cell transplantation in India. Bone Marrow Transplant. 2008; 42(Suppl 1):S81– S84. [PubMed: 18724312]
43. Kumar R, Naithani R, Mishra P, et al. Allogeneic hematopoietic SCT performed in non-HEPA filter rooms: initial experience from a single center in India. Bone Marrow Transplant. 2009; 43(2):115–119. [PubMed: 18794872]
44. George B, Mathews V, Viswabandya A, Kavitha ML, Srivastava A, Chandy M. Fludarabine and cyclophosphamide based reduced intensity conditioning (RIC) regimens reduce rejection and improve outcome in Indian patients undergoing allogeneic stem cell transplantation for severe aplastic anemia. Bone Marrow Transplant. 2007; 40(1):13–18. [PubMed: 17450183] 45. Cameron A, Ewen M, Ross-Degnan D, Ball D, Laing R. Medicine prices, availability, and
affordability in 36 developing and middle-income countries: a secondary analysis. Lancet. 2009; 373(9659):240–249. [PubMed: 19042012]
46. O'Donnell O, van Doorslaer E, Rannan-Eliya RP, et al. Who pays for health care in Asia? J Health Econ. 2008; 27(2):460–475. [PubMed: 18179832]
47. Min CK, Kim DW, Lee JW, Han CW, Min WS, Kim CC. Hematopoietic stem cell transplantation for high-risk adult patients with severe aplastic anemia; reduction of graft failure by enhancing stem cell dose. Haematologica. 2001; 86(3):303–310. [PubMed: 11255278]
48. Min CK, Kim DW, Lee JW, Han CW, Min WS, Kim CC. Supplemental peripheral blood stem cells to decrease marrow rejection in adult patients with severe aplastic anemia. Am J Hematol. 2002; 69(1):15–22. [PubMed: 11835325]
49. Mahmoud H, El-Haddad A, Fahmy O, et al. Hematopoietic stem cell transplantation in Egypt. Bone Marrow Transplant. 2008; 42(Suppl 1):S76–S80. [PubMed: 18724311]
50. Raut SS, Shah SA, Patel KA, et al. Improving Outcome of Aplastic Anaemia with HLA-Matched Sibling Donor Hematopoietic Stem Cell Transplantation: An Experience of Gujarat Cancer and Research Institute (GCRI). Indian J Hematol Blood Transfus. 2015; 31(1):1–8. [PubMed: 25548437]
51. George B, Mathews V, Lakshmi KM, et al. The use of a fludarabine-based conditioning regimen in patients with severe aplastic anemia--a retrospective analysis from three Indian centers. Clin Transplant. 2013; 27(6):923–929. [PubMed: 24304374]
A
uthor Man
uscr
ipt
A
uthor Man
uscr
ipt
A
uthor Man
uscr
ipt
A
uthor Man
uscr
Highlights
• Overall survival was better with bone marrow as graft source in sibling transplants for aplastic anemia.
• Chronic graft-versus-host disease was worse with peripheral blood stem cells as graft source.
• In non-high-income countries, there was no significant survival difference between the two graft sources.
• Analysis of registry data should cater for variations in outcomes in different economic regions.
A
uthor Man
uscr
ipt
A
uthor Man
uscr
ipt
A
uthor Man
uscr
ipt
A
uthor Man
uscr
Figure 1. Overall survival curves after HSCT, comparing BM vs. PBSC as graft sources (A) In US-Canada. (B) In other HIC. (C) In UMIC. (D) In LM-LIC.
A
uthor Man
uscr
ipt
A
uthor Man
uscr
ipt
A
uthor Man
uscr
ipt
A
uthor Man
uscr
Figure 2. Cumulative incidence for neutrophil engraftment comparing BM vs. PBSC as graft sources
(A) In US-Canada. (B) In other HIC. (C) In UMIC. (D) In LM-LIC.
A
uthor Man
uscr
ipt
A
uthor Man
uscr
ipt
A
uthor Man
uscr
ipt
A
uthor Man
uscr
Figure 3. Map of the world showing regions classified according to their GNI
A
uthor Man
uscr
ipt
A
uthor Man
uscr
ipt
A
uthor Man
uscr
ipt
A
uthor Man
uscr
A
uthor Man
uscr
ipt
A
uthor Man
uscr
ipt
A
uthor Man
uscr
ipt
A
uthor Man
uscr
ipt
T ab le 1Characteristics of patients and therapy
BM PBSC P US-C OHIC UMIC LM-LIC US-C OHIC UMIC LM-LIC No. 406 1055 418 48 80 209 64 94
Median Age at transplant in years (range)
17 (<1-68) 20 (<1-62) 18 (<1-53) 17 (2-45) 34 (4-70) 29 (4-66) 23 (6-63) 21 (5-48) <0.001
Females: No. (%)
168 (41) 455 (43) 155 (37) 14 (29) 46 (58) 100 (48) 25 (39) 24 (26) <0.001
*KPS: No. (%)
<0.001 90-100% 280 (69) 553 (52) 227 (54) 30 (63) 33 (41) 100 (48) 22 (34) 58 (62) <90% 114 (28) 285 (27) 189 (45) 18 (38) 40 (50) 92 (44) 42 (66) 35 (37) *T
ime from Diagnosis to T
ransplant: No. (%)
<0.001 0-3mo 273 (67) 482 (46) 183 (44) 11 (23) 25 (31) 78 (37) 29 (45) 32 (34) 3-6mo 53 (13) 168 (16) 117 (28) 14 (29) 19 (24) 23 (11) 13 (20) 26 (28) >6mo 80 (20) 378 (36) 118 (28) 23 (48) 36 (45) 98 (47) 22 (34) 36 (38) Prior treatment <0.001 Androgens 5 (1) 72 (7) 42 (10) 10 (21) 2 (3) 16 (8) 13 (20) 23 (24) CsA 78 (19) 276 (26) 128 (31) 12 (25) 34 (43) 69 (33) 28 (44) 43 (46) A TG 80 (20) 205 (19) 20 (5) 7 (15) 35 (44) 77 (37) 6 (9) 5 (5) Conditioning Re gimen <0.001
Cy + A
TG 298 (73) 635 (60) 87 (21) 32 (67) 45 (56) 144 (69) 30 (47) 55 (59)
Cy +- other
81 (20) 326 (31) 304 (73) 13 (27) 21 (26) 36 (17) 33 (52) 33 (35)
*GVHD Proph
ylaxis
<0.001
CsA + Mtx +/- others
280 (69) 881 (84) 387 (93) 32 (67) 29 (36) 133 (64) 34 (53) 60 (64) Others 122 (30) 170 (16) 21 (5) 14 (29) 47 (59) 75 (36) 16 (25) 33 (35) Median F ollo
w-up of survi
v
ors in mo (range)
73 (3-221) 82 (3-217) 89 (3-217) 16 (1-211) 70 (7-171) 59 (1-194) 27 (1-172) 22 (2-123)
BM indicates bone marro
w; PBSC, peripheral blood stem cells; KPS, Karnofsk
y performance scale; No., number; mo, months; CsA. Cyclosporine A; A
TG, anti-th
ymoc
yte glob
ulin (including
anti-lymphoc
yte glob
ulin); Cy
, c
yclophosphamide; Mtx, methotre
xate;
* missing information not sho
A
uthor Man
uscr
ipt
A
uthor Man
uscr
ipt
A
uthor Man
uscr
ipt
A
uthor Man
uscr
ipt
Table 2
Results of univariate analysis: overall survival, neutrophil engraftment and GVHD
BM (No. = 1927) Probability percent (95% CI)
PBSC (No. =447)
Probability percent (95% CI) p
Overall Survival
US-Canada 1-year 92 (89-94) 66 (55-76) <0.001
5-year 88 (84-91) 56 (45-67) <0.001
Other HIC 1-year 90 (88-92) 82 (77-87) 0.006
5-year 87 (85-89) 77 (70-82) 0.001
UMIC 1-year 76 (72-80) 67 (54-78) 0.13
5-year 69 (64-73) 57 (43-72) 0.15
LM-LIC 1-year 56 (39-73) 72 (61-81) 0.14
5-year 46 (27-65) 61 (49-73) 0.19
Neutrophil Engraftment
US-Canada 28-day 85 (81-88) 89 (81-95) 0.31
100-day 98 (96-99) 91 (84-96) 0.04
Other HIC 28-day 91 (89-92) 93 (90-96) 0.14
100-day 96 (95-97) 96 (94-99) 0.83
UMIC 28-day 75 (71-79) 90 (82-96) <0.001
100-day 91 (88-93) 92 (84-97) 0.70
LM-LIC 28-day 77 (64-88) 97 (92-99) 0.002
100-day 82 (70-91) 98 (94-100) 0.006
Grade 2-4 Ac GVHD at 100 day
US-Canada 11 (8-14) 20 (12-30) 0.05
Other HIC 10 (8-13) 16 (10-23) 0.11
UMIC 10 (7-13) 10 (4-18) 0.96
LM-LIC 23 (12-36) 39 (30-49) 0.04
Grade 3-4 Ac GVHD at 100 day
US-Canada 5 (3-8) 11 (5-19) 0.10
Other HIC 6 (4-8) 11 (6-16) 0.12
UMIC 7 (5-10) 6 (2-14) 0.77
LM-LIC 8 (2-18) 16 (9-24) 0.17
Chronic GVHD
US-Canada 1-year 17 (14-21) 31 (21-42) 0.02
5-year 22 (18-26) 39 (29-51) 0.003
Other HIC 1-year 11 (9-13) 20 (14-26) 0.005
5-year 13 (11-16) 25 (19-31) <0.001
UMIC 1-year 13 (10-17) 28 (17-41) 0.02
5-year 16 (13-20) 28 (17-41) 0.07
A
uthor Man
uscr
ipt
A
uthor Man
uscr
ipt
A
uthor Man
uscr
ipt
A
uthor Man
uscr
ipt
BM (No. = 1927) Probability percent (95% CI)
PBSC (No. =447)
Probability percent (95% CI) p
5-year 9 (2-22) 53 (40-66) <0.001
A
uthor Man
uscr
ipt
A
uthor Man
uscr
ipt
A
uthor Man
uscr
ipt
A
uthor Man
uscr
ipt
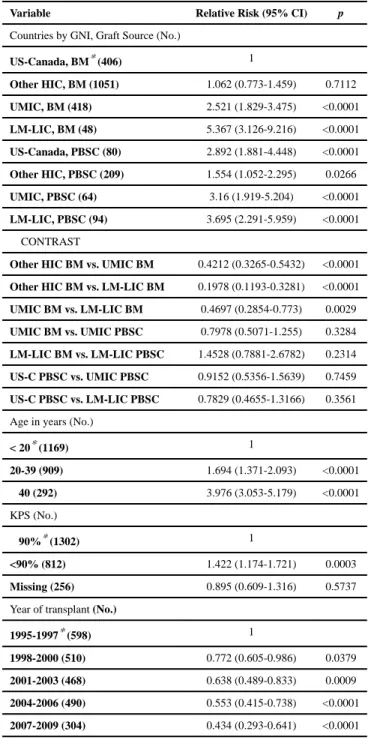
Table 3
Results of multivariate analysis: overall survival
Variable Relative Risk (95% CI) p
Countries by GNI, Graft Source (No.)
US-Canada, BM* (406) 1
Other HIC, BM (1051) 1.062 (0.773-1.459) 0.7112
UMIC, BM (418) 2.521 (1.829-3.475) <0.0001
LM-LIC, BM (48) 5.367 (3.126-9.216) <0.0001
US-Canada, PBSC (80) 2.892 (1.881-4.448) <0.0001
Other HIC, PBSC (209) 1.554 (1.052-2.295) 0.0266
UMIC, PBSC (64) 3.16 (1.919-5.204) <0.0001
LM-LIC, PBSC (94) 3.695 (2.291-5.959) <0.0001 CONTRAST
Other HIC BM vs. UMIC BM 0.4212 (0.3265-0.5432) <0.0001
Other HIC BM vs. LM-LIC BM 0.1978 (0.1193-0.3281) <0.0001
UMIC BM vs. LM-LIC BM 0.4697 (0.2854-0.773) 0.0029
UMIC BM vs. UMIC PBSC 0.7978 (0.5071-1.255) 0.3284
LM-LIC BM vs. LM-LIC PBSC 1.4528 (0.7881-2.6782) 0.2314
US-C PBSC vs. UMIC PBSC 0.9152 (0.5356-1.5639) 0.7459
US-C PBSC vs. LM-LIC PBSC 0.7829 (0.4655-1.3166) 0.3561 Age in years (No.)
< 20* (1169) 1
20-39 (909) 1.694 (1.371-2.093) <0.0001
≥ 40 (292) 3.976 (3.053-5.179) <0.0001 KPS (No.)
≥ 90%* (1302) 1
<90% (812) 1.422 (1.174-1.721) 0.0003
Missing (256) 0.895 (0.609-1.316) 0.5737 Year of transplant (No.)
1995-1997* (598) 1
1998-2000 (510) 0.772 (0.605-0.986) 0.0379
2001-2003 (468) 0.638 (0.489-0.833) 0.0009
2004-2006 (490) 0.553 (0.415-0.738) <0.0001
2007-2009 (304) 0.434 (0.293-0.641) <0.0001 GNI indicates gross national income; other abbreviations explained in Table1;
*
A
uthor Man
uscr
ipt
A
uthor Man
uscr
ipt
A
uthor Man
uscr
ipt
A
uthor Man
uscr
ipt
Table 4
Results of multivariate analysis: neutrophil engraftment on day 28
Variable Countries by GNI, Graft Source (No.) Odds Ratio (95% CI) p
US-Canada, BM* (397) 1
Other HIC, BM (927) 2.15 (1.3891-3.3277) 0.0006
UMIC, BM (387) 0.5981 (0.391-0.9149) 0.0178
LM-LIC, BM (45) 0.5746 (0.2495-1.323) 0.1929
US-Canada, PBSC (73) 3.1664 (0.7406-13.5376) 0.12
Other HIC, PBSC (193) 3.4151 (1.3122-8.8878) 0.0118
UMIC, PBSC (59) 2.9857 (0.7002-12.7307) 0.1393
LM-LIC, PBSC (92) 10.0537 (1.3613-74.2476) 0.0237 CONTRAST
Other HIC BM vs. UMIC BM 3.5948 (2.4069-5.3689) <0.0001
Other HIC BM vs. LM-LIC BM 3.742 (1.6434-8.5207) 0.0017
Other HIC BM vs. Other HIC PB SC 0.6296 (0.2444-1.6218) 0.3378
UMIC BM vs. UMIC PBSC 0.2003 (0.0475-0.8448) 0.0286
LM-LIC BM vs. LM-LIC PBSC 0.05715 (0.006884-0.4744) 0.008 Abbreviations explained in Table 1 and 3.
*
A
uthor Man
uscr
ipt
A
uthor Man
uscr
ipt
A
uthor Man
uscr
ipt
A
uthor Man
uscr
ipt
T ab le 5Causes of death
BM (No = 1927)
PBSC (N =447)
US-C OHIC UMIC LM-LIC US-C OHIC UMIC LM-LIC
No. of P
atients 406 1055 418 48 80 209 64 94
No. of deaths (%)
57 (14) 144 (13.6) 129 (30.9) 18 (37.5) 36 (45) 51 (24.4) 23 (35.9) 27 (28.7)
Causes of Death No. (%)
Graft F ailure 5 (1.2) 13 (1.2) 19 (4.5) 7 (14.6) 7 (8.7) 3 (1.4) 0 (0) 5 (5.3) GVHD 5 (1.2) 22 (2.0) 8 (1.9) 1 (2.0) 6 (7.5) 6 (2.8) 2 (3.1) 1 (1.0) Infection 11 (2.7) 32 (3.0) 47 (11.2) 6 (12.5) 10 (12.5) 18 (8.6) 8 (12.5) 7 (7.4) Interstitial pneumonia/ARDS 5 (1.2) 9 (0.8) 9 (2.1) 0 (0) 1 (1.2) 1 (0.4) 5 (7.8) 4 (4.2) Or g an F ailure 11 (2.7) 36 (3.4) 12 (2.9) 1 (2.0) 4 (5.0) 8 (3.8) 4 (6.2) 5 (5.3) Other causes/unkno wn 20 (4.9) 32 (3.0) 34 (8.1) 3 (6.2) 8 (10.0) 15 (7.1) 4 (6.2) 5 (5.3) Abbre viations e
xplained in T