Advance Access publication on December 14, 2015
Semiparametric regression for the weighted composite
endpoint of recurrent and terminal events
LU MAO, D. Y. LIN∗
Department of Biostatistics, University of North Carolina, Chapel Hill, NC 27599-7420, USA
SUMMARY
Recurrent event data are commonly encountered in clinical and epidemiological studies. A major compli-cation arises when recurrent events are terminated by death. To assess the overall effects of covariates on the two types of events, we define a weighted composite endpoint as the cumulative number of recurrent and terminal events properly weighted by the relative severity of each event. We propose a semiparametric proportional rates model which specifies that the (possibly time-varying) covariates have multiplicative effects on the rate function of the weighted composite endpoint while leaving the form of the rate function and the dependence among recurrent and terminal events completely unspecified. We construct appro-priate estimators for the regression parameters and the cumulative frequency function. We show that the estimators are consistent and asymptotically normal with variances that can be consistently estimated. We also develop graphical and numerical procedures for checking the adequacy of the model. We then demon-strate the usefulness of the proposed methods in simulation studies. Finally, we provide an application to a major cardiovascular clinical trial.
Keywords: Counting process; Dependent censoring; Intensity function; Inverse probability of censoring weighting; Mean function; Survival analysis.
1. INTRODUCTION
In clinical and epidemiological studies, a subject can potentially experience multiple episodes of an adverse event, such as headache and pyogenic infection (Fleming and Harrington,1991). Traditional survival anal-ysis methods focusing on the time to the first event do not make full use of available data or characterize the entire clinical experience of the subject. It is statistically more efficient and clinically more meaningful to consider all recurrent events.
A number of statistical models and methods have been developed to analyze recurrent event data. Specifically,Andersen and Gill(1982) proposed the multiplicative intensity model by treating recurrent events as a non-homogeneous Poisson process, under which the risk of recurrence does not depend on the prior event history. To remove the Poisson assumption,Pepe and Cai(1993),Lawless and Nadeau(1995), andLinand others(2000), hereafter referred to as LWYY, proposed to model the marginal rate function, which is easier to interpret than the intensity function.Prenticeand others(1981) considered the hazard
∗To whom correspondence should be addressed.
c
functions of the gap times between recurrent events, whileWeiand others(1989) considered the marginal hazard function of each recurrent event.
Repeated occurrences of a serious adverse event, such as heart failure (Pfefferand others,2003), oppor-tunistic HIV infection (Vlahovand others,1991;Abramsand others,1994), and cancer (Byar,1980), tend to cause deterioration of health so that the subject may die during the course of the study. This phenomenon poses two challenges. First, the presence of a terminal event (i.e., death) invalidates the aforementioned methods for analyzing recurrent event data. Second, assessing the effects of treatments or other covariates on the entire clinical experience of a patient would need to take into account both recurrent and terminal events.
Two major approaches have been suggested to analyze recurrent and terminal events. The first one deals with the marginal rate or mean function of recurrent events, acknowledging the fact that there is no recurrent event after the terminal event (Cook and Lawless,1997;Ghosh and Lin,2000;Wangand others, 2001;Ghosh and Lin,2002;Chen and Cook,2004;Schaubeland others,2006;Cookand others,2009). The second one is the joint modelling for the two types of events (Huang and Wang,2004;Liuand others, 2004; Yeand others,2007; Zeng and Lin,2009;Zeng and Cai,2010). Both approaches treat recurrent and terminal events as two separate endpoints. The marginal rate and mean functions are affected by the distribution of the terminal event. The joint modelling approach assumes that a latent variable captures the dependence among recurrent events as well as the dependence between recurrent and terminal events, which is a simplistic and unverifiable assumption. For these reasons, the two approaches have rarely been used in actual clinical trials.
The current practice is to use the time to the first composite event (i.e, the first recurrent event or the ter-minal event, whichever occurs first) (Pfefferand others,2003;Yusufand others,2003;Anandand others, 2009;O’Connorand others,2009;Zannadand others,2011). This simple strategy is line with the ICH guidelines (Lewis,1999) that “There should generally be only one primary variable” and that “If a single primary variable cannot be selected from multiple measurements associated with the primary objective, another useful strategy is to integrate or combine the multiple measurements into a single or composite variable, using a predefined algorithm.” The first composite event, however, is statistically inefficient and clinically unsatisfactory because it disregards all the events beyond the first one and does not distinguish recurrent and terminal events such that a subject who has a hospital admission first is treated the same as a subject who dies first.
Based on our recent conversations with cardiologists and regulatory statisticians, a weighted composite endpoint of all recurrent and terminal events, i.e., the cumulative number of recurrent and terminal events properly weighted by their degrees of severity, is an appealing alternative that is likely to be accepted by clinicians and regulatory agencies. This endpoint is a natural extension of the current practice of the first composite event so as to capture all the clinical events experienced by each patient. Compared with the first composite event, the weighted composite event process is not only statistically more efficient due to the use of all available data but also clinically more meaningful due to incorporation of the entire clinical experience of each patient and appropriate weighting of different types of events. This proposal reflects the recommendation ofNeatonand others(2005) to optimally weight components of composite outcomes and to better use the entire event history of patients. An unweighted version of this composite endpoint is being used in a major clinical trial on the efficacy of an angiotensin receptor neprilysin inhibitor in reducing heart failures and cardiovascular death for patients with preserved ejection fraction.
tempting to apply LWYY to the (unweighted) composite event process, we investigate the potential pitfalls of this strategy. We demonstrate the superiority of the new methods through simulated and real data.
2. METHODS
Suppose that there areKdifferent types of events, including the terminal event, whereKis a fixed positive integer. Fork=1, . . . ,K, letNk∗(t)denote the cumulative number of thekth type of event the subject has experienced by timet. We assign the weightckto thekth type of event according to its relative severity and define the weighted sum of theK counting processes:N∗(t)=kK=1ckNk∗(t). LetZ(·)denote ap-vector of possibly time-varying external covariates, and D denote the survival time, i.e., time to the terminal event. We specify thatZ(t)has multiplicative effects on the marginal rate function of N∗(t), i.e.,
E{dN∗(t)|Z(t)} =eβTZ(t)dμ0(t), (2.1)
whereβ is a p-vector of unknown regression parameters, andμ0(·)is an arbitrary increasing function. Note that the dependence structure among recurrent and terminal events is completely unspecified. For time-invariant covariates, model (2.1) reduces to the proportional means model:E{N∗(t)|Z} =eβTZμ
0(t), whereμ0(·)is the baseline mean function.
In practice,N∗(·)andDare subject to right censoring. LetCbe the censoring time, which is assumed to be independent of N∗(·)and D conditional on Z(·). Write N(t)=N∗(t∧C),X=D∧C, and δ=
I(DC), wherea∧b=min(a,b), and I(·)is the indicator function. For a study withn subjects, the data consist of{Ni(t),Zi(t),Xi, δi;tXi}(i=1, . . . ,n).
The only available approach to fitting model (2.1) is the LWYY estimating function
n
i=1
τ
0
Zi(t)−
n
j=1Yj(t)Zj(t)eβ TZ
j(t)
n
j=1Yj(t)eβ TZ
j(t)
dNi(t),
whereYj(t)=I(Xjt), andτ denotes the end of the study. In this approach, which is only applicable to the unweighted composite event process, death is part of the composite endpoint and also a censoring variable. This estimating function can be written as
n
i=1
τ
0
Zi(t)−
n
j=1Yj(t)Zj(t)eβ TZ
j(t)
n
j=1Yj(t)eβ TZ
j(t) dNi(t)−Yi(t)e
βTZ i(t)dμ
0(t) ,
whereμ0(·)is some positive function. For this estimating function to be unbiased, we must haveE{dN(t)−
Y(t)eβTZ(t)dμ
0(t)|Z(t)} =0, i.e., E[I(Xt){dN∗(t)−eβ TZ(t)
dμ0(t)} |Z(t)]=0. Thus, the LWYY inference pertains to the conditional rate
E{dN∗(t)|Dt,Z(t)} =eβTZ(t)dμ0(t), (2.2)
where dμ0(t)=E{dN∗(t)|Dt, Z(t)=0}. The integrated conditional rate does not have a clinical interpretation and is always greater than the marginal mean because E{dN∗(t)|Dt} =E{I(Dt)
dN∗(t)}/P(Dt)=E{dN∗(t)}/P(Dt).
Then
E{dN∗(t)|Z(t)} =eβTZ(t)E{ξP(Dt|ξ)}dμ∗0(t),
and
E{dN∗(t)|Dt,Z(t)} =eβTZ(t)E(ξ|Dt)dμ∗0(t).
Thus, proportionality holds on both the marginal and conditional rate functions, although the baseline functions are different. IfDdepends onZ or the dependence between recurrent events and death cannot be explained by a simple frailty, then the conditional rate model does not hold and LWYY will estimate a quantity that is different fromβof model (2.1).
To make valid inference for model (2.1), we need to exclude the dependent censoring by death from the “at-risk” indicators in the estimating function. Specifically, a subject should remain in the risk set until independent censoring occurs even if the subject dies before the independent censoring time (i.e.,D<C). In other words, the at-risk process isI(Ct)instead ofI(Xt). If there is no early withdrawal or loss to follow-up, then the censoring is all administrative (i.e., caused by the termination of the study) and the censoring time is known to be the difference between the study end date and the subject’s entry time. ReplacingY(t)in the LWYY estimating function withI(Ct), we obtain the estimating function
n
i=1
τ
0
Zi(t)−
n
j=1I(Cjt)Zj(t)eβ TZ
j(t)
n
j=1I(Cjt)eβ TZj(t)
dNi(t), (2.3)
which can be written as
n
i=1
τ
0
Zi(t)−
n
j=1I(Cjt)Zj(t)eβ TZ
j(t)
n
j=1I(Cjt)eβ TZ
j(t) dNi(t)−I(Cit)e
βTZ i(t)dμ
0(t) .
This is an unbiased estimating function because E{dN(t)−I(Ct)eβTZ(t)dμ
0(t)|Z(t)} =E[I(C
t){dN∗(t)−eβTZ(t)dμ
0(t)} |Z(t)]=0 under model (1).
In most studies, there is random loss to follow-up in addition to administrative censoring, so that C is not fully observed. Thus, we use the inverse probability of censoring weighting technique (Robins and Rotnitzky,1992). Define
w(t)= I(CD∧t)G(t|Z) G(D∧t|Z) ,
whereG(t|Z)=P(Ct|Z). Clearly,E{w(t)|Z} =G(t|Z). We estimatew(t)by
w(t)≡ I(C D∧t)G(t|Z) G(D∧t|Z) =
I(CD∧t)G(t|Z)
G(X∧t|Z) ,
whereG(t|Z)is the estimator ofG(t|Z)under the proportional hazards model (Cox,1972) λC(
t|Z)=λC0(t)eγ TZ(t)
. (2.4)
IfZ is discrete, we may setG(t|Z)to be the Kaplan–Meier estimator for covariate valueZ. Replacing
I(Cjt)in (2.3) with
wj(t)≡
I(CjDj∧t)G(t|Zj)
G(Xj∧t|Zj)
we obtain an estimating function that allows unknown censoring times
U(β)=
n
i=1
τ
0
Zi(t)−
n
j=1wj(t)Zj(t)eβ TZ
j(t)
n
j=1wj(t)eβ TZj(t)
dNi(t). (2.5)
Letβˆdenote the root ofU(β)=0, which is obtained by the Newton–Raphson algorithm. The estimator ˆ
β is consistent and asymptotically normal with a covariance matrix estimator given in Section S.1 of supplementary material available atBiostatisticsonline. We make inference aboutβ or a subset ofβ by the Wald method. IfZ is the treatment indicator andG pertains to the treatment-specific Kaplan–Meier estimator, then the Wald statistic provides a nonparametric test for the equality of the two mean functions (since there is no modelling assumption underβ=0).
To estimate the baseline mean functionμ0(t), we employ a weighted version of the Breslow estimator
ˆ μ0(t)=
n
i=1
t
0
dNi(u)
n
j=1wj(u)eβˆ TZ
j(u).
This estimator is consistent and asymptotically normal with a covariance function given in Section S.1 ofsupplementary material available atBiostatisticsonline. Sinceμ0(t)is nonnegative, we construct the confidence interval forμ0(t)based on the log transformation. To be specific, the(1−α)100% confidence interval forμ0(t)is given byμˆ0(t)exp{±z1−α/2σ( t)1/2/μˆ0(t)}, whereσ( t)is the variance estimator for
ˆ
μ0(t), andz1−α/2is the(1−α/2)100th percentile of the standard normal distribution. Incidentally, the LWYY estimator ofμ0(t)is
n
i=1
t
0
dNi(u)
n
j=1Yj(u)eβˆ TZ
j(u),
which overestimatesμ0(t)becauseYj(t)I(Cjt)for all j andt. To assess the adequacy of model (2.1), we define Mi(t)=
t
0wi(u){dNi(u)−eβ TZ
i(u)dμ
0(u)}and ˆ
Mi(t)=
t
0wi(u){dNi(u)−e ˆ
βTZ i(u)dμˆ
0(u)}. Because the Mi(·)are mean-zero processes under model
(2.1), we plot the cumulative sum of the Mˆi(·)against the model component of interest. Specifically, to check the functional form of thejth (time-invariant) covariate, we consider the cumulative-sum process
Wj(x)= n
i=1
I(Zj ix)Mˆi(τ),
whereZj iis the jth component ofZi. To check the exponential link function, we consider
Wr(x)= n
i=1
I(βˆTZix)Mˆi(τ).
To check the proportionality assumption, we consider the standardized “score” process
U(t)= ˆ−1/2
n
i=1
t
0
whereˆ is a covariance matrix estimator forn−1/2U(β). To check the overall fit of the model, we consider
W0(t,z)= n
i=1
I(Ziz)Mˆi(t).
We show in Section S.2 ofsupplementary material available atBiostatisticsonline, that, under model (2.1), all the above processes are asymptotically zero-mean Gaussian processes whose distributions can be approximated by Monte Carlo simulation along the lines of LWYY. We can graphically compare the observed cumulative-sum process with a few realizations from its null distribution or perform a numerical test based on the maximum absolute value of the process.
3. SIMULATIONSTUDIES
We assess the finite-sample performance of the new methods through extensive simulation studies. We consider one sequence of recurrent events, along with a terminal event. In order to compare with existing methods, we focus on the unweighted version of the composite endpoint. It is not trivial to generate the composite event process that satisfies the proportional means assumption. We outline below our data gener-ation scheme while relegating the details to Section S.3 ofsupplementary material available atBiostatistics
online.
Let N∗∗(t)be a homogeneous Poisson process with intensityλ0eβ TZ
, and letτ∗ be a stopping time such that there is at least one event in the interval [0, τ∗]. Then by labeling the last event in [0, τ∗] as the terminal event, we have a well-defined composite event process given byN∗(t)≡N∗∗(t∧τ∗). If the distribution ofτ∗is independent ofZ and uninformative aboutβ, the optional sampling theorem implies that
E{N∗(t)|Z} =λ0eβ TZ
E(τ∗∧t).
Thus, the process satisfies the proportional means assumption. In fact, given some appropriateλ∗>0, we can simulateτ∗that follows the exponential distribution with hazardλ∗. Furthermore, we can introduce a frailty termξ to theλ0andλ∗of each subject so as to induce dependence among the event times of the same subject. We letλ0=0.6 andZ∼Bernoulli(1/2). Let the administrative censoring time be distributed asU[3,6] and the random loss of follow-up be distributed as exponential with hazard 0.1. Let the frailty termξ follow the gamma distribution with mean 1 and varianceσ2. Under these conditions, each subject has an average of 2–3 events, and the censoring rate is∼30%.
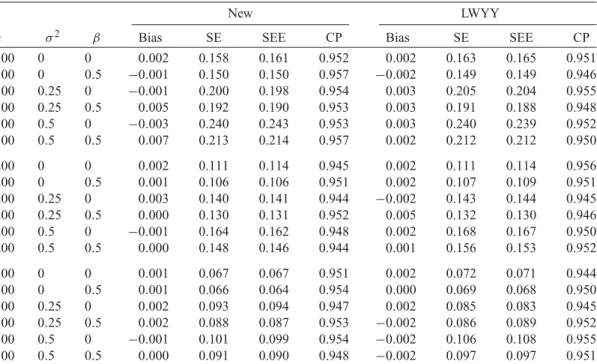
We conduct two sets of simulation studies to compare the new and LWYY methods for making inference onβ. In the first set, we letλ∗=0.1 for all subjects, so that the two treatment groups have the same distribution of the terminal event. The results are displayed in Table1. The new estimatorβˆis virtually unbiased, and its variance estimator accurately reflects the true variation. As expected, LWYY also provides correct inference since the simulation set-up also conforms to the conditional rate model (2.2).
Table 1. Simulation results comparing the new and LWYY methods in estimating the treatment difference under equal distributions of death
New LWYY
n σ2 β Bias SE SEE CP Bias SE SEE CP
100 0 0 0.002 0.158 0.161 0.952 0.002 0.163 0.165 0.951
100 0 0.5 −0.001 0.150 0.150 0.957 −0.002 0.149 0.149 0.946
100 0.25 0 −0.001 0.200 0.198 0.954 0.003 0.205 0.204 0.955
100 0.25 0.5 0.005 0.192 0.190 0.953 0.003 0.191 0.188 0.948
100 0.5 0 −0.003 0.240 0.243 0.953 0.003 0.240 0.239 0.952
100 0.5 0.5 0.007 0.213 0.214 0.957 0.002 0.212 0.212 0.950
200 0 0 0.002 0.111 0.114 0.945 0.002 0.111 0.114 0.956
200 0 0.5 0.001 0.106 0.106 0.951 0.002 0.107 0.109 0.951
200 0.25 0 0.003 0.140 0.141 0.944 −0.002 0.143 0.144 0.945
200 0.25 0.5 0.000 0.130 0.131 0.952 0.005 0.132 0.130 0.946
200 0.5 0 −0.001 0.164 0.162 0.948 0.002 0.168 0.167 0.950
200 0.5 0.5 0.000 0.148 0.146 0.944 0.001 0.156 0.153 0.952
500 0 0 0.001 0.067 0.067 0.951 0.002 0.072 0.071 0.944
500 0 0.5 0.001 0.066 0.064 0.954 0.000 0.069 0.068 0.950
500 0.25 0 0.002 0.093 0.094 0.947 0.002 0.085 0.083 0.945
500 0.25 0.5 0.002 0.088 0.087 0.953 −0.002 0.086 0.089 0.952
500 0.5 0 −0.001 0.101 0.099 0.954 −0.002 0.106 0.108 0.955
500 0.5 0.5 0.000 0.091 0.090 0.948 −0.002 0.097 0.097 0.951
Bias is the bias of the parameter estimatorβˆ, SE is the empirical standard error ofβˆ, SEE is the empirical mean of the standard error estimator ofβˆ, and CP is the coverage probability of the 95% confidence interval. Each entry is based on 10 000 replicates.
Table 2.Simulation results comparing the new and LWYY methods in estimating and testing the treatment difference under unequal distributions of death
New LWYY
n p1 Bias Size Bias Size
100 0.2 0.002 0.052 0.017 0.058
100 0.3 −0.004 0.046 0.037 0.108
100 0.5 0.005 0.054 0.133 0.208
200 0.2 0.009 0.053 0.016 0.066
200 0.3 0.006 0.058 0.039 0.204
200 0.5 −0.005 0.052 0.131 0.321
500 0.2 −0.002 0.045 0.018 0.102
500 0.3 0.002 0.048 0.038 0.389
500 0.5 −0.004 0.054 0.132 0.615
Bias is the bias of the parameter estimator, and size is the empirical type I error of the Wald statistic for testingH0:β=0 at the nominal significance level of 0.05. Each entry is based on 10 000 replicates.
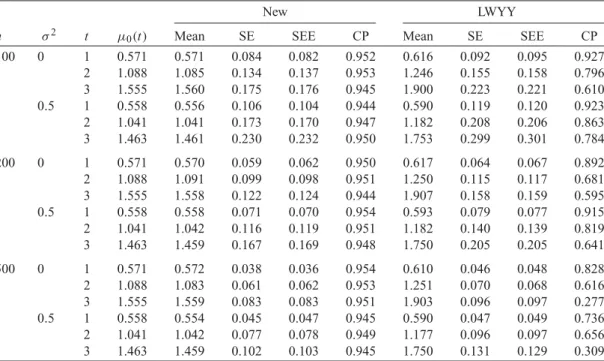
We adopt the first simulation set-up to assess the performance of the new and LWYY methods for estimating the baseline mean functionμ0(·). By treating death as censoring, the LWYY method will over-estimate the mean function. Indeed, LWYY over-estimatesμ˜0(t)=λ0t, which is strictly greater thanμ0(t)≡
λ0E(t∧τ∗)=λ0/λ∗E{1−exp(−λ∗tξ)}. Simulation results are summarized in Table3and are consistent
Table 3.Simulation results comparing the new and LWYY methods in estimating the baseline mean function
New LWYY
n σ2 t μ
0(t) Mean SE SEE CP Mean SE SEE CP
100 0 1 0.571 0.571 0.084 0.082 0.952 0.616 0.092 0.095 0.927
2 1.088 1.085 0.134 0.137 0.953 1.246 0.155 0.158 0.796
3 1.555 1.560 0.175 0.176 0.945 1.900 0.223 0.221 0.610
0.5 1 0.558 0.556 0.106 0.104 0.944 0.590 0.119 0.120 0.923
2 1.041 1.041 0.173 0.170 0.947 1.182 0.208 0.206 0.863
3 1.463 1.461 0.230 0.232 0.950 1.753 0.299 0.301 0.784
200 0 1 0.571 0.570 0.059 0.062 0.950 0.617 0.064 0.067 0.892
2 1.088 1.091 0.099 0.098 0.951 1.250 0.115 0.117 0.681
3 1.555 1.558 0.122 0.124 0.944 1.907 0.158 0.159 0.595
0.5 1 0.558 0.558 0.071 0.070 0.954 0.593 0.079 0.077 0.915
2 1.041 1.042 0.116 0.119 0.951 1.182 0.140 0.139 0.819
3 1.463 1.459 0.167 0.169 0.948 1.750 0.205 0.205 0.641
500 0 1 0.571 0.572 0.038 0.036 0.954 0.610 0.046 0.048 0.828
2 1.088 1.083 0.061 0.062 0.953 1.251 0.070 0.068 0.616
3 1.555 1.559 0.083 0.083 0.951 1.903 0.096 0.097 0.277
0.5 1 0.558 0.554 0.045 0.047 0.945 0.590 0.047 0.049 0.736
2 1.041 1.042 0.077 0.078 0.949 1.177 0.096 0.097 0.656
3 1.463 1.459 0.102 0.103 0.945 1.750 0.131 0.129 0.309
Mean is the empirical mean ofμˆ0(t), SE is the empirical standard error ofμˆ0(t), SEE is the empirical mean of the standard error
estimator ofμ0(t), and CP is the coverage probability of the 95% log-transformed confidence interval. Each entry is based on
10 000 replicates.
We also compare the power of the new method using different weighting schemes with the current practice of performing the Cox regression on the time to the first composite event. The results for the first simulation set-up are shown in Table S1 ofsupplementary material available atBiostatisticsonline. The power of the new method decreases as the weight on death increases. This is not surprising since the distributions of death are identical between the two groups. For all weighting schemes, the new method yields much higher power than the Cox regression.
Next, we consider mis-specified censoring distributions. We use the first simulation set-up but gener-ate the time to random loss of follow-upLfrom the proportional odds model: P(Lt|Z)/{1−P(L t|Z)} =eZ(1−e−0.1t)/e−0.1t. We estimate the censoring distributions by the Kaplan–Meier estimator or under the Cox model. The results are summarized in Table S2 ofsupplementary material available at
Biostatisticsonline. Under the Cox model, the type I error is only slightly inflated, and the power tends to be higher than the use of the Kaplan–Meier estimator.
4. AREAL EXAMPLE
Heart Failure: A Controlled Trial Investigating Outcomes of Exercise Training (HF-ACTION) was a ran-domized controlled clinical trial to evaluate the efficacy and safety of exercise training among patients with heart failure (O’Connorand others,2009). A total of 2331 medically stable outpatients with heart failure and reduced ejection fraction were recruited between April 2003 and February 2007 at 82 centers in the USA, Canada, and France. Patients were randomly assigned to usual care alone or usual care plus aerobic exercise training that consists of 36 supervised sessions followed by home-based training. The usual care group consisted of 1172 patients (follow-up data not available for 1 patient), and the exercise training group consisted of 1159 patients. There were a large number of hospital admissions (due to heart failure, other cardiovascular causes, or non-cardiovascular causes) and a considerable number of deaths in each treatment arm, as shown in Table S3 ofsupplementary material available atBiostatisticsonline.
The primary endpoint was a composite of all-cause mortality and all-cause hospitalization. Secondary endpoints included the composite of cardiovascular mortality and cardiovascular hospitalization, and the composite of cardiovascular mortality and heart failure hospitalization. Under the Cox models on the time to the first event adjusting for heart failure etiology (ischemic or not), thep-values for these three endpoints were found to be 0.13, 0.14, and 0.06, respectively (O’Connorand others,2009). This analysis disregarded all the clinical events that occurred after the first one and attached the same clinical importance to hospi-talization and death.
To provide a statistically more efficient and clinically more relevant evaluation of the benefits of exer-cise training, we use the proposed weighted composite event process for death and recurrent hospital-ization. For each of the three endpoints, we first consider an unweighted version of the composite event process—each event receives the same weight. To reflect the unequal severity of death versus hospitaliza-tion, we also consider a weighted version which assigns the weights of 2 and 1 to death and hospitalizahospitaliza-tion, respectively. Because heart failure is a life-threatening event, we consider another weighting scheme which assigns the weights of 3, 2, and 1 to cardiovascular death, heart failure, and other cardiovascular hospital-ization, respectively. These weights are in line with the cardiology literature (e.g.,Califfand others,1990; Braunwaldand others,1992;Armstrongand others,2011).
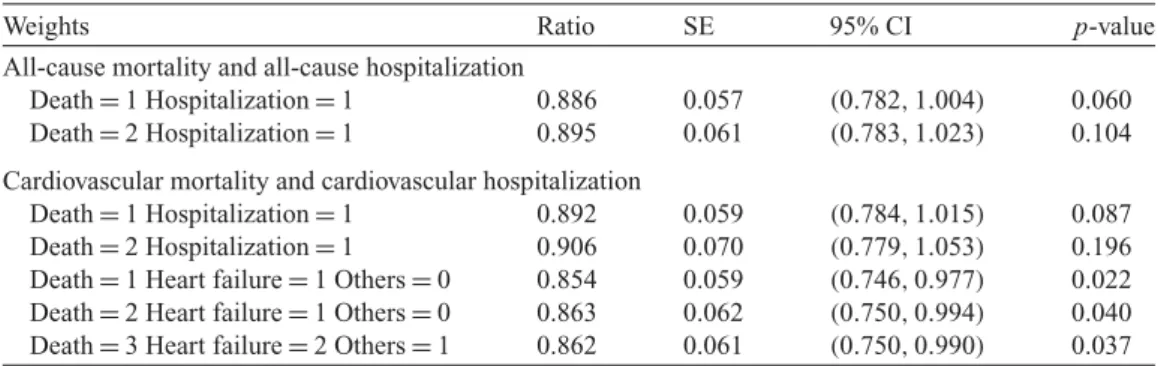
We apply the proportional means model to the aforementioned weighted composite event processes. Table4displays the results on the ratios of the mean frequencies of the weighted composite events between exercise training and usual care adjusted for heart failure etiology. Thep-values for the unweighted com-posite endpoints of all-cause mortality and all-cause hospitalization, cardiovascular mortality and cardio-vascular hospitalization, and cardiocardio-vascular mortality and heart failure hospitalization are 0.06, 0.087, and 0.022, respectively, which are substantially smaller than the corresponding p-values in the analysis of the first event. Because treatment differences are more profound for hospitalization than for mortality, assign-ing more weight to death than hospitalization tends to reduce the level of statistical significance. Because there are a large number of recurrent hospital admissions, however, the use of the weighted composite event process (with less weight on hospitalization than on death) still tends to yield stronger evidence for the benefits of exercise training than the use of the first composite event, especially for the composite of mortality and heart failure.
We compare the new and LWYY methods in the estimation of the mean functions for the unweighted composite event process of all-cause mortality and all-cause hospitalization. As shown in Figure1, the LWYY estimates of the mean functions are considerably higher than ours. This phenomenon is consistent with the theory and simulation results.
Table 4.Proportional mean regression analysis of the HF-ACTION data under different weighting schemes
Weights Ratio SE 95% CI p-value
All-cause mortality and all-cause hospitalization
Death=1 Hospitalization=1 0.886 0.057 (0.782,1.004) 0.060 Death=2 Hospitalization=1 0.895 0.061 (0.783,1.023) 0.104 Cardiovascular mortality and cardiovascular hospitalization
Death=1 Hospitalization=1 0.892 0.059 (0.784,1.015) 0.087 Death=2 Hospitalization=1 0.906 0.070 (0.779,1.053) 0.196 Death=1 Heart failure=1 Others=0 0.854 0.059 (0.746,0.977) 0.022 Death=2 Heart failure=1 Others=0 0.863 0.062 (0.750,0.994) 0.040 Death=3 Heart failure=2 Others=1 0.862 0.061 (0.750,0.990) 0.037 Ratio is the estimated ratio of the mean frequencies of the weighted composite events between exercise training and usual case, SE is the (estimated) standard error for the ratio estimate, and 95%CI is the 95% confidence interval.
0 10 20 30 40 50
0.0
0.5
1.0
1.5
2.0
2.5
3.0
Time (months)
Mean function for all−cause death and hospitalization
0 10 20 30 40 50
0.0
0.5
1.0
1.5
2.0
2.5
3.0
Time (months)
Mean function for all−cause death and hospitalization
Fig. 1. Estimated mean functions for all-cause mortality and all-cause hospitalization by treatment group for non-ischemic patients in the HF-ACTION study: the left and right panels pertain to usual care and exercise training, respectively. The new and LWYY methods are denoted by the solid and dashed curves, respectively.
fibrillation or flutter (AFF). The results on the regression effects are summarized in Table S4 of sup-plementary material available atBiostatisticsonline. With the covariate adjustment, the effect of exercise training is highly significant. Figure S1 ofsupplementary material available atBiostatisticsonline pro-vides an example of predicting the number of events for a patient with given covariate values.
5. DISCUSSION
The presence of a terminal event poses serious challenges in the analysis of recurrent event data. The exist-ing methods treatexist-ing recurrent and terminal events as two separate endpoints have not been well received by clinicians or regulatory agencies. The nonparametric tests ofGhosh and Lin(2000) have been used in recent cardiovascular trials (Anandand others,2009;Rogersand others,2012), but only as secondary analysis; none of the other methods seem to have been used in actual clinical trials. The current practice is to use the first composite event as the primary endpoint. This endpoint disregards the information on the clinical events beyond the first one and does not distinguish the two types of events. The weighted com-posite event process is a natural extension of the current measure to enhance statistical power and clinical relevance. This endpoint is particularly useful when there are several types of recurrent events, some of which might have too few occurrences to be analyzed separately.
We have proposed a novel proportional rates/means model for studying the effects of treatments and other covariates on the weighted composite event process and provided the corresponding inference pro-cedures. We have demonstrated that the proposed inference procedures have desirable asymptotic and finite-sample properties. We have shown both analytically and numerically that the LWYY approach always over-estimates the mean function of the (unweighted) composite event process (whether or not recurrent and terminal events are correlated) and generally yields biased estimation of the regression parameters.
Although the concept of proportional rates/means is simple and attractive, it is not obvious that the model can hold for the weighted composite event process. We have shown that there are realistic data generation mechanisms which satisfy this model. In addition, we have provided graphical and numerical methods to assess the adequacy of the model.
When constructing the estimating function for model (2.1), we exclude the censoring by death from the at-risk indicators. It seems counter-intuitive to regard a subject to be at risk after death. However, “at risk” is a mathematical construct to ensure unbiased estimating functions. If there is no censoring byC, the composite endpoint processN∗(·)will be fully observed. In that case, it is clear that censoringN∗(·)
atDis mathematically wrong.
Regulatory submissions require the treatment efficacy be represented by a single parameter in the pri-mary analysis. The rate (or mean) ratio for the weighted composite event process proposed in this article satisfies this requirement and provides a fuller and more meaningful characterization of the clinical course than the hazard ratio for the first composite event. It is sensible to combine death and life-threatening recurrent events (e.g., heart failure or stroke) with appropriate weighting in the primary analysis.
The analysis based on the composite event process provides an overall assessment of the treatment effi-cacy. A significant treatment effect on the composite endpoint does not imply significant treatment effects on all its components. The existing methods that treat terminal and recurrent events as two separate end-points can be used to determine the nature of the treatment effect. If the treatment reduces the frequencies of both terminal and recurrent events, then its clinical benefits are clear. Because the occurrence of the terminal event precludes further development of recurrent events, it is possible for the treatment to reduce the risk of the terminal event and increase the incidence of recurrent events.
SUPPLEMENTARY MATERIAL
Supplementary material is available online athttp://biostatistics.oxfordjournal.org.
ACKNOWLEDGMENTS Conflict of Interest: None declared.
FUNDING
This research was supported by the NIH grants R01GM047845, R01AI029168, and P01CA142538.
REFERENCES
ABRAMS, D. I.,GOLDMAN, A. I.,LAUNER, C.,KORVICK, J. A.,NEATON, J. D.,CRANE, L. R.,GRODESKY, M.,WAKE -FIELD, S.,MUTH, K.,KORNE-GAY, S.,COHN, D. L.,HARRIS, A.,LUSKIN-HWARK, R.,MARKOWITZ, N.,SAMPSON, J. H.,THOMPSON, M.ANDDEYTON, L. (1994). A comparative trial of Didanosine or Zalcitabine after treatment with Zidovudine in patients with human immunodeficiency virus infection.New England Journal of Medicine 330, 657–662.
ANAND, I. S.,CARSON, P.,GALLE, E.,SONG, R.,BOEHMER, J.,GHALI, J. K.,JASKI, B.,LINDENFELD, J.,O’CONNOR, C.,STEINBERG, J. S.,LEIGH, J.,YONG, P.,KOSOROK, M. R.,FELDMAN, A. M.,DEMETS, D.ANDBRISTOW, M. R. (2009). Cardiac resynchronization therapy reduces the risk of hospitalizations in patients with advanced heart fail-ure: results from the Comparison of Medical Therapy, Pacing and Defibrillation in Heart Failure (COMPANION) trial.Circulation119, 969–977.
ANDERSEN, P. K.ANDGILL, R. D. (1982). Cox’s regression model for counting processes: a large sample study.The Annals of Statistics10, 1100–1120.
ARMSTRONG, P. W.,WESTERHOUT, C. M.,VAN DEWERF, F.,CALIFF, R. M.,WELSH, R. C.,WILCOX, R. G. AND
BAKAL, J. A. (2011). Refining clinical trial composite outcomes: an application to the Assessment of the Safety and Efficacy of a New Thrombolytic-3 (ASSENT-3) trial.American Heart Journal161, 848–854.
BRAUNWALD, E.,CANNON, C. P.ANDMCCABE, C. H. (1992). An approach to evaluating thrombolytic therapy in acute myocardial infarction. The “unsatisfactory outcome” end point.Circulation86, 683–687.
BYAR, D. P. (1980). The Veterans Administration study of chemoprophylaxis for recurrent stage I bladder tumors: comparisons of placebo, pyridoxine, and topical thiotepa. In Pavone-Macaluso, M., Smith, P. H. and Edsmyr, F. (editors),Bladder Tumors and Other Topics in Urological Oncology. New York: Plenum, pp. 363–370.
CALIFF, R. M.,HARRELSON-WOODLIEF, L.ANDTOPOL, E. J. (1990). Left ventricular ejection fraction may not be useful as an end point of thrombolytic therapy comparative trials.Circulation82, 1847–1853.
CHEN, B. E.AND COOK, R. J. (2004). Tests for multivariate recurrent events in the presence of a terminal event. Biostatistics5, 129–143.
COOK, R. J.ANDLAWLESS, J. F. (1997). Marginal analysis of recurrent events and a terminating event.Statistics in Medicine16, 911–924.
COOK, R. J.,LAWLESS, J. F.,LAKHAL-CHAIEB, L.ANDLEE, K. A. (2009). Robust estimation of mean functions and treatment effects for recurrent events under event-dependent censoring and termination: application to skeletal complications in cancer metastatic to bone.Journal of the American Statistical Association104, 60–75.
COX, D. R. (1972). Regression models and life-tables (with discussion).Journal of the Royal Statistical Society, Series B34, 187–200.
GHOSH, D. AND LIN, D. Y. (2000). Nonparametric analysis of recurrent events and death. Biometrics 56, 554–562.
GHOSH, D.ANDLIN, D. Y. (2002). Marginal regression models for recurrent and terminal events.Statistica Sinica12, 663–688.
HUANG, C.ANDWANG, M. (2004). Joint modeling and estimation for recurrent event processes and failure time data. Journal of the American Statistical Association99, 1153–1165.
LAWLESS, J. F.ANDNADEAU, C. (1995). Some simple robust methods for the analysis of recurrent events. Technomet-rics37, 158–168.
LEWIS, J. A. (1999). Statistical principles for clinical trials (ICH E9): an introductory note on an international guideline. Statistics in Medicine18, 1903–1942.
LIN, D. Y.,WEI, L. J.,YANG, I.ANDYING, Z. (2000). Semiparametric regression for the mean and rate functions of recurrent events.Journal of the Royal Statistical Society, Series B62, 711–730.
LIU, L.,WOLFE, R. A.AND HUANG, X. (2004). Shared frailty models for recurrent events and a terminal event. Biometrics60, 747–756.
NEATON, J. D.,GRAY, G.,ZUCKERMAN, B. D.ANDKONSTAM, M. A. (2005). Key issues in end point selection for heart failure trials: composite end points.Journal of Cardiac Failure11, 567–575.
O’CONNOR, C. M.,WHELLAN, D. J.,LEE, K. L.,KETEYIAN, S. J.,COOPER, L. S.,ELLIS, S. J.,LEIFER, E. S.,KRAUS, W. E.,KITZMAN, D. W.,BLUMENTHAL, J. A.and others(2009). Efficacy and safety of exercise training in patients with chronic heart failure: HF-ACTION randomized controlled trial.Journal of American Medical Association 301, 1439–1450.
PEPE, M. S.ANDCAI, J. (1993). Some graphical displays and marginal regression analyses for recurrent failure times and time dependent covariates.Journal of the American Statistical Association88, 811–820.
PFEFFER, M. A.,SWEDBERG, K.,GRANGER, C. B.,HELD, P.,MCMURRAY, J. J.,MICHELSON, E. L.,OLOFSSON, B., OSTERGREN, J.ANDYUSUF, S. (2003). Effects of candesartan on mortality and morbidity in patients with chronic heart failure: the CHARM-Overall programme.The Lancet362, 759–66.
PRENTICE, R. L.,WILLIAMS, B. J.ANDPETERSON, A. V. (1981). On the regression analysis of multivariate failure time data.Biometrika68, 373–379.
ROBINS, J. M.ANDROTNITZKY, A. (1992). Recovery of information and adjustment for dependent censoring using surrogate markers. In Jewell, N., Dietz, K. and Farewell, V. (editors),AIDS Epidemiology. Boston: Birkhauser, pp. 297–331.
ROGERS, J. K.,MCMURRAY, J. J. V.,POCOCK, S. J.,ZANNAD, F.,KRUM, H.,VANVELDHUISEN, D. J.,SWEDBERG, K., SHI, H.,VINCENT, J.ANDPITT, B. (2012). Eplerenone in patients with systolic heart failure and mild symptoms analysis of repeat hospitalizations.Circulation126, 2317–2323.
SCHAUBEL, D. E.,ZENG, D.ANDCAI, J. (2006). A semiparametric additive rates model for recurrent event data.Lifetime Data Analysis12, 389–406.
VLAHOV, D.,ANTHONY, J. C.,MUNOZ, A.,MARGOLICK, J.,NELSON, K. E.,CELENTANO, D. D.,SOLOMON, L.AND
POLK, B. F. (1991). The ALIVE study: a longitudinal study of HIV-1 infection in intravenous drug users: description of methods.Journal of Drug Issues21, 758–776.
WANG, M. C.,QIN, J.ANDCHIANG, C. T. (2001). Analyzing recurrent event data with informative censoring.Journal of American Statistical Association96, 1057–1065.
WEI, L. J.,LIN, D. Y.ANDWEISSFELD, L. (1989). Regression analysis of multivariate incomplete failure time data by modeling marginal distributions.Journal of the American Statistical Association84, 1065–1073.
YUSUF, S., PFEFFER, M. A., SWEDBERG, K., GRANGER, C. B., HELD, P., MCMURRAY, J. J., MICHELSON, E. L., OLOFSSON, B.AND ¨OSTERGREN, J. (2003). Effects of candesartan in patients with chronic heart failure and pre-served left-ventricular ejection fraction: the CHARM-Prepre-served Trial.The Lancet362, 777–781.
ZANNAD, F.,MCMURRAY, J. J.,KRUM, H.,VANVELDHUISEN, D. J.,SWEDBERG, K.,SHI, H.,VINCENT, J.,POCOCK, S. J. ANDPITT, B. (2011). Eplerenone in patients with systolic heart failure and mild symptoms.New England Journal of Medicine364, 11–21.
ZENG, D.ANDCAI, J. (2010). A semiparametric additive rate model for recurrent events with an informative terminal event.Biometrika97, 699–712.
ZENG, D.ANDLIN, D. Y. (2009). Semiparametric transformation models with random effects for joint analysis of recurrent and terminal events.Biometrics65, 746–752.