Educational Program Plan
Labor Market Information Analysis
REVISED SEPTEMBER 2014
1
Table of Contents
INTRODUCTION ... 2
REVISED EDUCATION PROGRAM RECOMMENDATIONS ... 3
Minuteman Mission ... 4
Minuteman Philosophy ... 5
Six Indicators of Educational Program Development... 5
Labor Market Overview ... 6
Post-Graduate Programs ... 6
EXECUTIVE SUMMARY: LABOR MARKET INFORMATION ANALYSIS ... 7
Engineering, Construction, and Trades Academy ... 7
Life Sciences and Services Academy ... 8
INDUSTRIES AND OCCUPATIONS RELATED TO CHAPTER 74 PROGRAMS ... 10
EMPLOYMENT PROJECTIONS AND WAGE SUMMARIES ... 12
A. Engineering, Construction, & Trades Academy ... 12
1. Occupational Employment Projections Summary 2010-2020 ... 12
2. Employment and Wage Summary May 2012 ... 17
B. Life Sciences and Services Academy ... 19
1. Occupational Employment Projections Summary 2010-2020 ... 19
2. Employment and Wage Summary May 2012 ... 25
REFERENCES ... 32
Additional Reading ... 33
APPENDIX ... 34
A. Table A: Industries Related to One or More Minuteman Regional Technical Vocational High School Ch. 74 Programs ... 34
B. TABLE B: Minuteman Regional Vocational School Ch. 74 Programs: Related Occupations and Key Industries 36 C. Table C: Current Clusters and Programs and Proposed Academies and Programs ... 40
2
INTRODUCTION
This REVISED Education Program Plan is being submitted to the Department of Elementary and Secondary Education (DESE) for comment and approval. The Minuteman Regional Vocational Technical School District (MRVTSD) has submitted a Preliminary Design Program to the Massachusetts School Building Authority (MSBA) as a required component of our Feasibility Study Agreement. The Feasibility Study agreement expires June 30, 2016 and no further extensions will be granted to the District.
On June 17, 2014, the District School Committee voted a FINAL Design Enrollment of 628 students. The Minuteman Education Program Plan Subcommittee was reconvened in the summer of 2014 and met 4 times to revise the original education program plan submitted in October of 2013. The School Committee held a special meeting on September 10, 2014, during which the Superintendent presented this revised Education Program Plan. The District School Committee voted to accept the revised plan as presented and as recommended by the Education Program Plan Subcommittee. The plan is summarized below:
PROPOSED ACADEMIES AND PROGRAMS/CIP CODES
Engineering, Construction, and Trades Academy Advanced Manufacturing (New)
48.0501 / 48.0599 Electrical 46.0302 Plumbing 46.0503 / 47.0201 Carpentry 46.0201 Automotive Technology 47.0604
Multi-Media Engineering (New) 09.0701
Robotics Engineering Automation 15.0000 / 15.0403
Programming & Web Development 11.0201
Design & Visual Communications 50.0401
Life Sciences and Services Academy Culinary/Hospitality
12.0500/52.0901 Early Education & Care
13.1210 Cosmetology/Barbering 12.0404 / 12.0402 Health Occupations 51.0000 1.0601
Environmental Science & Technology 15.0507
Biotechnology 15.0401 Horticulture
3
REVISED EDUCATION PROGRAM RECOMMENDATIONS
Two programs: Marketing (CIP 19.0203) and Telecommunications/fiber optics (CIP 15.0305) are recommended for closure. Both programs have low levels of member-town enrollment and many of the Telecommunications competencies are addressed in the electrical program.
Five programs: Barbering (CIP 12.0402), Hospitality (CIP 52.0901), Robotics (CIP 15.0403), Metal Fabrication and Joining Technologies (CIP 48.0599), and HVAC/R (CIP 47.0201) are aligned with or will be assimilated into existing or new programs. These programs have experienced lower than average member town enrollment, less than average career outcomes, and most competencies can be developed in analogous programs (barbering in cosmetology, hospitality in culinary arts, robotics in engineering, welding in advanced manufacturing, and HVAC/R in plumbing).
The movement towards an Academy Model provides the opportunity to deliver CVTE Core
Competencies within clusters of programs inside an Academy rather than in separate programs. This provides a level of efficiency and minimizes duplicative curriculum being offered. We believe this model will also provide for higher level competency attainment by upperclassmen as instruction will be able to focus on specific skills in the later part of the students high school career.
The administration has proposed opening new programs: Advanced Manufacturing (CIP 48.0501) and Multi-media Engineering (CIP 09.0701) in the Engineering, Construction, and Trades Academy. The Multi-Media Engineering program would operate under the CIP code for Radio and TV Broadcasting. The administration’s validation for these programs is supported in the data. Multi-media engineering encompasses the Creative Industries, provides a variety of regional career opportunities and student interest is clear. The opportunities for students in Advanced Manufacturing are well documented in a number of studies.
For the Life Sciences and Services Academy, while the overall data suggest that wages in the
occupations associated with many of these programs are average, there are attractive career paths in occupations that will remain in demand. Moreover, these programs are among the most popular at Minuteman (as measured by total member-town enrollment), particularly for female students, therefore supporting an overall gender balance.
The District seeks DESE endorsement of this plan as required under the MSBA Feasibility Study agreement. Once initial endorsement has been received, the District will submit closure plans for the identified programs and will initiate a timeline for the approval of two new programs. The determining factor in the timeline for the opening of new programs, is the approval of a building project by all 16 member district communities. That vote is scheduled for town meeting “season”; the spring of 2016.
The planning process underway at Minuteman now requires the timely input of DESE. All levels of the Minuteman Community have participated in numerous meetings and work sessions over the past few months and years to develop an educational plan and supporting facility design that will sustain our mission long into the future.
Minuteman acknowledges the work of several key assets:
The Minuteman Educational Program Plan Sub-committee was formed in the Spring of 2013 with the specific charge to review these data and recommend a final education program plan to the full School
4
Committee in the Fall of 2013. The challenge of proposing a plan for 435 students and 800 students made the process complex. The full school committee voted the original educational program plan October 8, 2013. As noted the District will not approve a school building project based upon a large out of district enrollment. The Education Program Plan Task Force was re-convened in the summer of 2014 to develop a plan for a smaller school.
Labor Market Works founder, Robert Vinson1, reviewed labor market information and provided a
comprehensive overview of job outlook projections and wage data in our Career Academies and related occupations.
The restructuring of the General Advisory Board (GAB) in 2009 has provided a pro-active group of employers and business leaders whose analyses of this data and review of its implications have been integrated into each academy comment section. 2
Program recommendations and implications have been developed through the lens of our “Six Indicators” with the assistance of our General Advisory Board members over the past 5 years.
Additional meetings, discussions and reviews by workforce education and development professionals within Commonwealth Corporation, The Center for Labor Market Studies at Northeastern University, and the Department of Labor and Workforce Developmenthave provided additional insight into this plan. 3
This report draws on standard state labor market information sources including: the Massachusetts Employment projections between 2010 and 2020 and the Massachusetts Occupational Wage Survey for Employment and Wages, May, 2012
Both data sources are produced by the Massachusetts Department of Labor and Workforce
Development.4 In addition, information from the US Department of Labor5, specifically ONET6 was used
to create the Crosswalk table between, Chapter 74 programs, related occupations, and major industry employers.
Local and regional labor market information was provided by employers serving on Minuteman Advisory Committees, or comes from data published by the Commonwealth Corporation, a quasi-public corporation within the Massachusetts Executive Office of Labor and Workforce Development.
Minuteman Mission
Minuteman collaborates with parents, communities, and business leaders to serve a diverse student body with multiple learning styles. Through a challenging, integrated curriculum our students develop the academic, vocational, and technical skills necessary to be productive members of a global community. We value life-long learning that fosters personal and professional development in a safe and respectful environment. Minuteman is committed to preparing all students for success.
5
Minuteman Philosophy
Career and Vocational/Technical Education is responsive to the economic needs of the workplace and the individual. By being engaged with employers, business, and post-secondary institutions, the graduates of Minuteman will be better prepared to contribute to the strength of our nation and the quality of life for its citizens. Minuteman recognizes the attainment of skills needed in the global economy is best accomplished through understanding the unique learning styles that lead to performance and individual student success.
Six Indicators of Educational Program Development
As Minuteman’s mission prepares individuals for a global economy, it must consider many variables when making adjustments to the type and scope of CVTE programming, including post-secondary program development, while being attentive to M.G.L. Chapter 74 regulations.7
Our investments in new programs are based on a review of labor market data including: job growth, living wage data, and student interest. In addition, Minuteman considers emerging technologies and their impact on occupations, other existing training sources outside the district, but available to learners, and the strength (or potential strength) of an industry partner. The partner may be a post-secondary institution, a community based organization, public agency, quasi-public agency, or regional employer. A seventh indicator, student placement, is considered when a program may be eliminated.
1. Job Growth
2. Opportunity for a Living Wage 3. Student Interest
4. The Potential of “Emerging” Occupations/Competencies 5. Existing Training Sources in proximity to the District 6. Presence or Potential of Strategic Industry Partner
While workforce development data (job growth and living wage) are historical in nature, emerging occupations data are projected and require a mixture of research, risk, common sense, and industry advice. Student interest is measured in (historical) enrollment data for existing programs and in student interest survey data. The fifth indicator relates to the availability of similar training programs in the area. This is a significant market factor that is often overlooked when program development decisions are being made. Minuteman reviews the capacity and enrollment trends of similar programs in the region prior to investing. For example, if 8 schools are graduating 12 students per year and the region needs 50 new auto mechanics per year, then the region is training more students than can be absorbed by the market. The sixth indicator is the relative strength of an industry partner that seeks to support expansion. No single variable is a final determinant for a program being launched or terminated.
Other “indicators” or variables that are considered by administration when making an investment in a new program include nontraditional student interest as well as the opportunity for public interaction.
6
Labor Market Overview
The U.S. and Massachusetts labor markets began pulling out of the last recession towards the beginning of 2010. As a result, the employment outlook for Massachusetts and most of the programs offered by Minuteman High School reflect a significant improvement from earlier projections. At the same time, the majority of job openings in the (62.1%) in the Massachusetts economy will result from replacement needs rather than growth.
Between 2010 and 2020, the Massachusetts economy is projected to add 461,725 jobs, a growth rate of 13.7%. While some may view this as an optimistic forecast, the projected rate is significantly higher than the 6.3 % growth rate from the earlier 2006 to 2016 projections. In total, over 1.25 million openings are anticipated during the 2010-2020 projection period.
Post-Graduate Programs
In addition to high school offerings, Minuteman offers post-graduate programs through the Minuteman Technical Institute (MTI). Most programs are 1-2 years in length with sessions beginning in September and February.8 The following PG Programs are offered through MTI, on site during the day in
dedicated shop spaces: Automotive Technology, Building Construction Technology (Carpentry), Cosmetology, Dental Assisting, and Bio-Manufacturing. Automotive and Building Construction
Technology are offered in cooperation with Middlesex Community College and provide Associate Degree opportunities to post-grad students.
Other opportunities for post-graduate students are provided on a space available basis in Electrical Wiring, Heating/Ventilation/Air Conditioning/Refrigeration, Plumbing, Culinary
Arts/Baking/Hospitality Management, and Horticulture & Landscape Technology.
A significant concern has arisen in the MSBA process and regulation regarding Post Graduate Education. Simply put, MSBA WILL NOT participate in Chapter 74 approved post-graduate facility development. Even though DESE includes these PG students in their mission of delivering high quality CVTE in the Commonwealth, the agency created to support the construction of CVTE learning
environments, has no authority or obligation to work with any School District in providing this much needed training.
7
EXECUTIVE SUMMARY: LABOR MARKET INFORMATION ANALYSIS
The Labor Market Information Analysis, conducted for the Minuteman Regional Vocational Technical School District (MRVTSD) reviewed each of the Chapter 74 programs within the existing three (3) Clusters: Trades and Transportation, Bioscience and Engineering, and Human, Business and Commercial Services. The analyses also included the PROPOSED Chapter 74 programs in the PROPOSED two (2) Career Academies: The Engineering, Construction, and Trades Academy and Life Sciences and Services Academy. The Summary is organized by the TWO PROPOSED Career
Academies.
The principal data sources included the Massachusetts Occupational Employment Projections, 2010-2020, and Occupational Wage Survey, May 2012, produced by the Massachusetts
Department of Labor and Workforce Development. In addition, the Industry Occupation Matrix and O*NET from the US Department of Labor were also integral to the analysis. O*NET is the career information and job analysis tool that replaced the Dictionary of Occupational Titles (DOT).
There are more than 60 specific industries related to existing and proposed Chapter 74 Programs offered by MRVTSD.
While the labor market outlook for most of the Chapter 74 programs is positive, there is a wide variation across programs and related occupations. The variations are related to the size of specific occupations, projected growth rates, the total number of annual openings and the importance of openings due to growth or replacement. Perhaps most significantly is the large variation in both entry level and median annual wages.
Engineering, Construction, and Trades Academy
Most of the occupations in this academy are characterized by moderate growth rates, with openings due primarily to replacement. Plumbers, Electricians and Heating Ventilation Air Conditioning Mechanics (HVAC/R) are among those occupations with the largest number of projected openings.
An exception within this academy occurs among Automotive Service Technicians and Carpenters. There is very little growth anticipated for these two occupations, but due to their size, they have the largest number of projected openings. Almost all of the openings will be due to replacement.
A positive feature of this academy is the 2012 entry level wages, with Carpenters at $36,180, Telecommunications Equipment Installers at $38,980, HVAC Mechanics at $39,180, Electricians at $41,110, and Plumbers at $42,630.
8
In the Programming and Web Design area, the labor market outlook for the three occupations related to Computer Programming is quite positive. Computer Support Specialists are expected to add just over 4,000 jobs during the projection period, followed by Other Computer Specialists, such as Information Security Analyst and Web Designers (2,751 jobs) and Computer Programmers (1,255 jobs).
Another positive aspect of the above occupations is the wages. Other Computer Specialists (Information Security Analyst and Web Designers) reported the highest entry level wages ($61,220), followed by Computer Programmers ($52,750) and Computer Support Specialists ($38,680).
Within Design and Visual Communication, Graphic Designers are projected to add 1,221 jobs which translate to 360 annual openings. The entry level wage for this occupation is $36,120.
The largest of the six occupations related to Multi-Media Engineering, Audio and Video Technicians, is expected to add nearly 600 jobs over the projection period, while the second
largest, Multi-Media Artists, is anticipating an increase of 218 jobs. All of the remaining occupations including Set Designers, Sound and Engineering Technicians, and Camera and Video Operators, are expected to add fewer than 100 jobs over the projections period. The exception is Film and Video Editors, with 121 jobs.
Among the six occupations related to Entertainment Engineering, entry level wages range from $24,300 (Sound Engineering Technicians) to $41,850 (Multi-Media Artists).
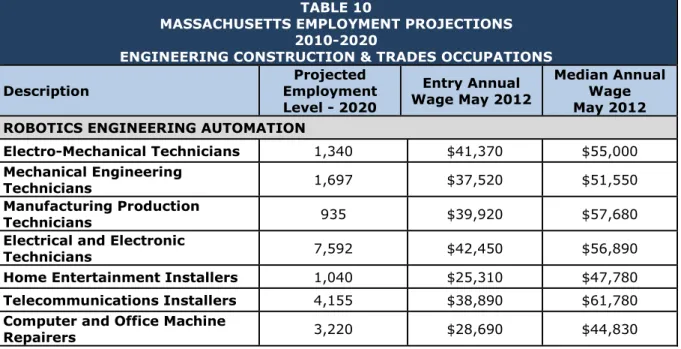
The three occupations related to Robotics and Automation include Manufacturing Production Technicians, Mechanical Engineering Technicians and Electro-Mechanical Technicians. These occupations are projected to grow slightly below the statewide rate of 13.7%. As these occupations are also small, fewer than 50 annual openings are expected.
Three of the five occupations related to Engineering are expected to grow slowly. However, the biggest occupation, Electrical and Electronic Technicians, is projected to add 558 jobs, with almost 200 annual openings.
While the growth prospects for the occupations in this academy are modest, the wages are a draw for program graduates. Entry level wages for the two Technician occupations range from $41,370 (Mechanical Engineering Technicians) to $42,450 (Electrical and Electronic Technicians).
Life Sciences and Services Academy
The labor market outlook for the six occupations related to Bioscience and Bio-Manufacturing is quite bright. The growth rate for each occupation exceeds the state wide average of 13.7%. The largest occupation, Biological Technicians, is expected to add nearly 1,100 jobs, with 278 annual openings. The three occupations related to Bio Manufacturing (Medical Equipment Repairers,
9
Medical Equipment Preparers and Medical Appliance Technicians), though small, have among the fastest projected growth rates for all occupations.
The wages for occupations in this group are also attractive. Entry level wages for the five
Technician and Repair occupations range from just under $30,000 to $35,460. The highest entry wage is for Biological Scientists at $61,640. This occupation, however, requires at least a Bachelor’s Degree.
The dominant occupation within Horticulture and Landscaping is Landscapers and Groundskeepers. It is one of the Commonwealth’s largest occupations with a projected employment increase of nearly 6,000 jobs. This translates to over 1,000 annual openings. The wages, however, are quite modest with entry level wages of $23,520 and a median wage of $31,440. The wages reflect in part the seasonal nature of landscaping and grounds keeping work.
The growth rate for three of the four Environmental Technology occupations (Environmental Engineering Technicians. Environmental Science and Protection Technicians, and Hazardous Waste Removal Workers) is expected to grow faster than the Commonwealth, as a whole. These are small occupations, however, with the range of annual openings being between 30 and 70.
Entry lever wages range for the above occupations range from $28,080 (Environmental Science and Protection Technicians) to $35,100 for Environmental Engineering Technicians. It should be noted that these two occupations typically require an Associate’s Degree.
Health Assisting, Cosmetology and Early Childhood Education are the three programs with the most absolute openings in related occupations. Among specific occupations with large numbers of
openings (exceeding 1,000 annually) are Child Care Workers, Nurse’s Aides, Personal /Home Care Aides and Home Health Aides. In addition, Hairdressers and Cosmetologists is also an occupation with a large number of openings, approaching 800 annually.
The wages for some occupations in this academy are modest, at best. Median Wages for the three Aide and Cosmetologist occupations were less than $29,000 while the median wage for Child Care Workers was under $25,000. One notable exception was Kindergarten Teachers with a median wage above $60,000.
Culinary Arts occupations were characterized by below average growth and low entry wages. In fact, two occupations (Chef’s and Head Cooks, and Fast Food Cooks) were actually expected to decline. Job openings will exist and be due primarily to replacement. The one occupation with an above average growth rate was Institution and Cafeteria Cooks.
Most of the Culinary occupations reported entry level wages between $17,000 and $20,000, and median wages between $19,000 and $30,000. The one exception was Chefs and Head cooks with an entry wage of $37,820.
10
Modest growth was also projected for most occupations related to Hospitality and Tourism with entry level wages running between $19,430 (Hotel and Desk Clerks) and Travel Agents ($28,670).
The notable exception in the Hospitality field was Meeting and Convention Planners. This occupation has rapid projected growth (53.5%), the largest number of annual openings (nearly 1,100), and an entry level wage of $37,680.
INDUSTRIES AND OCCUPATIONS RELATED TO CHAPTER 74 PROGRAMS
A list of detailed industries related to at least one Chapter 74 Program is presented in Table A, shown in the Appendix. As the list indicates, there are more than 60 detailed industries relevant to programs offered by Minuteman range of industries relevant to these programs. The industries included in Table A provide a framework for connecting industries related to Minuteman programs with local employers.
The difference between industries and occupations is that industries are where people work and occupations are what people do. To amplify the relationship between specific programs, related occupations and key industries, a cross reference between each of the Chapter 74 programs offered by Minuteman is presented in Table B, shown in the Appendix. This crosswalk is especially important, since many instructional programs typically prepare students for more than one occupation,
There are essentially two distinct groups of Chapter 74 programs included in Table B. The first group consists of programs where there is a direct connection to one or two specific occupations and a small number of key industries. This group of programs would include as examples Construction Trades, Early Childhood Education, and Cosmetology,. The labor market advantage of programs in this group is that it is easier to identify specific employers and potential employment opportunities. The disadvantage is that if the key industries are experiencing labor market difficulties, job placement opportunities can quickly become limited.
Many of remaining programs, particularly Multi-Media Engineering, are characterized as having a number of different occupational entry points and a much larger array of industries that are related to the programs. The labor market advantage of these programs is there are a wider set of occupations and industries that might potentially need new graduates. Furthermore, if one or two key industries are experiencing labor market difficulties there are likely to be placement opportunities in other related industries. The disadvantage is that program staff will need to work with a much larger and broader employer network than for those programs with more direct occupational and industry connections.
The Health Assisting and Culinary Arts programs share features of both groups. While Health Assisting graduates will be able to focus on a relatively small group of Health related industries, there are a number of potentially different occupational entry points as indicated in Table B. With regard to
11
Culinary Arts, there are a number of variations with regard to occupational options (e.g.; Chefs, Institutional Cooks, and Short-Order Cooks etc.) but a narrow set of industries associated with Hospitality that would potentially hire graduates from a Culinary Arts program.
12
EMPLOYMENT PROJECTIONS AND WAGE SUMMARIES
A. Engineering, Construction, & Trades Academy
1. Occupational Employment Projections Summary 2010-2020
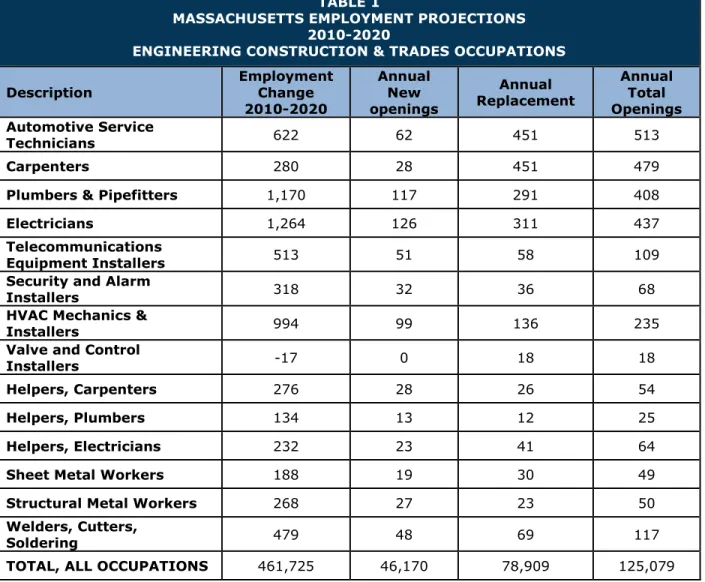
Table 1 and Table 2 provide employment projections for the Engineering, Construction, and Trades Academy. The overall employment change and the annual number of openings due to both growth and replacement are included in Table 1. Information pertaining to the projected growth and the share of openings related to growth and replacement are included in Table 2.
TABLE 1
MASSACHUSETTS EMPLOYMENT PROJECTIONS 2010-2020
ENGINEERING CONSTRUCTION & TRADES OCCUPATIONS
Description Employment Change 2010-2020 Annual New openings Annual Replacement Annual Total Openings Automotive Service Technicians 622 62 451 513 Carpenters 280 28 451 479
Plumbers & Pipefitters 1,170 117 291 408
Electricians 1,264 126 311 437
Telecommunications
Equipment Installers 513 51 58 109
Security and Alarm
Installers 318 32 36 68
HVAC Mechanics &
Installers 994 99 136 235
Valve and Control
Installers -17 0 18 18
Helpers, Carpenters 276 28 26 54
Helpers, Plumbers 134 13 12 25
Helpers, Electricians 232 23 41 64
Sheet Metal Workers 188 19 30 49
Structural Metal Workers 268 27 23 50
Welders, Cutters,
Soldering 479 48 69 117
TOTAL, ALL OCCUPATIONS 461,725 46,170 78,909 125,079
The overall outlook for this academy is much improved from earlier projections. This likely reflects an improvement in the economy and specifically the private and commercial real estate and housing markets. As Table 1 indicates, the projected employment change is most pronounced for Electricians (1,264), Plumbers and Pipefitters (1,170) and HVAC Mechanics (994). A slightly different
13
picture emerges with regard to annual job openings. Among the Construction Trade occupations, Carpenters has the most projected annual openings (479), followed by Electricians (437), Plumbers and Pipefitters (408) and HVAC Mechanics (235). While Carpenter has a minimal growth rate (1.3%), it is the largest Trade occupation which accounts for it having the most openings. It should be noted that the projected openings for Construction are due almost entirely to replacement.
TABLE 2
MASSACHUSETTS EMPLOYMENT PROJECTIONS 2010-2020
ENGINEERING CONSTRUCTION & TRADES OCCUPATIONS
Description Percent Employment Change 2010-2020 Percent Openings Due To Growth Percent Openings Due Replacement
Automotive Service Technicians 3.6 12.1 87.9
Carpenters 1.3 5.8 94.2
Plumbers & Pipefitters 11.6 28.7 71.3
Electricians 11.0 28.9 71.1
Telecommunications Equipment
Installers 13.9 46.8 53.2
Security and Alarm Installers 21.7 47.1 52.9
HVAC Mechanics & Installers 12.9 42.1 57.9
Valve and Control Installers -7.9 0 100.0
Helpers, Carpenters 27.7 51.9 48.1
Helpers, Plumbers 28.5 52.0 48.0
Helpers, Electricians 14.9 36.0 64.0
Sheet Metal Workers 10.5 38.8 61.2
Structural Metal Workers 27.4 54.0 46.0
Welders, Cutters, Soldering 18.6 41.0 59.0
TOTAL, ALL OCCUPATIONS 13.7 37.9 62.1
A closer look at Table 2 indicates that with the exception of Carpenters, most of the Trade occupations, including Sheet Metal workers and Welders are near the overall projected growth rate of 13.7% for the entire Massachusetts economy. However there are several smaller occupations with growth rate well in excess of the statewide rate including Helpers for both Plumbers (28.5%) and Carpenters (37.7%). In addition, Structural Metal Workers (27.4%) and Security and Alarm Installers (21.7%) are projected to grow much faster than the state. Conversely, the one occupation expected to decline is Valve and Control Installers. This may due in part that Valve and Control Installation is becoming a skill imbedded in other occupations such as HVAC mechanics rather than functioning as a discreet occupation.
14
Automotive Service Technicians have an employment outlook that is very similar to Carpenters. The projected growth rate is quite small (3.6% but this occupation has the largest number of projected openings (513) in the academy. Automotive Service Technicians is the second largest occupation, which accounts for the large number of openings.
The skills needed for this occupation are constantly evolving. Increased specialization along with a greater emphasis on electronics has heightened the importance of proper training. Individuals certified in multiple specialties such as engine repair, electrical systems, and brake systems will be seen as most desirable by prospective employers. Furthermore, nearly one-third of all Auto Service
Technicians between the ages of 25-44 have some post-secondary education, with many holding an Associate’s Degree.
The labor market outlook for the three occupations that are associated with Computer
Programming and Web Design are quite positive. Computer Support Specialists, the largest occupation in the group is projected to increase employment by over 4,000 jobs or 21.0 percent. This translates into 910 annual openings, with 405 related to growth. Another Computer Specialist occupation, Information Security and Web Design, is the fastest growing occupation with employment expected to increase by 29.9%, representing an employment increase of 2,751 jobs. Annual openings for this occupation will total 411, with two thirds of the openings related to growth. The third occupation, Computer Programmers has a growth rate similar to the state (13.5%), with employment expanding by 1,255 jobs. A total of 342 annual openings are anticipated, with the majority related to replacement.
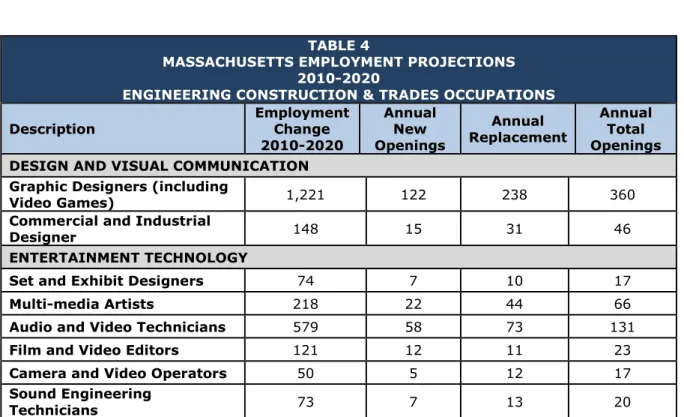
The outlook for Graphics Designers (which includes Video Games) is comparable to the state as whole. During the projections period, Graphic Designers are expected to grow by 15.9%, an increase of 1,221 jobs representing 360 annual openings. Most of the projected openings (238) are due to
replacement. The growth rate for Commercial and Industrial Designers (19.5%) represents an employment increase of 148 jobs and 46 annual openings.
With the exception of Camera and Video Operators, all of the occupations related to Multi Media Engineering are expected to grow as fast or faster than the overall labor market. Audio and Video Technicians (22.6%), Set and Exhibit Designers (22.0%) and Film and Video Editors (20.3%), are all well above the state wide rate of 13.7%.The largest increase belongs to Audio and Video Technicians (579), followed by Film and Video Editors (121) and Set and Exhibit Designers (74). The respective numbers of annual openings are 131, 23, and 17.
Although the growth rate for Multi Media Artists is lower (11.9%), the employment change of 218 is the second largest of the Entertainment Technology occupations, with 66 annual openings. The growth rate for Sound Engineering Technicians of 15.6% represents an employment increase of 73 jobs, with 20 annual openings.
The projected growth rates for the three occupations related to Robotics and Automation Technology, manufacturing Productions Technicians (11.6%), Mechanical Engineering technicians (11.3%) and Electro-Mechanical Technicians (10.3%) are all slightly below the statewide growth rate of 13.7%. The respective increases in employment are 97, 172 and 125. As these occupations are small, fewer than 50 annual openings are available for each occupation. It appears that productivity gains
15
associated with automation and improved manufacturing processes, including the use of Robotics will to a large extent limit the demand for these occupations. If however, the application of robotics technology moves further into areas that are related to human safety, such as drones or removing debris and hazardous materials, the outlook could improve.
With the exception of Telecommunications Installers (13.9%), the remaining occupations related to Engineering Technology are all expected to fall below the statewide growth rate. The largest occupation, Electrical and Electronic occupations while anticipating modest growth (7.9%) it is
expected to add 558 jobs over the projections period, representing almost 200 annual openings. The number of Telecommunications Installers is expected to grow by 513 jobs, with a little over 100 annual openings. The Computer and Office Machine repairers are expected to add 133 jobs as compared to just 42 for Home Equipment Installers.
TABLE 3
MASSACHUSETTS EMPLOYMENT PROJECTIONS 2010-2020
ENGINEERING CONSTRUCTION & TRADES OCCUPATIONS
Description Employment Change 2010-2020 Annual New Openings Annual Replacement Annual Total Openings PROGRAMMING AND WEB DESIGN
Computer Programmers 1,255 126 216 342
Computer Support Specialists 4,047 405 505 910
Information Security and
Web Design 2,751 275 136 411
TABLE 4
MASSACHUSETTS EMPLOYMENT PROJECTIONS 2010-2020
ENGINEERING CONSTRUCTION & TRADES OCCUPATIONS
Description Employment Change
2010-2020 Annual New Openings Annual Replacement Annual Total Openings DESIGN AND VISUAL COMMUNICATION
Graphic Designers (including
Video Games) 1,221 122 238 360
Commercial and Industrial
Designer 148 15 31 46
ENTERTAINMENT TECHNOLOGY
Set and Exhibit Designers 74 7 10 17
Multi-media Artists 218 22 44 66
Audio and Video Technicians 579 58 73 131
Film and Video Editors 121 12 11 23
Camera and Video Operators 50 5 12 17
Sound Engineering
16 TABLE 5
MASSACHUSETTS EMPLOYMENT PROJECTIONS 2010-2020
ENGINEERING CONSTRUCTION & TRADES OCCUPATIONS
Description Employment Change
2010-2020
Annual New Openings
Annual
Replacement Annual Total Openings ROBOTICS AND AUTOMATIC TECHNOLOGY
Electro-Mechanical Technicians 125 12 23 35 Mechanical Engineering Technicians 172 17 29 46 Manufacturing Production Technicians 97 10 16 26 ENGINEERING TECHNOLOGY Electrical and Electronic
Technicians 558 56 134 190
Home Entertainment
Installers 42 4 24 28
Telecommunications
Installers 513 51 58 109
Computer and Office Machine
Repairers 133 13 76 89
TABLE 6
MASSACHUSETTS EMPLOYMENT PROJECTIONS 2020-2020
ENGINEERING CONSTRUCTION & TRADES OCCUPATIONS
Description Percent Employment Change 2010-2020 Percent Openings Due To Growth Percent Openings Due Replacement PROGRAMMING AND WEB DESIGN
Computer Programmers 13.5 36.8 63.2
Computer Support Specialists 21.0 44.5 55.5
Information Security and Web design 29.9 67.0 33.0
DESIGN AND VISUAL COMMUNICATION
Graphic Designers(includes Video Games) 15.9 33.9 66.1
Commercial and Industrial Designers 19.5 32.6 67.4
MULTI-MEDIA ENGINEERING
Set and Exhibit Designers 22.0 41.1 58.9
Multi-Media Artists 11.9 33.3 66.7
Audio and Video Technicians 22.6 44.3 55.7
Film and Video Editors 20.3 52.2 4.8
Camera and Video Operators 7.9 29.4 70.6
Sound Technicians 15.6 35.0 65.0
ROBOTICS ENGINEERING AUTOMATION
Electro-Mechanical Technicians 10.3 34.3 65.7
Mechanical Engineering Technicians 11.3 37.0 63.0
Manufacturing Production Technicians 11.6 38.5 61.5
Electrical and Electronic Technicians 7.9 29.5 70.5
Home Entertainment Installers 4.2 14.3 85.7
17
Computer and Office Machine Repairers 4.3 14.6 85.4
TOTAL, ALL OCCUPATIONS 13.7 37.9 62.1
2. Employment and Wage Summary May 2012
The following summary pertains to employment and wages for Carpentry, Plumbing, Welding, HVAC/R, Automotive Technology, and Electrical. Both the Entry Level and Median Annual Wages are included in Table 7.
TABLE 7
MASSACHUSETTS EMPLOYMENT LEVELS AND WAGES ENGINEERING CONSTRUCTION & TRADES OCCUPATIONS
Occupation Employment Projected
Level—2020 Entry Annual Wage May 2012 Median Annual Wage May 202 Automotive Service Technicians 18,056 $28,110 $41,110 Carpenters 21,558 $36,180 $53,360
Plumbers & Pipefitters 11,247 $42,630 $62,790
Electricians 12,790 $41,110 $59,420
Telecommunications
Equipment Installers 8,477 $38,980 $61,700
Security and Alarm
Installers 1,787 $38,290 $52,130
HVAC Mechanics &
Installers 8,690 $39,180 $56,290
Valve and Control
Installers 877 $38,760 $60,450
Helpers, Carpenters 1,273 $27,220 $35,550
Helpers, Plumbers 605 $17,590 $28,840
Helpers, Electricians 1,794 $24,900 $33,230
Sheet Metal Workers 1,985 $32,460 $57,050
Structural Metal
Workers 1,463 $29,360 $40,950
Welders, Cutters,
Soldering 3,054 $31,290 $43,840
With the exception of the Helper occupations and Structural Metal Workers, all of the Construction Trade occupations have entry level wages exceeding $30,000 with most of the
occupations exceeding $36,000. At the very top of this group are Plumbers and Pipefitters ($42,630), Electricians, ($41,110) and HVAC Mechanics ($39,180). A review of the median annual wag reveals a similar relationship. The majority of the occupations in this academy exceed $52,000, with Plumbers and Pipefitters ($62,790) and Telecommunication Equipment Installers ($61,700) leading the way.
The entry level wages for Structural Metal Workers was $29,360, while for Welders it was $31,290. The respective median wages were $40,950 and $43,840. Among the Helper occupations, Carpenters had the highest entry wage ($27,220) followed by Electricians ($24,900) and Plumbers ($17,590). The median wage for Carpenter Helpers was $35,550, with Electrician Helper ($33,320)
18
slightly behind. The median wage for Plumber Helpers was $28,840. With regard to Automotive Service Technicians, the entry level wage was $28,110 as compared to the median wage of $41,110. It is likely that those Technicians with multiple specialties and certifications will command higher wages.
Tables 8 through 27 provide employment projections information for the Programming and Web Design, Design and Visual Communication, Entertainment Technology, and Robotics Engineering Automation Programs.
Although the labor market outlook for Engineering Technology program graduates is mixed, the wages remain an attractive feature, especially for the Computer Programming and Web Design occupations. The entry level wage for Other Computer Specialists (Information Security and Web Designers) is $61,220, followed by Computer Programmers ($52,750) and Computer Support
Specialists ($38,680). The median wage of $88,360 for Information Security and Web Designers is the highest of all occupations in the entire Engineering Technology Academy. The median wages for both Computer Programmers ($76,270) and Computer Support Specialists ($56,580) are also well paying.
All of the Technician occupations related to both Robotics and Engineering Technician occupations have entry level wages that exceed $37,000, with Electronic Technicians ($42,450) and Electro-Mechanical Technicians ($41,370) at the top. With regard to median wages, all but Mechanical Engineering Technicians exceed $55,000. At the top end are Telecommunications Equipment Installers and Repairers ($61,780). The entry level wages for Home Entertainment Installers ($25,310) and Computer and Office Machine repairers $28,690) are at the lower end of this queue. The respective median wages are $47,780 and $44,830.
The very large Graphics Designer occupation reported an entry level wage of $36,120 and a median wage of $50,410. Among the remaining occupations in the Design and Multi Media Engineering programs, Commercial Designers was at the top, with a median wage of $65,710 followed by Multi-Media Artists ($62,460). Set Designers and Film and Video Editors both had median wages in excess of $58,100. The remaining occupations reported median wages for Audio and Video Technicians
($47,170), Sound Engineering Technicians ($40,010) and Camera and Video Operators ($37,920). At the entry level, wages ranged from a low of $24,300 for Sound Engineering Technicians to a high of
$43,800 for Commercial and Industrial Designers.
TABLE 8
MASSACHUSETTS EMPLOYMENT LEVELS AND WAGES ENGINEERING CONSTRUCTION & TRADES OCCUPATIONS
Description Projected Employment
Level - 2020 Entry Annual Wage May 2012 Median Annual Wage May 2012 PROGRAMMING AND WEB DESIGN
Computer Programmers 10,552 $52,750 $76,270
Computer Support Specialists 23,289 $38,680 $56,580
Information Security and Web
19 TABLE 9
MASSACHUSETTS EMPLOYMENT PROJECTIONS 2010-2020
ENGINEERING CONSTRUCTION & TRADES OCCUPATIONS
Description Projected Employment Level - 2020 Entry Annual Wage May 2012 Median Annual Wage May 2012 DESIGN AND VISUAL COMMUNICATION
Graphic Designers (including
Video Games) 8,892 $36,120 $50,410
Commercial and Industrial
Designer 1,157 $43,800 $65,710
MULTI-MEDIA ENGINEERING
Set and Exhibit Designers 411 $33,740 $58,920
Multi-media Artists 2,055 $41,850 $62,460
Audio and Video Technicians 3,137 $33,710 $47,140
Film and Video Editors 715 $34,790 $58,010
Camera and Video Operators 684 $27,720 $37,920
Sound Engineering Technicians 540 $24,300 $40,010
TABLE 10
MASSACHUSETTS EMPLOYMENT PROJECTIONS 2010-2020
ENGINEERING CONSTRUCTION & TRADES OCCUPATIONS
Description Employment Projected
Level - 2020 Entry Annual Wage May 2012 Median Annual Wage May 2012 ROBOTICS ENGINEERING AUTOMATION
Electro-Mechanical Technicians 1,340 $41,370 $55,000
Mechanical Engineering
Technicians 1,697 $37,520 $51,550
Manufacturing Production
Technicians 935 $39,920 $57,680
Electrical and Electronic
Technicians 7,592 $42,450 $56,890
Home Entertainment Installers 1,040 $25,310 $47,780
Telecommunications Installers 4,155 $38,890 $61,780
Computer and Office Machine
Repairers 3,220 $28,690 $44,830
B. Life Sciences and Services Academy
1. Occupational Employment Projections Summary 2010-2020
Tables 11 through Table 14 provide employment projections for the Chapter 74 Programs related to Bio Science and Life Science. These programs include Bio-Technology, Horticulture and Landscaping and Environmental Science and Technology.
The labor market outlook for the six occupations related to Bio Science is quite bright. While most of these occupations are small with the exception of Biological Technicians, the growth rates for
20
all six occupations exceed the state wide average. The occupation with the most absolute growth is Biological Technicians which is expected to expand by nearly 1,100 jobs, with total annual openings of 278. The Chemical Technician occupation is expected to add 470 jobs over the projection period, with 81 annual openings. Biological Scientists which is the smallest of the Bio Tech occupations should add fewer than 200 jobs over the projection period, representing 44 annual openings. It should be noted that Biological Scientists are required to have at a minimum an advanced degree, and more often a graduate degree.
Employment opportunities will be concentrated in the Life Science industries, including
Pharmaceutical and Scientific Research firms. Maintaining and expanding local employer relationships is essential. This is especially true since most Life Sciences employers typically look for individuals with a Bachelor’s degree. The future prospects for graduates of this program are very positive in the Route 128 corridor.
Although small, the three occupations related to Bio Manufacturing are projected to grow much faster than the statewide average. The labor market picture for graduates from Medical
Equipment Repairers is also bright with a projected growth rate of nearly 40%, an increase of 328 jobs over the projections period. Individuals employed in this occupation inspect, test and repair medical equipment should find openings due to both growth (33) and replacement (24). Medical Appliance Technicians who fit and repair braces, supports and prosthesis is one of the fastest growing
occupations, increasing employment by almost 50% and adding 356 jobs. Medical Equipment
Preparers (different than Repairers), clean instruments and detect equipment leaks and loose parts is expected to grow by nearly 20% and add just over 214 jobs.
Among the occupations related to Horticulture and Landscaping, the largest occupation by far is Landscapers and Groundskeeper. In fact it is one of the largest occupations in the entire Massachusetts economy. During the projections period, nearly 6,000 jobs are expected to be added, representing a growth rate of almost 25%. A total of just over 1,000 openings are expected annually, with the majority due to growth. Pest Control Workers was projected to add 264 jobs, representing a growth rate of just fewer than 30%. This translates to 66 annual openings.
The outlook for the two remaining occupations related to Horticulture and Landscaping is much less favorable. Employment among Florist is expected to decline while for Nursery and Greenhouse Workers it is unchanged. There will however, be a small number of replacement openings for both Florists (45) and Nursery Workers (74).
Among the four occupations related to Environmental Science, Environmental Engineering Technicians and Environmental Science and Protection Technicians often require an Associate’s Degree. By comparison, Hazardous Waste Removal Workers and Water and Waste Treatment
Operators can obtain entry level positions with vocational training or post-secondary education below the Associate’s Degree.
The growth rate for three of the Environmental Technology-related occupations exceeds the overall average for Massachusetts. Projected growth for Environmental Engineering Technicians (27.9%) and Environmental Science and Protection Technicians (19.5%) is especially positive. A total of
21
180 and 204 jobs, respectively, will be added during the projections period. This translates into 30 and 60 annual job openings for these two occupations. Hazardous Waste Removal workers are expected to increase employment by 301 jobs, for a growth rate of almost 20%, resulting in 70 annual openings.
The one occupation with a negative outlook is Water and Waste Treatment Operators.
Employment is projected to decline slightly (-11 jobs) but 63 annual openings are anticipated to meet replacement needs.
TABLE 11
MASSACHUSETTS EMPLOYMENT PROJECTIONS 2010-2020
LIFE SCIENCES AND SERVICES OCCUPATIONS
Description Employment Change 2010-2020 Annual New Openings Replacement Openings Annual Total Openings BIO-TECHNOLOGY Biological Scientists 194 19 25 44 Biological Technicians 1,062 106 172 278 Chemical Technicians 470 47 34 81 BIO-MANUFACTURING
Medical Appliance Technicians 356 36 22 58
Medical Equipment Preparers 214 21 17 38
Medical Equipment Repairers 328 33 24 57
TABLE 12
MASSACHUSETTS EMPLOYMENT PROJECTIONS 2010-2020
LIFE SCIENCES AND SERVICES OCCUPATIONS
Description Employment Change 2010-2020 Annual New Openings Replacement Openings Annual Total Openings HORTICULTURE AND LANDSCAPING
Landscapers and
Groundskeepers 5,931 593 445 1,038
Pest Control Workers 264 26 40 66
Nursery/Greenhouse Workers 0 0 74 74
22 TABLE 13
MASSACHUSETTS EMPLOYMENT PROJECTIONS 2010-2020
LIFE SCIENCES AND SERVICES OCCUPATIONS
Description Employment Change 2010-2020 Annual New Openings Replacement
Openings Annual Total Openings ENVIRONMENTAL TECHNOLOGY
Environmental Engineering
Technicians 180 18 12 30
Environmental Science &
Protection Techs 204 20 40 60
Hazardous Waste Removal
Workers 301 30 40 70
Water & Waste Treatment
Plant Operators -11 0 63 63
TABLE 14
MASSACHUSETTS EMPLOYMENT PROJECTIONS 2020-2020
LIFE SCIENCES AND SERVICES OCCUPATIONS
Description Percent Employment Change 2010-2020 Percent Openings Due To Growth Percent Openings Due Replacement BIO-TECHNOLOGY Biological Scientists 17.4 43.2 56.8 Biological Technicians 20.8 38.1 61.9 Chemical Technicians 19.6 58.0 42.0 BIO-MANUFACTURING
Medical Appliance Technicians 49.7 62,.0 38.0
Medical Equipment Preparers 18.9 55.3 46.7
Medical Equipment Repairers 37.2 57.9 42.1
HORTICULTURE AND LANDSCAPING
Landscapers and Groundskeepers 23.5 57.7 42.3
Pest Control workers 29.5 39.4 60.6
Nursery/Greenhouse Workers No change 0 100.0
Florists -15.8 0 100.0
ENVIRONMENTAL TECHNOLOGY
Environmental Engineering Technicians 27.9 60.0 40.0
Environmental Science and Protection
Technicians 21.5 33.3 66.7
Hazardous Waste Removal Workers 19.9 42.8 57.2
Waster and Water Treatment Plant
Operators -0.5 0 100.0
23
Health Assisting, Cosmetology, and Early Childhood Education are the three programs with the most absolute openings in related occupations. Among specific occupations with large numbers of openings (exceeding 1000 annually) were Child Care Workers, Nurse’s Aides, Personal/Home Care Aides and Home Health Aides. As Table 15 indicates, the growth rates for these 4 occupations, as well as many others in these three programs exceed the statewide growth rate by a wide margin. In
addition, Hairdresser is also an occupation with a large number of openings, approaching 800 annually. With regard to Culinary Arts, with the exception of Institutional Cooks, all the other occupations are projected to have growth rates well below the statewide average (see Table 16) with Chefs: Fast Food Cooks actually declining. Replacement will account for most of the openings and be especially prevalent among Restaurant Cooks and Food Preparation workers.
A major advantage of the occupations in Health Assisting, Cosmetology and Early Childhood Education, as well as Culinary Arts, irrespective of employment projections is that jobs in these fields are spread throughout the Commonwealth and are not geographically concentrated like many in the technical and science fields. This condition provides job seekers with a great deal of flexibility in finding the right type of position and location that best meets their needs.
The overall outlook for Hospitality and Tourism is, for the most part, quite modest in terms of both employment change and the projected number of openings. Growth rates for Flight Attendants, Hotel Lodging Managers, and Hotel resort Clerks are well below average although the number of annual openings for Hotel Clerks (236) reflects their replacement needs. Tour Guides and Travel Agents are anticipating growth rates comparable to the statewide rate, but as they are small
occupations each has fewer than 70 annual openings. The major exception among the Hospitality and Tourism program is Meeting and Convention Planners. Employment in this occupation is expected to grow by over 50%, representing an increase of 1,076 jobs during the projections period. In addition, nearly 75% of the 146 annual openings are due to growth which is a sign of a rapidly growing and dynamic occupation.
24
TABLE15
MASSACHUSETTS EMPLOYMENT PROJECTIONS 2006-2016
LIFE SCIENCES AND SERVICES OCCUPATIONS
Description Employment Change 2010-2020 Annual New Openings Annual Replacement Annual Total Openings HEALTH ASSISTING OCCUPATIONS
Medical Assisting 2,421 242 203 445
Home Health Aides 9,360 936 225 1,161
Nurse’s Aide 8,057 810 539 1,349
Personal and Home Care
Aides 9,921 992 173 1,165
TABLE 16
MASSACHUSETTS EMPL0YMENT PROJECTIONS 2010-2020
LIFE SCIENCES AND SERVICES OCCUPATIONS
Description Employment Change 2010-2020 Annual New Openings Annual Replacement Annual Total Openings CULINARY ARTS & HOSPITALITY
Chefs and Head Cooks -136 0 61 61
Cooks, Fast Food -422 0 138 138
Cooks, Institutions &
Cafeterias 1,529 153 183 336
Cooks, Restaurants 2,115 212 514 726
Cooks, Short Order 96 10 79 89
Bakers 339 34 131 165
Food Preparation Workers 1,407 141 687 828
Meeting Planners 1,076 108 38 146
Tour Guides 179 18 35 53
Travel Agents 349 35 39 65
Flight Attendants 28 3 36 39
Hotel and Lodging
Managers 28 3 26 29
25 TABLE 17
MASSACHUSETTS EMPLOYMENT PROJECTIONS 2010-2020
LIFE SCIENCES AND SERVICES OCCUPATIONS
Description Employment Change 2010-2020 Annual New Openings Annual Replacement Annual Total Openings COSMETOLOGY/BARBERING
Manicurists & Pedicurists 602 60 47 107
Hairdressers & Cosmetologists 4,374 437 361 798
Skin Care Specialists 572 57 38 95
TABLE 18
MASSACHUSETTS EMPLOYMENT PROJECTIONS 2010-2020
LIFE SCIENCES AND SERVICES OCCUPATIONS
Description Employment Change
2010-2020 Annual New Openings Annual Replacement Annual Total Openings EARLY CHILDHOOD EDUCATION
Pre-School Teachers 2,394 239 356 595
Kindergarten Teachers 695 70 97 167
Child Care Workers 5,037 504 985 1,489
Teacher Aide 4,599 460 768 1,128
2. Employment and Wage Summary May 2012
Tables 18-20 provide employment and wage information for the occupations related to the Bio Technology, Horticulture and Landscaping and Environmental Science programs.
All of the occupations within Bio Technology are well paying. As would be expected because of the educational requirements, Biological Scientists has both the highest entry lever ($61,640) and median wage ($96,090). The largest occupation among the group, Biological Technicians, has an entry level wage of $30,980 as compared to $35,460 for Chemical Technicians. Their respective median wages are $43,260 and $48,080.
Within Bio Manufacturing, wages for these occupations fall in a narrow range of between $29,690 and $32,200 for entry level positions. The gap does widen for median wages with Medical Equipment Repairers leading the way ($44,300), followed by Medical Appliance Technicians ($40,640) and Medical Equipment Preparers ($37,900).
26
As noted earlier, Landscapers and Groundskeepers is one of the largest occupations related to any of the program academys with an estimated employment level of 31,127 in 2020. The wages are modest, with an entry level wage of $23,520 as compared to a median wage of $31,440. Pest Control Workers are the highest paying of this group with an entry level wage of $31,830 and a median wage of nearly $39,790. On the lower end of the scale are Nursery and Greenhouse Workers and Florists, with entry level wages of $17,910 and $20,200 respectively. These wages reflect in part the seasonal nature of work, especially for Landscapers and Nursery Workers. Landscapers often find winter work removing snow from both residential and commercial properties.
Among the Environmental Technology occupations, despite its employment outlook, Water and Waste Treatment operators have both the highest entry level ($38,570) and median ($50,410) wage. Environmental Engineering Technicians were the second highest, with an entry level wage of $35,100, followed by Hazardous Waste Removal workers ($29,190) and Environmental Science and Protection Technicians ($28,080).
TABLE 18
MASSACHUSETTS EMPLOYMENT PROJECTIONS 2010-2020
LIFE SCIENCES AND SERVICES OCCUPATIONS
Description Employment Projected
Level Entry Annual Hourly Wage May2012 Median Annual Wage May 2012 BIO-TECHNOLOGY Biological Scientists 1,389 $61,640 $96,090 Biological Technicians 6,165 $30,980 $43,260 Chemical Technicians 2,063 $35,460 $48,080 BIO-MANUFACTURING
Medical Appliance Technicians 1,077 $29,690 $40,640
Medical Equipment Preparers 1,315 $30,970 $37,900
Medical Equipment Repairers 1,121 $32,200 $44,300
TABLE 19
MASSACHUSETTS EMPLOYMENT PROJECTIONS 2010-2020
LIFE SCIENCES AND SERVICES OCCUPATIONS
Description Employment Projected
Level Entry Annual Hourly Wage May2012 Median Annual Wage May 2012 HORTICULTURE AND LANDSCAPING
Landscapers and Groundskeepers 31,127 $23,520 $31,440
Pest Control Workers 1,159 $31,830 $39,790
Nursery/Greenhouse Workers 2,427 $17,910 $25,010
27 TABLE 20
MASSACHUSETTS EMPLOYMENT PROJECTIONS 2010-2020
LIFE SCIENCES AND SERVICES OCCUPATIONS
Description Projected Employment Level Entry Annual Hourly Wage May2012 Median Annual Wage May 2012 ENVIRONMENTAL TECHNOLOGY Environmental Engineering Technicians 826 $35,100 $45,670
Environmental Science & Protection
Techs 1,153 $28,080 $35,970
Hazardous Waste Removal Workers 1,811 $29,190 $37,920
Water & Waste Treatment Plant
Operators 2,440 $38,570 $50,410
TABLE 21
MASSACHUSETTS EMPLOYMENT PROJECTIONS 2010 -2020
LIFE SCIENCES AND SERVICES OCCUPATIONS
Description Percent Employment Change 2010-2020 Percent Openings Due To Growth Percent Openings Due Replacement HEALTH AND DENTAL ASSISTING
Medical Assisting 18.3 54.4 45.6
Home Health Aides 53.7 80.6 19.4
Nurse’s Aide 19.4 60.0 40.0
Personal and Home Care Aide 45.4 85.2 14.8
Dental Assistant 13.4 35.0 65.0
Dental Hygienist 18.7 48.2 51.8
CULINARY
Chefs and head Cooks -4.0 0 100.0
Cooks, Fast Food -6.5 0 100.0
Cooks, Institutions and Cafeterias 17.8 45.5 54.5
Cooks Restaurants 8.8 29.2 70.8
Cooks, Short Order 2.6 11.2 88.8
Bakers 7.5 20.6 79.4
Food Preparation Workers 7.4 17.0 83.0
HOSPITALITY and TOURISM
Meeting Planners 53.5 74.0 26.0
Tour Guides 19.5 34.0 66.0
Travel Agents 12.6 53.8 46.2
Flight Attendants 1.5 7.7 92.3
28 TABLE 21
MASSACHUSETTS EMPLOYMENT PROJECTIONS 2010 -2020
LIFE SCIENCES AND SERVICES OCCUPATIONS
Description Percent Employment Change 2010-2020 Percent Openings Due To Growth Percent Openings Due Replacement
Hotel and Resort Clerks 6.2 7.6 92.4
COSMETOLOGY
Manicurists and Pedicurists 23.3 56.0 44.0
Hairdressers and Cosmetologists 23.1 54.8 45.2
Skin Care Specialist 27.2 60.0 40.0
EARLY CHILDHOOD EDUCATION
Pre School Teachers 17.5 40.2 59.8
Kindergarten Teachers 18,6 41.9 58.1
Child Care Workers 16.1 33.8 66.2
Teacher Aide 13.5 40.8 59.2
Although the employment outlook for many occupations in this academy is positive, the wages are often modest at best. This is especially true among the Culinary and Cosmetology occupations with one notable exception. The range of entry level wages for Cooks (except Chefs and Head Cooks) is quite narrow ($17,730-$22,650) as is the case for median wages ($19,350-$30,500). As noted above, Chefs and Head Cooks are the exception with an entry level wage of $37,820 and a median wage of $52,010. In most instances, however, Chefs and Head Cooks typically have some post-secondary education.
Modest wages are also paid to Cosmetology workers. The very large Hairdresser and
Cosmetology occupation reported an entry annual salary of $18,940 and a median wage of $27,690. Skin Care Specialists fared slightly better with an entry level wage of $25,020 while Manicurists and Pedicurists did not do as well ($17,780).
A factor contributing to the lower wages among Culinary and Cosmetology occupations is that positions are sometimes part-time, turnover can be high, and self-employment is pervasive in the latter category. This is especially true for Short Order and Fast Food Cooks and Cosmetology workers. For the very large Cosmetology occupation, more than 40% are self-employed which means being responsible for one’s own benefits. As tips are an integral part of compensation for Cosmetology workers, the type of shop they work in also is critical.
One prominent aspect for the Early Childhood occupations is the wage disparity. Kindergarten teachers reported a median annual wage of $60,770, as compared to $31,190 for Pre-School Teachers, $24,600 for Child Care Workers, and $25,830 for Teacher Aides. Educational attainment is a major contributor to the disparity, as almost all Kindergarten Teachers have at least a Bachelor’s Degree, compared to just under half for Pre-School Teachers. In addition, Kindergarten Teachers are primarily
29
employed in public school systems, which typically pay better than the private child day care service providers, the more typical employer of Pre-School Teachers.
As noted above, Child Care Workers are at the bottom of the labor market queue, with regard to wages. Private Day Care providers are in a constant struggle to balance affordable day care costs with wages that are sufficient to attract and retain workers. Furthermore, the fact that one third of Child Care Workers are self-employed and responsible for their own benefits contributes to the high turnover associated with this occupation. Certainly lower educational attainment is a contributing factor to lower wages; just 14% have at least a Bachelor’s Degree, while half have a high school diploma. At the same time, a number of different job titles, including Day Care Teacher, Family Child Care Assistant, Day Care Provider, Child Care Group Leader and Child Care Kindergarten Coordinator, all require licenses in Massachusetts.
Within the Health Assisting occupations, distinct groups exist with regard to wages. The three aide occupations (Nurse Aide, Home Health Aide and Personal Home Care Aide) have relatively low entry level wages ($20,860-$24,060) and do not register marked increases over time as reflected in their median wage range ($25,780-$28,760). The wages tend to be suppressed due to high turnover associated with the wages and often difficult working conditions.
The second group includes Medical Assistants. The entry level wages are higher ($29,000 and $31,020) as are the median wages of $35,600 and $40,950. A wide range of wages exist among the six occupations related to Hospitality and Tourism. At the top of the pyramid is Meeting and Convention Planners and Hotel and Lodging Managers. Their respective entry level wages were $37,680 and
$35,850 while the median wages for these two occupations were $55,540 and $61,090, respectively. In the middle were Flight Attendants (entry level wage $25,420) and Travel Agents ($28,670). The median wages were $33,150 for Flight Attendants and $41,270 for Travel Agents. At the low end of this group are Hotel and Resort Clerks and Tour guides with entry level wages just under $20,000.
TABLE 22
MASSACHUSETTS EMPLOYMENT LEVELS AND WAGES LIFE SCIENCES AND SERVICES OCCUPATIONS
Occupation Employment Projected
Level--2020 Entry Level Annual Wage May 2012 Median Annual Wage May 2012 HEALTH ASSISTING OCCUPATIONS
Medical Assisting 15,664 $29,000 $35,600
Nurse’s Aide 49,883 $24,060 $28,760
Home Health Aide 26,800 $21,680 $26,480
30 TABLE 23
MASSACHUSETTS EMPLOYMENT LEVELS AND WAGES LIFE SCIENCES AND SERVICES OCCUPATIONS
Occupation Employment Projected
Level--2020 Entry Level Annual Wage May2012 Median Annual Wage May 2012 CULINARY / HOSPITALITY
Chefs and Head Cooks 3,396 $37,820 $52,010
Cooks, Fast Food 6,062 $17,730 $19,350
Cooks, Institutions & Cafeterias 10,134 $22,650 $30,500
Cooks, Restaurants 26,254 $21,660 $27,430
Cooks, Short Order 3,787 $19,120 $25,830
Bakers 4,862 $19,890 $27,370
Food Preparation Workers 20,489 $17,920 $22,200
Meeting Planners 3,086 $37,680 $55,540
Tour Guides 1,095 $19,700 $29,650
Travel Agents 3,115 $28,670 $41,270
Flight Attendants 1,928 $25,420 $33,150
Hotel and Lodging Managers 974 $35,850 $61,090
Hotel & Resort Clerks 3,137 $19,430 $25,290
TABLE 24
MASSACHUSETTS EMPLOYMENT LEVELS AND WAGES LIFE SCIENCES AND SERVICES OCCUPATIONS
Occupation Employment Projected
Level--2020 Entry Level Annual Wage May 2012 Median Annual Wage May 2012 COSMETOLOGY/BARBERING
Manicurists & Pedicurists 3,185 $17,780 $19,560
Hairdressers &
Cosmetologists 23,315 $18,940 $27,690
31 TABLE 25
MASSACHUSETTS EMPLOYMENT LEVELS AND WAGES LIFE SCIENCES AND SERVICES OCCUPATIONS
Occupation Employment Projected
Level--2020 Entry level Annual Wage May 2012 Median Annual Wage May 2012 EARLY CHILDHOOD EDUCATION
Pre-School Teachers 16,073 $23,640 $31,190
Kindergarten Teachers 4,459 $33,480 $60,770
Child Care Worker 36,322 $19,280 $24,600