Stem Cell Reports
Article
Default Patterning Produces Pan-cor tical Glutamatergic and CGE/LGE-like
GABAergic Neurons from Human Pluripotent Stem Cells
Crina M. Floruta,1Ruofei Du,2Huining Kang,2,3Jason L. Stein,4,5and Jason P. Weick1,* 1Department of Neurosciences
2UNM Comprehensive Cancer Center 3Department of Internal Medicine
University of New Mexico-Health Science Center, Albuquerque, NM 87131, USA
4Department of Genetics, University of North Carolina School of Medicine, Chapel Hill, NC 27599, USA 5UNC Neuroscience Center, University of North Carolina School of Medicine, Chapel Hill, NC 27599, USA *Correspondence:[email protected]
https://doi.org/10.1016/j.stemcr.2017.09.023
SUMMARY
Default differentiation of human pluripotent stem cells has been promoted as a model of cortical development. In this study, a develop-mental transcriptome analysis of default-differentiated hPSNs revealed a gene expression program resemblingin vivoCGE/LGE subpallial domains and GABAergic signaling. A combination of bioinformatic, functional, and immunocytochemical analysis further revealed that hPSNs consist of both cortical glutamatergic and CGE-like GABAergic neurons. This study provides a comprehensive characterization of the heterogeneous group of neurons produced by default differentiation and insight into future directed differentiation strategies.
INTRODUCTION
Human pluripotent stem cells (hPSCs) and their CNS derivatives present a model system for the study of brain development (Shi et al., 2012) and the generation of cell populations to understand and treat disease (Takahashi et al., 2007). As the neocortex has undergone significant evolutionary expansion in primates (Hofman, 2014), much effort has focused on directing differentiation of cortical cell types to potentially uncover primate- or even human-specific mechanisms of development (Hill and Walsh, 2005; Rakic, 2009). In vivo, cortical specification involves the coordinated activation or repression of multi-ple morphogen pathways (He´bert and Fishell, 2008). Thus, various hPSC differentiation strategies have been used to target morphogens such as fibroblast growth factor (FGF) (Pasca et al., 2015), sonic hedgehog (SHH) (van de Leemput et al., 2014), and wingless (WNT) (Mariani et al., 2012), with all reporting similar cortical phenotypes being generated.
Despite the complexity of in vivo morphogen integra-tion, multiple studies have reported the generation of cortical-like neurons from hPSCs without additional fac-tors, using so-called ‘‘default’’ differentiation ( Espuny-Ca-macho et al., 2013). Default differentiated hPSC-derived neurons (hPSNs) stain positive for both deep (CTIP2, TBR1) and superficial layer markers (BRN2, SATB2; Es-puny-Camacho et al., 2013). However, hPSNs differenti-ated by default methods have been shown to produce a significant proportion of GABAergic neurons. Up to 50% of spontaneous post-synaptic currents are inhibitory (Larsen et al., 2016; Weick et al., 2013), consistent with their relatively early generation during development in
both rodent (Ben-Ari et al., 1989) and human cortex ( Ze-cevic et al., 2011). As GABAergic neurons are thought to be generated in subpallial domains (Wonders and Ander-son, 2006), their presence in default patterned hPSNs suggests that a thorough characterization of this popula-tion is critically important to determine to what extent they recapitulatein vivohuman cortical development. In addition, this knowledge will help inform future methods for directing particular subpopulations of neurons to more accurately model corticogenesis.
Here, we present a developmental transcriptome analysis during default differentiation to determine both the temporal maturation and regional specification profile of hPSNs. We used sophisticated bioinformatic tools to deter-mine the regional and temporal patterning of hPSNs in relation to in vivo human samples across developmental time and brain region (Stein et al., 2014). This analysis confirmed previous findings showing default hPSNs resemble human early to mid gestational stages and express forebrain-derived neuronal markers. However, in addition to the robust expression of cortical glutamatergic markers, SFEB-derived hPSNs also show upregulation of multiple subpallial GABAergic neuron markers, including ASCL1, DLX1/2/5/6, andISL1. In addition, we found robust expres-sion of a set of genes that overlap with those of caudal and lateral ganglionic eminence (CGE/LGE) populations (e.g., COUPTFII,MEIS1/2,PBX1) but not medial (MGE)-derived neurons (GBX1/2, LHX6/8, NKX2-1). Immunocytochem-ical analyses revealed robust labeling of the DLX family members, COUPTFII, and CALB2. Together with functional analyses, our findings suggest that a large pro-portion of default-patterned hPSNs resemble CGE/LGE-like GABAergic neurons to the exclusion of MGE-like cells.
RESULTS
Developmental Transcriptome Analysis of SFEB-Derived hPSNs
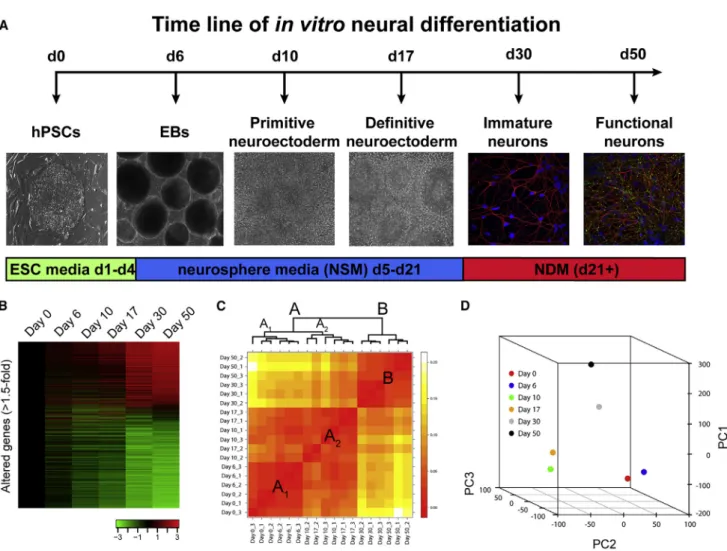
Figure 1A illustrates the experimental paradigm for tran-script analysis during default patterning and neuronal maturation. The six time points were chosen based on previously defined morphological, biochemical, and physiological changes that indicate significant transitions from pluripotency to functional post-mitotic neurons (Johnson et al., 2007; LaVaute et al., 2009). For instance, cells at day 6 contain a heterogeneous population
express-ing both pluripotent genes as well as neural markers (Huang et al., 2016), while day 10 represents a population of neural progenitor cells that are >95% PAX6+ (LaVaute et al., 2009). Day 17 corresponds to a period when the majority of cells are still neural progenitors, but an initial, small proportion of bIII-Tubulin+ post-mitotic neurons
(PMNs) can be observed (Weick et al., 2009). Day 30 corre-sponds to a time point when a significant proportion of cells are immature PMNs that lack functional properties and SYN1 staining appears diffuse, while day 50 represents a period when robust spiking and synaptic activity are observed along with punctate SYN1 staining (Johnson
Figure 1. Summary of Experimental Design and Unbiased Cluster Analysis of Microarray Data
(A) Timeline illustrating the default differentiation (serum-free embryoid body) method for human pluripotent stem cells (left; hPSCs) to human pluripotent stem cell-derived neurons (right). Day 0–17 illustrations are bright-field images; day 30–50 images illustrate neurons labeled withbIII-Tubulin (red) and DAPI (blue); day 50 image also shows staining for SYN1 (green). EBs, embryoid bodies.
(B) Heatmap illustrating 11,006 transcripts with at least 1.5-fold alteration following one-way ANOVA with Benjamini and Hochberg correction of microarray data (see alsoTable S1, tab 2). Color bar represents the degree of upregulation (red) or downregulation (green). (C) Heatmap illustrating unbiased clusters. Large red boxes represent primary clusters (A-B); subscripts identify secondary clusters (A1-A2).
et al., 2007). Following quality control assessments, we per-formed a one-way ANOVA with Benjamini and Hochberg correction and used a false discovery rate of 0.05 on the entire dataset (21,735 gene-level transcripts; Table S1, tab 1). This analysis revealed 11,006 transcripts whose abundance was significantly altered at least 1.5-fold ( Fig-ure 1B; Table S1, tab 2). Unbiased hierarchical clustering analysis revealed that biological replicates from the same time point, as well as samples from similar time points, clustered together. The samples from days 0–17 and days 30–50 initially segregated into two major clusters ( Fig-ure 1C, clusters A and B) likely due to the highly significant differences between PMNs (days 30–50) and progenitor cells (days 0–17). However, the samples from days 0–6 and days 10–17 were further separated into clusters A1
and A2, which was confirmed by principal component
analysis (Figure 1D). The plot inFigure 1D highlights the three independent clusters (days 0–6, days 10–17, and days 30–50), indicating that samples related in time were also more similar in gene expression.
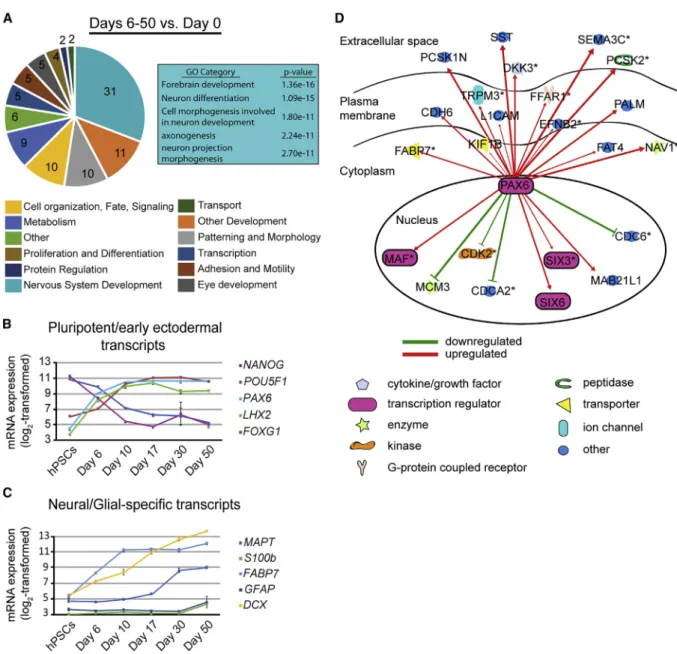
SFEB Induces Robust Forebrain Marker Expression We used the NIH database tool DAVID (v6.7) to identify enriched Gene Ontology (GO) categories for the 500 most significantly upregulated transcripts at various stages. When comparing all time points during differentiation (e.g., days 6–50) with hPSCs (day 0), the top GO categories were related to neuronal differentiation, including ‘‘fore-brain development’’ and ‘‘axonogenesis’’ (Figure 2A). Inter-estingly, by comparing early neuroepithelial populations (days 10–17;LaVaute et al., 2009; Meyer et al., 2011) with hPSCs (day 0), we found similar results, with enrichment for categories including ‘‘forebrain development’’ and ‘‘telencephalon development’’ (Table S2, tab 2). Transcrip-tion factors involved with forebrain development (e.g., FOXG1,LHX2), along with transcripts important for neuro-genesis (e.g.,DCX) were similarly upregulated by day 17 (Figures 2B and 2C). Consistent with the later onset of glio-genesis, two genes related to astrocyte development (S100b
andGFAP) were only significantly upregulated at day 50 (Figure 2C). Ingenuity pathway analysis (IPA) was used to confirm that predicted gene interactions were maintained in developing hPSNs. Figure 2D displays IPA results for the HUB genePAX6, which identified many upregulated factors (red arrows), while others such asCDK2, CDC6, andMCM3were downregulated (green lines).
Importantly, pluripotent markers POU5F1 (OCT4) and NANOG were significantly downregulated by day 6 ( Fig-ure 2B) and markers for endodermal and mesodermal lineages were not expressed (Figures S1A and S1B). Together, these data support previous findings that hPSCs differentiated via default SFEB methods strongly represent forebrain neuroectoderm at the transcriptome level.
hPSNs Display Functional Markers and Developmental TransitionsIn Vitro
Consistent with the functional maturation of hPSNs after day 30, GO results for comparisons between late time points (days 30–50) and earlier time points (days 6–17) identified categories such as ‘‘synaptic transmission,’’ ‘‘transmission of nerve impulse,’’ and ‘‘neuron projection development’’ (Figure 3A). Individual upregulated genes associated with the GO category ‘‘synaptic transmission’’ (Figure 3A) encode both pre- and post-synaptic proteins (Figures 3B and 3C). Although many individual genes involved with glutamatergic neurotransmission were upregulated during differentiation (Figures 3B and 3C), GO analysis identified the ‘‘gamma-aminobutyric acid signaling’’ but not the ‘‘glu-tamic acid signaling’’ pathway as significantly enriched (Figure 3A; Table S2, tab 3). Lastly, two genes involved with cell proliferation (Gunsalus et al., 2012), the micro-RNA LIN28 and neuron-restrictive silencing factor/RE1-silencing transcription factor (NRSF/REST), were signifi-cantly downregulated after day 17 (Figure 3D).
To better identify the temporal and regional patterning of SFEB-derived hPSNs, we compared our data with that of in vivodeveloping human brain samples (Allen Brain Atlas) using bioinformatic tools (Stein et al., 2014). We used tran-sition mapping (TMAP) to compare genes that were differ-entially expressed between day 0 and day 50 samples with those of human cortical samples from time points spanning 4–8 post-conception weeks (pcw) to >20 years of age ( Fig-ure 3E). This analysis identified a strong degree of overlap between highly expressed genes at day 0 with early embry-onic periods, while day 50 hPSNs showed strong overlap with mid-gestational time points (box ‘‘1 versus 6’’; max –log10(p value) > 460;Figure 3E). To validate these data, we performed the same analysis on a wild-type iPSC line (DS2U) (Weick et al., 2013) and found similar results ( Fig-ure S2A). As many of the genes that are upregulated during early neuronal development are maintained into adult-hood, some overlap of upregulated genes was also observed for genes differentially expressed between adult and embry-onic stages (box ‘‘1 versus 13’’). However, comparisons be-tween period ‘‘2’’ and later time points produced little corre-lation, likely due to the presence of a significant number of PMNs during period 2 (9–10 pcw), which reduces the num-ber of changed genes at later time points.
strategies (Stein et al., 2014). Of note, while hPSNs at day 50 do not mimic postnatal or adult time points, their correla-tion with 112–133 day-old embryos (16–19 pcw) does repre-sent a significantly advanced temporal progression. Howev-er, it should be noted that removal of neuroepithelia from
samples at days 30 and 50 likely enhanced this correlation due to the relative enrichment of PMNs. The individual variability was minimal as indicated by low color variation (correlation values) between samples, suggesting the SFEB differentiation paradigm is highly repeatable.
Figure 2. Default Differentiation Results in Highly Enriched Neuroectodermal Patterning
(A) Pie chart illustrating the most enriched Gene Ontology (GO) categories identified by NIH DAVID (v6.7) for the top 500 upregulated genes at days 6–50 compared with day 0 (seeTable S2for details). Numbers in pie slices indicate the percentage of top 500 genes grouped within that category. Box illustrates top 5 GO sub-categories within the ‘‘Nervous System Development’’ category.
(B and C) Plots illustrating expression of neuroectodermal and pluripotent transcripts altered at early time points (days 6–10; B) and neural-specific and glial-specific transcripts altered at later time points (days 10–50; C; see alsoFigure S1). The y axis is log2scaled; values
represent mean expression, error bars represent SEM.
Figure 3. Temporal Maturation of hPSNs
(A) Pie chart illustrating the most enriched Gene Ontology (GO) categories identified by NIH DAVID (v6.7) for the top 500 upregulated genes at days 30–50 compared with days 6–17 (seeTable S2for details). Box illustrates top 5 GO sub-categories within the ‘‘Nervous System Development’’ category.
(B–D) Plots illustrating differentiation stage-dependent expression of selected pre-synaptic (B), post-synaptic (C), and neural repressive transcripts (D). Error bars represent SEM.
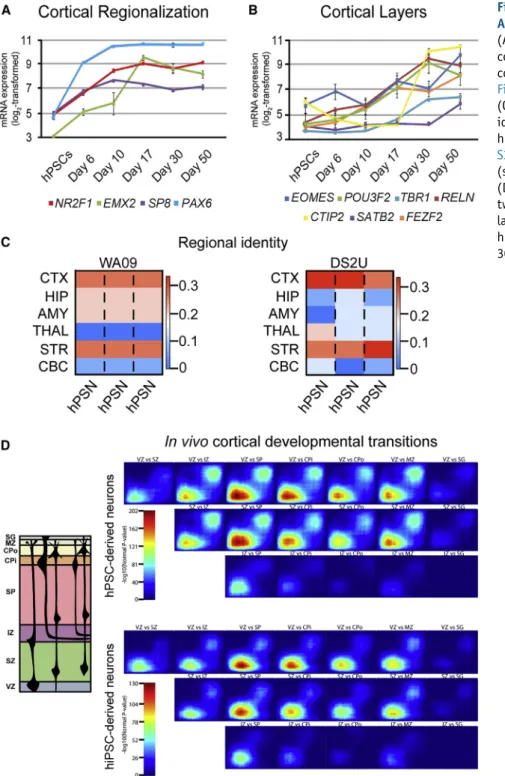
SFEB-Derived hPSNs Demonstrate Pallial and Subpallial Gene Expression Patterns
While default patterning of hPSCs is thought to drive dorsal forebrain phenotypes, arealization of SFEB-derived neurons remains relatively unknown.Figure 4A illustrates the expres-sion profile of multiple regional markers identified in rodents that correspond to medial (SP8), anterior-lateral (PAX6), posterior-medial (EMX2), and posterior-lateral (COUP-TF1/NR2F1) regions (Hansen et al., 2011). All four of these factors were significantly upregulated by day 6 in default-differentiated hPSNs and remained high for the duration of the culture period. Although the pattern of expression ofSP8, EMX2, andNR2F1in human brain remains unknown, the universal expression of PAX6 in hPSC-derived neural progenitors (Zhang et al., 2010) sug-gests that these markers do not show the same regional dif-ferences as rodent brain (seeDiscussion). Additional upregu-lated factors reupregu-lated to cortical development includedLIX1, SIX3,DACH1, andMEIS1(Figure S2B). TMAP comparisons between relatively late time point hPSNs (day 50 for WA09 and day 30 for DS2U) and variousin vivocortical layers re-vealed strong overlap of both upregulated and downregu-lated genes when comparing progenitor domains (ventricu-lar and subventricu(ventricu-lar zones) with early cortical domains containing PMNs (IZ, SP, CP, MZ;Figure 4D). These data sug-gest the presence of a mixed population of progenitors and PMNs, despite enrichment for PMNs. Several recent studies have focused on establishing anin vitromodel of cortical development using hPSNs, which demonstrates appropriate temporal profiles for the appearance of individual layer-specific gene products (Espuny-Camacho et al., 2013). We also observed significant upregulation of layer-specific markers including layer 1 (reelin, RLN), subplate (CNTN2, TBR1), superficial layers (BRN2, SATB2), and deep layers (CTIP2,TBR1), but most showed similar temporal profiles (Figure 4B). The one exception was the superficial layer markerSATB2, which was only upregulated at day 50.
In addition to temporal analysis, CoNTExT also incorpo-rates regional patterning data from hundreds of different brain regions over multiple developmental time points. Of significance, SFEB-derived hPSNs from the WA09 line showed equivalent overlap in gene expression patterns within vivo samples from both ‘‘Cortex’’ and ‘‘Striatum’’ (Figure 4C, left). Again we repeated analyses in the DS2U line, which also showed strong overlap with both ‘‘Cortex’’ andin vivo human ‘‘Striatum’’ (Figure 4C, right). Lower degrees of overlap were seen for ‘‘Hippocampus,’’ ‘‘Amyg-dala,’’ ‘‘Thalamus,’’ and ‘‘Cerebellum’’ for both cell lines
(Figure 4B). To test the utility of this dataset to potentially inform chemically mediated differentiation strategies, we compared it with two previously published datasets from hPSC-derived neurons. First, we compared SFEB-derived neurons with those differentiated in the presence of DKK1 (lines PGP-1 and i03-01), a WNT antagonist commonly used to drive cortical differentiation (Mariani et al., 2012; Watanabe et al., 2005). When predicting regional identity of day 50 hPSNs, samples strongly correlated with Cortex and Hippocampus, with little or no overlap with other re-gions, including Striatum (Figure S3A). In addition, Pasca et al. used EGF/FGF2 to expand cortical spheroids that show nearly identical temporal maturation at day 50 compared with day 50 default-differentiated hPSNs (Pasca et al., 2015). However, while these cells resemble cortex to a greater degree than SFEB-derived hPSNs (Figure S3B), they also show a significant overlap with Cerebellar gene expression patterns, similar to previously published results of monolayer differentiated cells (Stein et al., 2014). Thus, the dataset from default-patterned neurons represents a foundation upon which to compare the effects of small-molecule-based differentiation strategies on regional patterning and suggests previously unappreciated diversity in hPSNs generated by various treatments.
Lastly, we used weighted gene co-expression network analysis (WGCNA) of cortical samples to understand the preservation of neurodevelopmental biological processes in addition to temporal and regional predictions. This network was constructed based on co-expression of genes in developing human cortex (Kang et al., 2011) and validated in anotherin vivodataset of developing cortex, allowing for the identification of the most robust modules (Table S3;Stein et al., 2014). Both WA09- and DS2U-derived hPSNs showed robust preservation of cortical pathways, with 18/28 and 17/28 modules showing significantly preserved Z scores, respectively (Figure S4A,Table S3, see Experimental Procedures). Conserved modules included those related to ion transport (red), synapse assembly and vesicle transport (cyan), and glutamatergic synaptic transmission (green), but not gliogenesis (yellow) or blood vessel development (light cyan).
Subpallial Gene Expression Patterns ResembleIn Vivo CGE/LGE
The CoNTExT analysis, which revealed a correlation be-tween default-derived neurons within vivostriatal samples, is intriguing given previous reports of GABAergic neurons in these cultures (Mariani et al., 2012; Weick et al., 2013).
(E) TMAP analysis illustrates overlap between gene expression duringin vivodevelopmental period transitions for human cortex and hPSNs at day 50 (see alsoFigure S2A).
(F) CoNTExT algorithm trained on spatiotemporal human brain gene expression prediction for the developmental period of individual
Of note, the label of ‘‘Striatum’’ is somewhat misleading due to the fact that the datasets used to create CoNTExT also include multiple subpallial domains during early forebrain development, including the MGE, LGE, and CGE from 8 to 9 pcw (Stein et al., 2014). To investigate the conserved gene regulatory networks involved with subpallial differen-tiation, we constructed a WGCNA network for ‘‘subpallial developmental processes’’ (modules listed in Table S4).
WGCNA for default-differentiated hPSNs from both WA09 (Figure S4B, upper panel) and DS2U (Figure S4B, lower panel) revealed significant preservation in 9/14 modules for both cell lines. Significantly, preserved processes include cell cycle and interneuron development (blue) as well as ion transport (red). WGCNA-identified hub genes for these specific mod-ules include DLX1/2, ARX, SP8, andASCL1, all of which are markers for subpallial domains (Long et al., 2009).
Figure 4. Default Differentiated hPSNs Adopt Pallial and Subpallial Identities (A and B) Plots illustrating expression of cortical regionalization (A) and mature cortical layer-specific transcripts (B; see
Figure S2B). Error bars represent SEM. (C) CoNTExT algorithm predicted regional identity of WA09 (left panel) and DS2U hPSNs (right panel; also seeFigures S2B and
S3). WGCNA analyses support these findings (seeFigure S4).
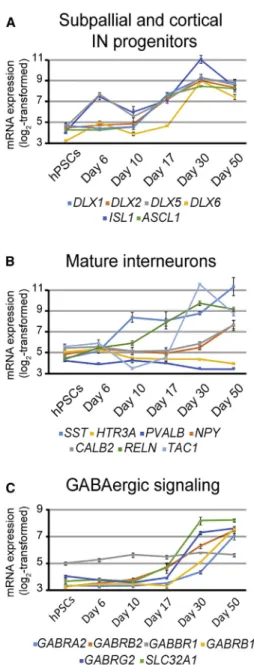
To better determine the regional identity of the GABAergic population, we analyzed the expression profiles of genes determined from in vivostudies to be involved in GABAergic neuron specification. SFEB-derived hPSNs showed robust expression of many GABAergic progenitor markers, including members of the Distal-less family, all of which begin to be upregulated as early as day 17 (DLX1/2/5/6;Figure 5A). DLX family members expressed in the nervous system appear in subcortical telencephalic tissue starting around embryonic day 9.5 in mouse, which
correlates to human embryonic day 22 (Ghanem et al., 2007; Theiler, 2013). Importantly, day 17 of hPSC differen-tiation in vitro corresponds to neural tube formation at around day 21 in vivo. In addition, hPSNs expressed the mature IN markers Calretinin (CALB2), Neuropeptide Y (NPY), Somatostatin (SST), and the substance P precursor Tachykinin 1 (TAC1;Figure 5B). In contrast, at the latest time point we analyzed (day 50), we found no expression of Calbindin (CALB1), Cholecystokinin (CCK), Parvalbu-min (PVALB), and the serotonin receptor 3A (HTR3A; Fig-ure 5C). Many genes involved with GABAergic neurotrans-mission were also highly upregulated at later time points (Figure 5C).
To further elucidate whether hPSNs identify more closely with a specific subpallial domain, we examined selected CGE/LGE-, and MGE-specific markers (Long et al., 2009; Nord et al., 2015) from array and qPCR assays. Figure 6A shows expression of individual CGE/LGE-specific markers (left panel) and MGE markers (middle panel). The right panel reveals that SFEB-derived hPSNs display significantly greater mean expression of CGE/ LGE markers compared with MGE markers at all time points based on array data (Figure 6A, right panel, p < 0.05). qPCR analysis of day 50 samples confirmed these array findings, illustrating a significant upregulation in 8 out of 9 CGE/LGE-specific markers compared with 1 out of 7 MGE-specific markers for all three cell lines tested (Figure 6B;c2= 8.905, p < 0.01).
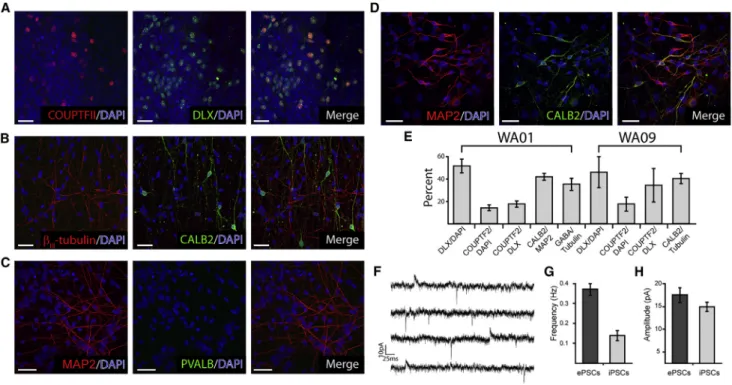
We further probed the identity of the GABAergic popula-tion produced via immunocytochemical labeling of progen-itors and PMNs. We found that a significant proportion of neuroepithelia stained positive for a pan-DLX antibody ( Fig-ure 7A, middle, merge) that recognizes all members of the DLX family expressed in the nervous system (Liu et al., 1997). In addition, many DLX+ progenitors from both WA01 and WA09 also stained for COUPTFII, indicative of a CGE/LGE-like phenotype (Figures 7A and 7E; Kanatani et al., 2008). Furthermore, we found that approximately 40% of neurons that had migrated away from neurospheres stained positive for CALB2 (Figures 7B–7E), a marker of GABAergic interneurons derived from the CGE in vivo (Miyoshi et al., 2010). This is the same proportion of WA01 neurons that were found positive for both CALB2 (Figures 7D and 7E) and GABA (Figure 7E), and very similar to the overall proportion of neurons derived from WA09 and DS2U that stain positive for GABA (Larsen et al., 2016; Weick et al., 2013). The presence of functional GABAergic neurons derived from WA01 was demonstrated via physiological re-cordings of excitatory and inhibitory post-synaptic currents (EPSCs and IPSCs;Figures 7F–7H). The overall proportion and mean amplitude of EPSCs and IPSCs was nearly identical to previously published reports from other cell lines (Figures 7F–7H;Larsen et al., 2016; Pre et al., 2014; Weick et al., 2013).
Figure 5. Default Patterned hPSNs Express Common Subpallial and Interneuron Transcripts
DISCUSSION
We used bioinformatic analysis of developmental transcrip-tome array data to compare default-patterned hPSNs with in vivohuman brain samples. These data present a unique picture of the temporal and spatial identity of a heteroge-neous but forebrain-specific population of hPSNs. Tempo-rally, day 50 hPSNs correspond to early to mid stages of fetal development, likely due to the preponderance of neurons relative to other CNS cell types such as astrocytes and oligo-dendrocytes, which develop at later stages (Qian et al., 2000). Spatially, default-patterned hPSNs express dorsal cortical markers that span cortical layers as well as A-P patterning. Lastly, we identified a significant population of neurons with a unique CGE/LGE-like phenotype at the RNA and pro-tein level and a lack of MGE-specific marker expression.
In vivo, MGE-derived INs are thought to comprise approximately 60% of cortical interneurons with
CGE-derived interneurons supplying an additional 30% ( Won-ders and AnWon-derson, 2006). While the MGE is thought to produce the majority of PVALB and SST INs that reside in mature cortex, CGE-derived INs comprise a unique popula-tion that include the Calretinin (CALB2) and Reelin-expressing subtypes (Miyoshi et al., 2010). Interestingly, with the notable exception of SST in our dataset, transcript expression for both Calretinin and Reelin far exceed those for other IN subtypes. However, despite initial attempts, we were unable to conclusively demonstrate SST or Reelin via immunocytochemical labeling. This may be due to the fact that extended time courses (up to 30 weeks) are needed to identify fully mature IN phenotypes in hPSNs (Maroof et al., 2013; Nicholas et al., 2013) as well asin vivo(Bartolini et al., 2013; Canty et al., 2009). Interestingly, the presence of NPY and Tachykinin (precursor for substance P) mRNA was observed in array and qPCR analysis, suggesting the presence of a small population of other types of INs or the
Figure 6. SFEB-Derived hPSNs Express a Preponderance of CGE/LGE- but Not MGE-Specific Markers
(A) Plots illustrating expression of CGE/LGE-specific (left), MGE-specific (middle) markers from array data. Mean expression of CGE/LGE transcripts was significantly greater than MGE transcripts (right; two-way repeated measures ANOVA, F(1,14) = 4.66, p = 0.048). (B) Plots illustrating qPCR for markers specific for CGE/LGE transcripts (blue) and MGE transcripts (orange). Chi squared analysis revealed significantly greater CGE/LGE marker expression in WA09- (left panel), WA01- (middle), and DS2U-derived hPSNs (right panel;c2= 8.905, p < 0.005 for each group). Data are presented asDDCt relative to GAPDH, n = 3 biological replicates.
co-expression of these peptide hormones in CALB2-, SST-, and/or Reelin-expressing neurons (Cauli et al., 1997; Mark-ram et al., 2004).In vivo, NPY, SST, and substance P have been found to be expressed in interneuron progenitors as early as 13.5 weeks in rodents (Batista-Brito et al., 2008), 1 week after CGE interneurons begin to appear (Miyoshi and Fishell, 2010). CGE interneurons, especially VIP-ex-pressing subtypes, typically occupy cortical layers II/III after migration (Rudy et al., 2011). Because layers II/III develop relatively late in gestation (Fame et al., 2011), it may be that CGE-like hPSNs need longer to fully express neuropep-tides such as VIP. Future studies using extended culture durations are needed to determine the full complement of IN marker expression of CGE-derived neuronal markers.
In addition to CALB2 and Reelin, genetic fate mapping has revealed that COUPTFII can distinguish CGE-derived interneurons from LGE-derived neurons (Miyoshi et al., 2010). Kanatani et al. used microarray andin situ
hybridiza-tion to reveal that COUPTFII is predominantly expressed in the CGE and the ventral border between LGE and MGE. In addition, heterotopic transplantation of COUPTFII-overexpressing MGE cells into E13.5 CGE results in caudal migration of MGE cells, suggesting that COUP-TFII is sufficient to change the migratory direction of MGE-derived cells to caudal (Kanatani et al., 2008). Importantly, immunohistochemical analysis revealed that COUPTFII is robustly expressed in caudal cortex compared with more rostral regions in human fetal tissue at 15–22 gestational weeks, and that there may be a human-specific role of COUPTFII as its expression in human tissue occurs relatively earlier compared with later CGE-derived neurons in rodents (Miyoshi and Fish-ell, 2010). Taken together, these data suggest that default patterned hPSNs produce a CGE-like subpopulation of GABAergic neurons in addition to the remaining cortical glutamatergic phenotype.
Figure 7. Default Differentiation Produces Functional CGE-like GABAergic Neurons
(A–C) Representative confocal images illustrating the expression of progenitor markers DLX (green) and COUPTFII (A, red) as well as the mature CGE marker CALB2 (B, green) but not the MGE-derived marker PVALB (C, green) from WA09-derived cells; neurons are co-stained forbIII-Tubulin or MAP2 (B-C, red).
(D) Paired confocal images from WA01-derived neurons stained for CALB2 (green) and MAP2 (red) at day 50. Scale bars represent 30mm for (A–D).
(E) Quantification of pooled data illustrates the proportion of neurons expressing various CGE and IN markers. Bars represent mean±SEM. n = 3 biological replicates.
(F) Representative traces from whole-cell patch-clamp recordings from WA01-derived hPSNs illustrating the presence of EPSCs (downward deflections) and IPSCs (upward deflections).
One interesting finding related to the GABAergic gene expression of default-patterned neurons is that SHH appears to be dispensable. This is supported by a complete absence of NKX2-1 expression (Maroof et al., 2013; Nicholas et al., 2013), previously shown to require SHH signaling for its induction (Anderson et al., 2001; Xu et al., 2005). SHH robustly induces ventral, MGE-like phenotypes in developing hPSNs (Maroof et al., 2013; Nicholas et al., 2013). While the in vivo requirement for SHH signaling remains unclear for non-MGE-derived GABAergic neurons, multiple reports using mouse and hu-man stem cell-derived neurons used SHH to promote CGE/ LGE-like phenotypes (Danjo et al., 2011; Ma et al., 2012). In addition, others suggest that SHH antagonism is able to promote dorsalization and cortical excitatory neuron gen-eration from hPSCs (van de Leemput et al., 2014). In contrast, one study found that SHH antagonism did not alter a number of GABAergic or glutamatergic markers in hPSNs (Espuny-Camacho et al., 2013), consistent with the absence of SHH expression in untreated hPSNs ( Ma-riani et al., 2012; Maroof et al., 2013).
In addition to blocking SHH, inhibition of WNT signaling is thought to drive more dorsal cortical fates of differentiating PSCs from both mouse and human sources (Mariani et al., 2012; Sasai, 2005). Previous studies using neurons treated with DKK1 expressed little if any of the DLX family normally expressed in nervous tissue (DLX1/2/5/6;Liu et al., 1997; Saino-Saito et al., 2003), as well as the mature IN markers GAD1/2, VGAT, and several post-synaptic GABARs (Mariani et al., 2012). WNT signaling is involved in early telencephalic development, particularly during dorsal/ventral axis patterning of the forebrain (Harrison-Uy and Pleasure, 2012; Watanabe et al., 2005). Inactivation of canonical WNT signaling upregulates ventral forebrain markers such as GSX2, ASCL1, andDLX2(Chenn, 2008). However, WNT inhibi-tion was not sufficient to completely suppress GABAergic neuron generation (Mariani et al., 2012; Mertens et al., 2015), suggesting additional signals are also critical. Impor-tantly, WNT signaling has also been shown to be involved in anteroposterior patterning by promoting caudalization (Nordstro¨m et al., 2002). Therefore, it would be important to further dissect the timing of DKK1 application and its effect on dorsoventral versus anteroposterior patterning.
Lastly, the current data support the use of this model system to examine human-specific transcriptional pat-terns, as arealization of SFEB-derived neurons diverges from rodent cortex, but largely mimics in vivo human patterning. For example, a PAX6 gradient exists in devel-oping rodent brain but is lost after gestational week 8 in hu-mans (Ip et al., 2010).Zhang et al. (2010)confirmed that human stem cell-derived neuroepithelial cells express PAX6prior toSOX1, opposing findings in mouse forebrain
(Walther and Gruss, 1991) and suggesting a human-specific role for PAX6 during neural patterning. Furthermore, default-derived hPSNs show overlapping expression of ASCL1andPAX6. ASCL1 was shown to be highly expressed in the subpallial region in developing mouse brain (Finger et al., 2017; Stenman et al., 2003), whilePax6is specific to the pallium (Puelles et al., 2000). As hPSNs form appro-priate transmitter phenotypes and functional glutamater-gic and GABAerglutamater-gic synaptic connections, these two disparate populations appear to have a unique genetic signature in hPSNs, and possibly in in vivohuman brain (BrainSpan Atlas;Miller et al., 2014). Interestingly, others have suggested that, unlike rodents, primates generate a substantial proportion of GABAergic interneurons from pallial progenitors (Petanjek et al., 2009), which may explain unique marker expression patterns in hPSNs. Thus, a more complete understanding of hPSC differentia-tion may continue to reveal differences from rodent development and uncover human-specific mechanisms for directed differentiation.
EXPERIMENTAL PROCEDURES
The current study was approved by the Embryonic Stem Cell Research Oversight (ESCRO) Committee at the University of New Mexico-Health Sciences Center.
Cell Culture and Sample Preparation
hPSCs were maintained on MEF feeder layers and differentiated to neurons according to previous studies (Johnson et al., 2007). On day 20, and during collection of day 30 and 50 samples (see below), embryoid bodies that adopted a ‘‘vesicle-like’’ appearance were removed (Meyer et al., 2011); non-vesicular neurospheres were plated on day 21 and transitioned to neural differentiation medium. RNA from three independent biological replicates from each time point was harvested using Trizol according to the man-ufacturer’s protocol (Sigma, St. Louis, MO). Samples from days 0–17 represent whole RNA extraction from all cells present in the culture either in monolayer (days 0 and 17) or as floating spheres (days 6 and 10). Samples taken on days 30 and 50 represent the product of neurospheres (n = 6–10/coverslip) plated on day 21 on coverslips and allowed to differentiate until the time indicated. To enrich for PMNs at these time points, half of visible spheres that contained a mixture of progenitors and PMNs and all vesicular clusters with non-neuronal morphology were removed mechanically, and Trizol was applied to the remaining adherent cells (n = 10–12 coverslips/time point).
Microarray and Data Analysis
Experimental Procedures. A two-way repeated measure ANOVA was used to compare mean expression values between individual markers and across timepoints.
Kegg/GO Analysis
The Database for Annotation, Visualization and Integrated Discovery (DAVID; v6.7) was used for GO and KEGG pathway anal-ysis for all datasets. For GO analanal-ysis, datasets were analyzed using R Bioconductor and sorted by positive fold change and adjusted p value in Microsoft Excel; the top 500 gene IDs for the various time-point comparisons were input for analysis. IPA (QIAGEN, Venlo, Limburg, Netherlands) was performed online to confirm predicted gene interactions.
CoNTExT, TMAP, WGCNA
Transcriptome data from samples of day 0 hPSCs and day 50 hPSNs and in vivo samples from the Allen Brain Atlas were fed into the CoNTExT analysis framework (Stein et al., 2014). TMAP was done betweenin vivodevelopmental periods or laminae in the developing cortex (Stein et al., 2014) and our pooled samples. Preservation analysis was conducted using a previously established WGCNA module for cortical samples. In addition, we constructed a WGCNA network based on co-expression of genes in the developing human striatal region (periods 1–8) (Langfelder and Horvath, 2008; Zhang and Horvath, 2005) using previously pub-lished data (Kang et al., 2011).
qPCR
qPCR analysis of cDNA transcripts was performed as described pre-viously (Larsen et al., 2016). qPCR primers for all amplicons are listed inSupplemental Experimental Procedures(Schmittgen and Livak, 2008).
Immunocytochemistry
Immunocytochemistry was as described previously (Larsen et al., 2016). Primary antibodies consisted of monoclonal COUPTFII (1:500; Perseus Proteomics PP-H7147-00, Tokyo, Japan), poly-clonal panDLX (1:1000; gift from Dr. Yury Morozov, Yale Univer-sity, New Haven, CT), monoclonalbIII-Tubulin (1:5,000; Sigma T8660), polyclonal Calretinin (CALB2; 1:1000; Swant 7697, Switzerland), monoclonal Parvalbumin (1:5000; Swant PV235), and polyclonal MAP2 (1:2000; BioLegend 822501, San Diego, CA). Secondary antibodies used were: anti-mouse CF555, anti-rab-bit CF488 (both at 1:2000; Sigma SAB4600060 and SAB4600036), and anti-chicken CF647 (1:500; Sigma SAB4600179).
Electrophysiology
Whole-cell patch-clamp recordings were performed and analyzed as previously reported (Larsen et al., 2016) with minor modifica-tions. Detailed methods can be found in theSupplemental Exper-imental Procedures.
ACCESSION NUMBERS
All .cel files have been deposited at NCBI and can be accessed via accession number GEO: GSE93351 for WA09 samples and GEO: GSE48611 for DS2U samples.
SUPPLEMENTAL INFORMATION
Supplemental Information includes Supplemental Experimental Procedures, four figures, and four tables and can be found with this article online athttps://doi.org/10.1016/j.stemcr.2017.09.023.
AUTHOR CONTRIBUTIONS
C.M.F. contributed to collection and/or assembly of data, analysis and interpretation, manuscript writing, and final approval of the manuscript. R.D., H.K., and J.L.S. contributed to assembly of data, analysis and interpretation, and final approval of the manu-script. J.P.W. conceived and designed the study and contributed to financial support, provision of study materials, collection and/or assembly of data, analysis and interpretation, manuscript writing, and final approval of the manuscript.
ACKNOWLEDGMENTS
We would like to thank Kharli Brockmeier for her assistance with experimental procedures and Drs. Flora Vaccarino and Daniel Geschwind for providing valuable advice and datasets. This project was funded by a P20 center grant from NIGMS (GM109089).
Received: February 22, 2017 Revised: September 25, 2017 Accepted: September 26, 2017 Published: October 26, 2017
REFERENCES
Anderson, S.A., Marı´n, O., Horn, C., Jennings, K., and Rubenstein, J. (2001). Distinct cortical migrations from the medial and lateral ganglionic eminences. Development128, 353–363.
Bartolini, G., Ciceri, G., and Marı´n, O. (2013). Integration of GABAergic interneurons into cortical cell assemblies: lessons from embryos and adults. Neuron79, 849–864.
Batista-Brito, R., Machold, R., Klein, C., and Fishell, G. (2008). Gene expression in cortical interneuron precursors is prescient of their mature function. Cereb. Cortex18, 2306–2317.
Ben-Ari, Y., Cherubini, E., Corradetti, R., and Gaiarsa, J. (1989). Giant synaptic potentials in immature rat CA3 hippocampal neu-rones. J. Physiol.416, 303–325.
Canty, A.J., Dietze, J., Harvey, M., Enomoto, H., Milbrandt, J., and Iba´n˜ez, C.F. (2009). Regionalized loss of parvalbumin interneurons in the cerebral cortex of mice with deficits in GFRa1 signaling. J. Neurosci.29, 10695–10705.
Cauli, B., Audinat, E., Lambolez, B., Angulo, M.C., Ropert, N., Tsuzuki, K., Hestrin, S., and Rossier, J. (1997). Molecular and physiological diversity of cortical nonpyramidal cells. J. Neurosci. 17, 3894–3906.
Chenn, A. (2008). Wnt/b-catenin signaling in cerebral cortical development. Organogenesis4, 76–80.
Espuny-Camacho, I., Michelsen, K.A., Gall, D., Linaro, D., Hasche, A., Bonnefont, J., Bali, C., Orduz, D., Bilheu, A., and Herpoel, A. (2013). Pyramidal neurons derived from human pluripotent stem cells integrate efficiently into mouse brain circuits in vivo. Neuron 77, 440–456.
Fame, R.M., MacDonald, J.L., and Macklis, J.D. (2011). Develop-ment, specification, and diversity of callosal projection neurons. Trends Neurosci.34, 41–50.
Finger, J.H., Smith, C.M., Hayamizu, T.F., McCright, I.J., Xu, J., Law, M., Shaw, D.R., Baldarelli, R.M., Beal, J.S., and Blodgett, O. (2017). The mouse gene expression database (GXD): 2017 update. Nucleic Acids Res.45, D730–D736.
Ghanem, N., Yu, M., Long, J., Hatch, G., Rubenstein, J.L., and Ekker, M. (2007). Distinct cis-regulatory elements from the Dlx1/ Dlx2 locus mark different progenitor cell populations in the ganglionic eminences and different subtypes of adult cortical in-terneurons. J. Neurosci.27, 5012–5022.
Gunsalus, K.T., Wagoner, M.P., Meyer, K., Potter, W.B., Schoenike, B., Kim, S., Alexander, C.M., Friedl, A., and Roopra, A. (2012). Induction of the RNA regulator LIN28A is required for the growth and pathogenesis of RESTless breast tumors. Cancer Res. 72, 3207–3216.
Hansen, D.V., Rubenstein, J.L., and Kriegstein, A.R. (2011). Deriving excitatory neurons of the neocortex from pluripotent stem cells. Neuron70, 645–660.
Harrison-Uy, S.J., and Pleasure, S.J. (2012). Wnt signaling and forebrain development. Cold Spring Harb. Perspect. Biol. 4, a008094.
He´bert, J.M., and Fishell, G. (2008). The genetics of early telen-cephalon patterning: some assembly required. Nat. Rev. Neurosci. 9, 678–685.
Hill, R.S., and Walsh, C.A. (2005). Molecular insights into human brain evolution. Nature437, 64–67.
Hofman, M. (2014). Evolution of the human brain: when bigger is better. Front. Neuroanat.8, 15.
Huang, C.T., Tao, Y., Lu, J., Jones, J.R., Fowler, L., Weick, J.P., and Zhang, S.C. (2016). Time-course gene expression profiling reveals a novel role of non-canonical WNT signaling during neural induc-tion. Sci. Rep.6, 32600.
Ip, B.K., Wappler, I., Peters, H., Lindsay, S., Clowry, G.J., and Bayatti, N. (2010). Investigating gradients of gene expression involved in early human cortical development. J. Anat. 217, 300–311.
Johnson, M.A., Weick, J.P., Pearce, R.A., and Zhang, S.C. (2007). Functional neural development from human embryonic stem cells: accelerated synaptic activity via astrocyte coculture. J. Neurosci.27, 3069–3077.
Kanatani, S., Yozu, M., Tabata, H., and Nakajima, K. (2008). COUP-TFII is preferentially expressed in the caudal ganglionic eminence and is involved in the caudal migratory stream. J. Neurosci.28, 13582–13591.
Kang, H.J., Kawasawa, Y.I., Cheng, F., Zhu, Y., Xu, X., Li, M., Sousa, A.M., Pletikos, M., Meyer, K.A., and Sedmak, G. (2011). Spatio-tem-poral transcriptome of the human brain. Nature478, 483–489.
Kang, H., Wilson, C.S., Harvey, R.C., Chen, I.M., Murphy, M.H., Atlas, S.R., Bedrick, E.J., Devidas, M., Carroll, A.J., Robinson, B.W., et al. (2012). Gene expression profiles predictive of outcome and age in infant acute lymphoblastic leukemia: a Children’s Oncology Group study. Blood119, 1872–1881.
Langfelder, P., and Horvath, S. (2008). WGCNA: an R package for weighted correlation network analysis. BMC Bioinformatics 9, 559.
Larsen, Z.H., Chander, P., Joyner, J.A., Floruta, C.M., Demeter, T.L., and Weick, J.P. (2016). Effects of ethanol on cellular composition and network excitability of human pluripotent stem cell-derived neurons. Alcohol. Clin. Exp. Res.40, 2339–2350.
LaVaute, T.M., Yoo, Y.D., Pankratz, M.T., Weick, J.P., Gerstner, J.R., and Zhang, S.C. (2009). Regulation of neural specification from human embryonic stem cells by BMP and FGF. Stem Cells 27, 1741–1749.
Liu, J.K., Ghattas, I., Liu, S., Chen, S., and Rubenstein, J.L. (1997). Dlx genes encode DNA-binding proteins that are expressed in an overlapping and sequential pattern during basal ganglia differenti-ation. Dev. Dyn.210, 498–512.
Long, J.E., Cobos, I., Potter, G.B., and Rubenstein, J.L. (2009). Dlx1&2 and Mash1 transcription factors control MGE and CGE patterning and differentiation through parallel and overlapping pathways. Cereb. Cortex19, i96–i106.
Ma, L., Hu, B., Liu, Y., Vermilyea, S.C., Liu, H., Gao, L., Sun, Y., Zhang, X., and Zhang, S.C. (2012). Human embryonic stem cell-derived GABA neurons correct locomotion deficits in quino-linic acid-lesioned mice. Cell Stem Cell10, 455–464.
Mariani, J., Simonini, M.V., Palejev, D., Tomasini, L., Coppola, G., Szekely, A.M., Horvath, T.L., and Vaccarino, F.M. (2012). Modeling human cortical development in vitro using induced pluripotent stem cells. Proc. Natl. Acad. Sci. USA109, 12770–12775.
Markram, H., Toledo-Rodriguez, M., Wang, Y., Gupta, A., Silber-berg, G., and Wu, C. (2004). Interneurons of the neocortical inhibitory system. Nat. Rev. Neurosci.5, 793.
Maroof, A.M., Keros, S., Tyson, J.A., Ying, S.W., Ganat, Y.M., Merkle, F.T., Liu, B., Goulburn, A., Stanley, E.G., Elefanty, A.G., et al. (2013). Directed differentiation and functional maturation of cortical interneurons from human embryonic stem cells. Cell Stem Cell12, 559–572.
Mertens, J., Wang, Q.W., Kim, Y., Yu, D.X., Pham, S., Yang, B., Zheng, Y., Diffenderfer, K.E., Zhang, J., Soltani, S., et al. (2015). Differential responses to lithium in hyperexcitable neurons from patients with bipolar disorder. Nature527, 95–99.
Meyer, J.S., Howden, S.E., Wallace, K.A., Verhoeven, A.D., Wright, L.S., Capowski, E.E., Pinilla, I., Martin, J.M., Tian, S., Stewart, R., et al. (2011). Optic vesicle-like structures derived from human pluripotent stem cells facilitate a customized approach to retinal disease treatment. Stem Cells29, 1206–1218.
Miyoshi, G., and Fishell, G. (2010). GABAergic interneuron line-ages selectively sort into specific cortical layers during early post-natal development. Cereb. Cortex21, 845–852.
Miyoshi, G., Hjerling-Leffler, J., Karayannis, T., Sousa, V.H., Butt, S.J., Battiste, J., Johnson, J.E., Machold, R.P., and Fishell, G. (2010). Genetic fate mapping reveals that the caudal ganglionic eminence produces a large and diverse population of superficial cortical interneurons. J. Neurosci.30, 1582–1594.
Nicholas, C.R., Chen, J., Tang, Y., Southwell, D.G., Chalmers, N., Vogt, D., Arnold, C.M., Chen, Y.J., Stanley, E.G., Elefanty, A.G., et al. (2013). Functional maturation of hPSC-derived forebrain in-terneurons requires an extended timeline and mimics human neu-ral development. Cell Stem Cell12, 573–586.
Nord, A.S., Pattabiraman, K., Visel, A., and Rubenstein, J.L. (2015). Genomic perspectives of transcriptional regulation in forebrain development. Neuron85, 27–47.
Nordstro¨m, U., Jessell, T.M., and Edlund, T. (2002). Progressive in-duction of caudal neural character by graded Wnt signaling. Nat. Neurosci.5, 525.
Pasca, A.M., Sloan, S.A., Clarke, L.E., Tian, Y., Makinson, C.D., Huber, N., Kim, C.H., Park, J.Y., O’Rourke, N.A., Nguyen, K.D., et al. (2015). Functional cortical neurons and astrocytes from hu-man pluripotent stem cells in 3D culture. Nat. Methods 12, 671–678.
Petanjek, Z., Kostovic, I., and Esclapez, M. (2009). Primate-specific origins and migration of cortical GABAergic neurons. Front. Neu-roanat.3, 26.
Pre, D., Nestor, M.W., Sproul, A.A., Jacob, S., Koppensteiner, P., Chinchalongporn, V., Zimmer, M., Yamamoto, A., Noggle, S.A., and Arancio, O. (2014). A time course analysis of the electrophys-iological properties of neurons differentiated from human induced pluripotent stem cells (iPSCs). PLoS One9, e103418.
Puelles, L., Kuwana, E., Puelles, E., Bulfone, A., Shimamura, K., Keleher, J., Smiga, S., and Rubenstein, J.L. (2000). Pallial and subpallial derivatives in the embryonic chick and mouse telen-cephalon, traced by the expression of the genes Dlx-2, Emx-1, Nkx-2.1, Pax-6, and Tbr-1. J. Comp. Neurol.424, 409–438. Qian, X., Shen, Q., Goderie, S.K., He, W., Capela, A., Davis, A.A., and Temple, S. (2000). Timing of CNS cell generation: a pro-grammed sequence of neuron and glial cell production from isolated murine cortical stem cells. Neuron28, 69–80.
Rakic, P. (2009). Evolution of the neocortex: a perspective from developmental biology. Nat. Rev. Neurosci.10, 724–735. Rudy, B., Fishell, G., Lee, S., and Hjerling-Leffler, J. (2011). Three groups of interneurons account for nearly 100% of neocortical GABAergic neurons. Dev. Neurobiol.71, 45–61.
Saino-Saito, S., Berlin, R., and Baker, H. (2003). Dlx-1 and Dlx-2 expression in the adult mouse brain: relationship to dopaminergic phenotypic regulation. J. Comp. Neurol.461, 18–30.
Sasai, Y. (2005). Directed differentiation of neural and sensory tis-sues from embryonic stem cells in vitro. Ernst Schering Res. Found. Workshop, 101–109.
Schmittgen, T.D., and Livak, K.J. (2008). Analyzing real-time PCR data by the comparative C(T) method. Nat. Protoc.3, 1101–1108.
Shi, Y., Kirwan, P., and Livesey, F.J. (2012). Directed differentiation of human pluripotent stem cells to cerebral cortex neurons and neural networks. Nat. Protoc.7, 1836–1846.
Stein, J.L., de la Torre-Ubieta, L., Tian, Y., Parikshak, N.N., Herna´n-dez, I.A., Marchetto, M.C., Baker, D.K., Lu, D., Hinman, C.R., and Lowe, J.K. (2014). A quantitative framework to evaluate modeling of cortical development by neural stem cells. Neuron83, 69–86. Stenman, J., Toresson, H., and Campbell, K. (2003). Identification of two distinct progenitor populations in the lateral ganglionic eminence: implications for striatal and olfactory bulb neurogene-sis. J. Neurosci.23, 167–174.
Takahashi, K., Tanabe, K., Ohnuki, M., Narita, M., Ichisaka, T., Tomoda, K., and Yamanaka, S. (2007). Induction of pluripotent stem cells from adult human fibroblasts by defined factors. Cell 131, 861–872.
Theiler, K. (2013). The House Mouse: Atlas of Embryonic Develop-ment (Springer Science & Business Media).
van de Leemput, J., Boles, N.C., Kiehl, T.R., Corneo, B., Lederman, P., Menon, V., Lee, C., Martinez, R.A., Levi, B.P., and Thompson, C.L. (2014). CORTECON: a temporal transcriptome analysis of in vitro human cerebral cortex development from human embry-onic stem cells. Neuron83, 51–68.
Walther, C., and Gruss, P. (1991). Pax-6, a murine paired box gene, is expressed in the developing CNS. Development113, 1435–1449. Watanabe, K., Kamiya, D., Nishiyama, A., Katayama, T., Nozaki, S., Kawasaki, H., Watanabe, Y., Mizuseki, K., and Sasai, Y. (2005). Directed differentiation of telencephalic precursors from embry-onic stem cells. Nat. Neurosci.8, 288–296.
Weick, J.P., Austin Johnson, M., and Zhang, S.C. (2009). Develop-mental regulation of human embryonic stem cell-derived neurons by calcium entry via transient receptor potential channels. Stem Cells27, 2906–2916.
Weick, J.P., Held, D.L., Bonadurer, G.F., 3rd, Doers, M.E., Liu, Y., Maguire, C., Clark, A., Knackert, J.A., Molinarolo, K., Musser, M., et al. (2013). Deficits in human trisomy 21 iPSCs and neurons. Proc. Natl. Acad. Sci. USA110, 9962–9967.
Wonders, C.P., and Anderson, S.A. (2006). The origin and specifica-tion of cortical interneurons. Nat. Rev. Neurosci.7, 687–696. Xu, Q., Wonders, C.P., and Anderson, S.A. (2005). Sonic hedgehog maintains the identity of cortical interneuron progenitors in the ventral telencephalon. Development132, 4987–4998.
Zecevic, N., Hu, F., and Jakovcevski, I. (2011). Interneurons in the developing human neocortex. Dev. Neurobiol.71, 18–33. Zhang, B., and Horvath, S. (2005). A general framework for weighted gene co-expression network analysis. Stat. Appl. Genet. Mol. Biol.4, 1128.