FOOD-WEB LINKAGES AND COMMUNITY DYNAMICS ACROSS BIOGENIC HABITAT BOUNDARIES
Shelby L. Ziegler
A dissertation submitted to the faculty at the University of North Carolina at Chapel Hill in partial fulfillment of the requirements for the degree of Doctor of Philosophy in the
Environment, Ecology, and Energy Program.
Chapel Hill 2020
ABSTRACT
Shelby L. Ziegler: Food-web linkages and community dynamics across biogenic habitat boundaries
(Under the direction of F. Joel Fodrie)
Many species move within and across diverse habitat mosaics over their lifetime,
requiring ecologists to study cross-landscape population dynamics and trophic interactions. Salt marshes are nursery habitats that exist at the interface between terrestrial and aquatic ecosystems connected by tidal fluctuations allowing the movement of both predators and prey across distinct ecological boundaries and therefore are ideal study systems for exploring such dynamics. My dissertation investigates the movement of estuarine nekton across the land-sea interface and the subsequent implications for food webs. I combined a literature synthesis and extensive fieldwork across multiple sites, landscapes, and geographic scales to ask 2 main questions: 1) How does marsh habitat configuration influence estuarine species’ abundance and diversity; and 2) How does energy flow from marshes to the estuary vary across geographic scales, and what
ACKNOWLEDGEMENTS
I would first and foremost like to thank my advisor Joel Fodrie. From the very beginning, you have encouraged me to ask the difficult questions and challenged me to think about the bigger picture of my work. You have taught me to think critically about my results and to become a stronger writer. You have been instrumental in helping me navigate the unique challenges of a research career and I truly believe I am a much better scientist today because of your guidance. To my committee, Jaye Cable, Pete Peterson, Ken Able and Brian Silliman, thank you for all of the valuable insights and advice you have given me over the years. To Mike
Piehler, thank you for stepping in and always being there to help when needed.
have given me over the past 5 years. Each and every one of you has inspired me and made an enormous impact on my research and life and I cannot thank you enough.
To all the friends I have made at IMS and in the Triangle, I could not have made it through without you. To my mountain bike ladies, especially Alicia Holtz and Lea Woodard, thank you so much for giving me an outlet from work to enjoy nature. You all made me laugh, smile, and get some type-2 fun when I needed it most. To my Burn Boot Camp – Chapel Hill family, particularly Gena Kirkman, Sam Glenn, Steven Arias, and Charlie Johnson, thank you for the encouragement, support, and numerous high fives. Burn has made me physically and mentally stronger and you have all helped me get through the writing phase of this dissertation without going crazy.
To my entire family, thank you so much for the constant, endless love and support. I am who I am today because of your reassurance and guidance. You have never doubted me and continued to push me through every challenge that I hit along the way. Jen and Kait, I have learned so much from the two of you over the course of my entire life. Thank you for always believing in me and accepting me as your nerdy little sister. To my mom, my biggest champion from day one. Thank you for teaching me to reach for the stars and work hard for what I believe in. Without your, love, perspective, and constant encouragement, I would not be where I am today.
TABLE OF CONTENTS
LIST OF TABLES ... xiii
LIST OF FIGURES ... xv
LIST OF SYMBOLS AND ACRONYMS ... xvii
INTRODUCTION ... 1
REFERENCES ... 7
Introduction ... 9
Methodology ... 12
Habitat identification and characterization... 12
Characterization of the nekton community ... 13
Statistical analysis ... 14
Quantitative simulations ... 15
Results ... 15
Quantitative Simulations ... 17
Discussion ... 18
Acknowledgements ... 22
REFERENCES ... 23
FIGURES ... 29
CHAPTER 2: DIETARY SHITS ACROSS BIOGEOGRAPHIC SCALES ALTER SPATIAL SUBSIDY DYNAMICS ... 34
Introduction ... 34
Materials and Methods ... 38
Database assembly for fish diets... 38
Literature search for environmental characteristics ... 40
Tidal data acquisition ... 40
Statistical Analyses ... 41
Results ... 43
Discussion ... 44
Acknowledgements ... 50
REFERENCES ... 51
TABLES ... 56
FIGURES ... 59
CHAPTER 3: ABIOTIC CYCLES MEDIATE THE STRENGTH OF CROSS-BOUNDARY CONSUMPTION WITHIN TERRESTRIAL MARINE FOOD WEBS... 64
Introduction ... 64
Methods... 67
Predation assays ... 67
Habitat characteristics... 68
Nekton sampling... 69
Shoot density experiment ... 69
Shoot height experiment ... 70
Statistical analyses ... 71
Results ... 72
Predation assays ... 72
Nekton Sampling ... 73
Shoot density experiment ... 73
Shoot height experiment ... 74
Discussion ... 74
Acknowledgements ... 78
REFERENCES ... 79
TABLES ... 82
FIGURES ... 85
CHAPTER 4: GEOGRAPHIC VARIATION IN MARSH-DERIVED CARBON CONTRIBUTION TO TRANSIENT ESTUARINE PREDATORS ... 90
Introduction ... 90
Methods... 93
Study sites... 93
Sample Collection ... 94
Results ... 97
Trophic position model ... 97
Multisource mixing models ... 98
Discussion ... 99
Acknowledgements ... 103
REFERENCES ... 105
TABLES ... 108
LIST OF TABLES
Table 1.1 ANOVA results for total catch rates across all marsh island
types. ...28 Table 1.2 Tukey HSD pairwaise comparison of means for all marsh types
with 95% confidence intervals. ...28 Table 2.1 Table indicating the number of studies from each region with a
given diet metric for each species of interest: FO (frequency of
occurrence), N (percent number), V (percent volume), and W (percent
weight).. ...56 Table 2.2 Non-parametric Kruskal - Wallis results of the influence of
geographic region on frequency of occurrence (FO), Mean tidal range,
shoot density, shoot heigh and total plant biomass. ...56 Table 2.3 Chi square results for binomial regression on the presence of
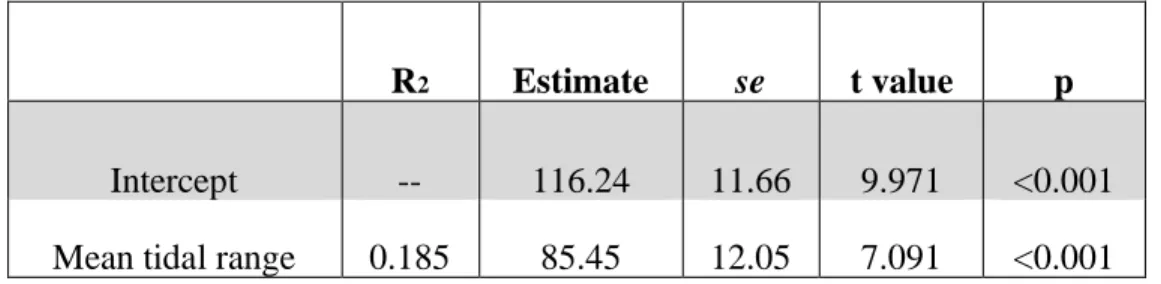
marsh-platform fishes in the diet and mean tidal range ...57 Table 2.4 Linear regression results comparing the influence of mean tidal
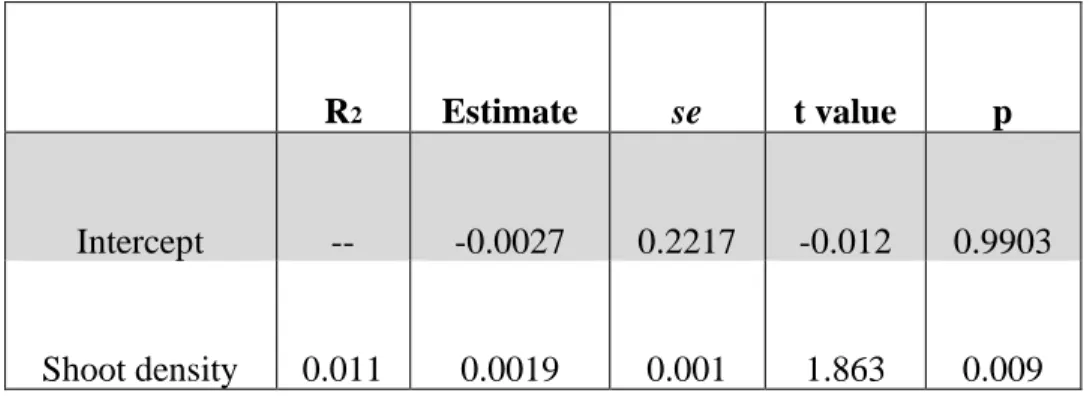
range on marsh shoot density ...57 Table 2.5 Linear regression results comparing the influence of marsh
shoot density on the frequency of occurrence of marsh-platform species in
the diet of transient fishes. ...58 Table 2.6 PERMANOVA results investigating the influence of geographic
region and predator species on fish diet composition ...58 Table 3.1 Result output for scheirer-ray-hare test broadly examining how
predation of snails varied across sites and with distance into the marsh ...82 Table 3.2 Summary of AIC and degrees of freedom (df) for all model
combinations. The model combination in bold is the final model used in
this analysis. ...82 Table 3.3 Selected model output ...83 Table 3.4 Repeated measures ANOVA results for nekton CPUE with site
as a factor and sampling month as an error term. ...83 Table 3.5 Kruskal Wallis results for both shoot density and shoot height
Table 3.6 Sheirer-ray-hare results on the impact of distance into the marsh and season (summer or fall) on consumption rates of standardized dried
squid. ...84 Table 4. 1 Mean stable isotope values (± SD; ‰) for the primary
producers. ...108 Table 4. 2 Mean stable isotope values (± SD, ‰) for consumers of
LIST OF FIGURES
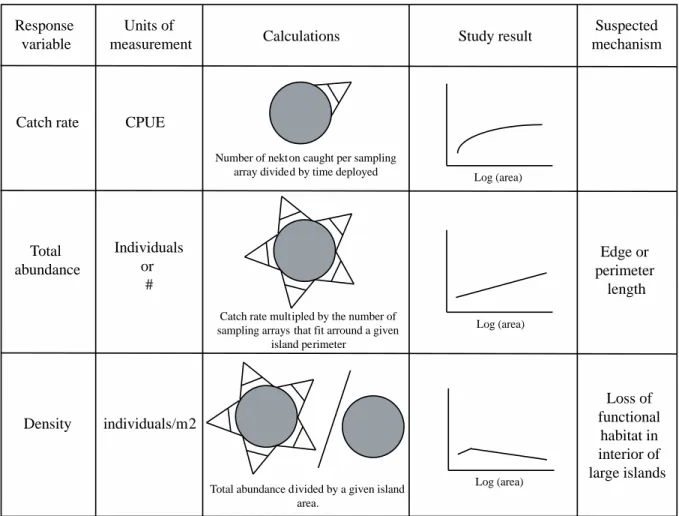
Figure 1.1 Diagram explaining the response variables, calculations, study
results and proposed mechanisms. ...29 Figure 1.2 The influence of marsh island area on (A) catch rates, (B) total
abundance and (C) nekton density across small, medium and large marsh
islands. ...30 Figure 1.3 The influence of marsh island area on species richness across
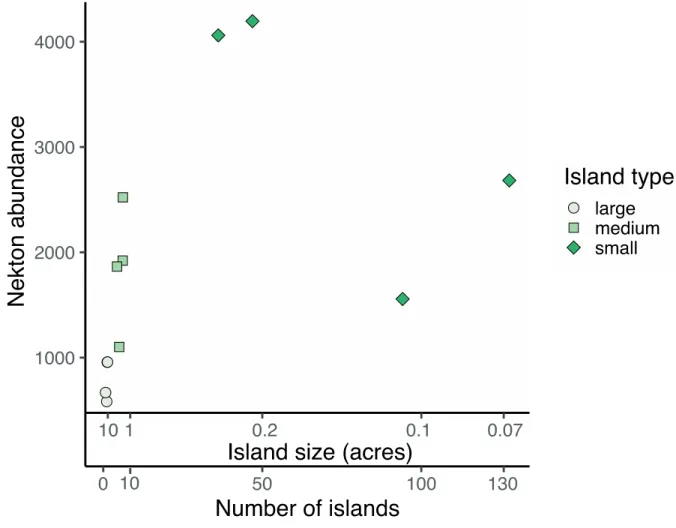
small, medium and large marsh islands. ...31 Figure 1.4 Representative figure for quantitative simulations examining
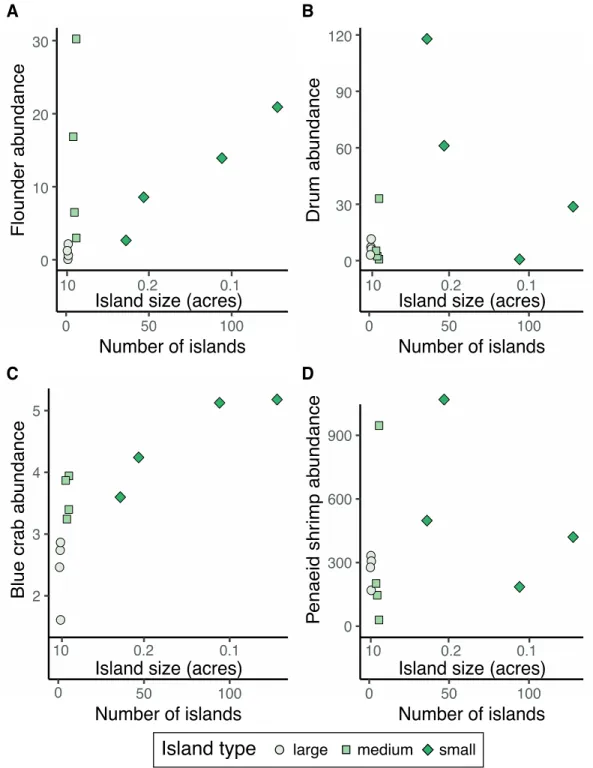
the changes in abundance of all nekton with varying island size. ...32 Figure 1.5 Representative figure for quantitative simulations examining
the changes in abundance of (A) flounders, Paralichthys sp,, (B) drums, Sciaenidae, (C) blue crabs, Callinectes sapidus, and (D) penaeid shrimp,
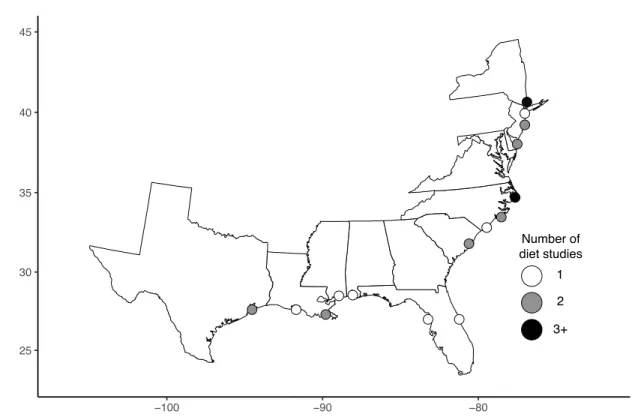
Penaeidae. ...33 Figure 2.1 Map of study locations.. ...59 Figure 2.2 Frequency of occurrence of marsh platform species (fiddler
crabs and killifish species) in the diets of predatory fish across three
geographic regions. ...60 Figure 2.3 Marsh habitat characteristics aggregated across three regions of
interest. ...61 Figure 2.4 Frequency of occurrence of marsh-platform species in the diets
of predatory fish as a function of marsh habitat characteristics: (A) tidal
range, and (B) shoot density. ...62 Figure 2.5 Nonmetric multidimensional scaling ordination of predator
species diets. ...63 Figure 3.1 Map of sampling sites along the coast of North Carolina, USA.. ...85 Figure 3.2 Proportion of snails eaten across sampling sites ...86 Figure 3.3 Proportion of snails eaten with respect to inundaton time, shoot
denstiy and shoot height...87 Figure 3.4 The catch per unit effort of all nekton along an inundation
Figure 3.5 The proportion of prey eaten with increasing shoot density and
shoot height.. ...89
Figure 4. 1 Map of areas sampled for marsh taxa ...110
Figure 4. 2 Multispecies trophic position model output for all taxa sampled by region.. ...111
Figure 4. 3 Proportions of contribution estimates of primary production to the diets of transient species collected from each location.. ...112
Figure 4. 4 Bayesian mixing model outputs for Gulf of Mexico species. ...113
Figure 4. 5 Bayesian mixinig model outputs for South Atlantic species. ...114
LIST OF SYMBOLS AND ACRONYMS μ average
ANOVA Analysis of Variance C Celsius
° degree
df degrees of freedom > greater than
< less than m meter mm millimeter MSL mean sea level
NAVD 88 North Atlantic Vertical Datum of 1988 NOAA National Oceanic Atmospheric Administration % percent
INTRODUCTION
Over heterogeneous landscapes, organisms and energy move across ecological boundaries and this can have profound effects on overall ecosystem functioning. These movements require ecologists to study population dynamics and trophic interactions across distinct habitats within a landscape. The movement of fauna between habitats can be at small scales such as diel migrations up and down the water column to large-scale continental migrations that occur over months or years (e.g., birds, herd species) and can have profound effects on the interactions among species within a community. The connection between habitats or ecosystems driven by environmental heterogeneity (spatial variation of abiotic and biotic factors) may affect the movement patterns (Irlandi and Crawford 1997) and feeding rates of individuals (Micheli and Peterson 1999). Furthermore, the connectivity of the landscape allowing or preventing cross-habitat foraging can affect the rates of predation or herbivory within a given habitat type, altering community dynamics (i.e., net ecosystem productivity).
The loss of structured habitat at local, regional, and global scales has created areas of high fragmentation resulting in habitat patches with high amounts of edge in contrast to previous large contiguous tracts of habitat and reduced connectivity between habitats with in a landscape (Fagan et al. 1999). Understanding the effect of habitat edges on species interactions (e.g.
The coastal transition zone or land-sea interface is a distinct ecotone that links terrestrial and marine habitats (Talley et al. 2003) and this ecological boundary is an ideal location to study the movement of organisms and energy. Research at this interface traditionally focuses on the flow of energy, nutrients and organisms from highly productive habitats to adjacent relatively unproductive systems (Catenazzi and Donnelly 2007). Yet, organisms and energy can flow across this interface from one productive system to another (Polis and Hurd 1996) and in many cases predators will move across highly productive-structured habitat boundaries to forage (Nakano and Murakami 2001). The movements of organisms across habitat-boundaries to forage and subsequent energy flow from one habitat to another result in spatial subsidies. Spatial
subsidies occur when allochthonous inputs enhance or subsidize organisms or communities in an adjacent habitat or system (Polis et al. 1997). Allochthonous inputs entering a system can vary in both space and time even within the same habitat types (Vander Zanden and Sanzone 2004).
total amount of energy from a given marsh is difficult to quantify due to biotic (local habitat structure) and abiotic (tide) factors limiting connectivity between the marshes and surrounding estuaries (Rozas 1995, Minello et al. 2012, Baker et al. 2013) as well as energy flow from alternate sources such as detritus or dissolved organic matter (Teal 1962). Having a more thorough understanding of the types of marshes that support the most ecologically and
economically-valuable taxa and how and where estuarine consumers forage we can better protect critical marsh habitats that directly enhance secondary production in coastal systems.
In this dissertation, I asked 2 main questions: 1) How does marsh habitat configuration influence estuarine species’ abundance and diversity; and 2) How does energy flow from marshes to the estuary vary across geographic scales, and what environmental variables
tidal inundation gradient and with varying plant structure. This study assessed how both abiotic drivers (tide) and biotic drivers (habitat structure) influence nekton habitat utilization and how far into the marsh nekton will forage through an observational study and habitat manipulation experiments. Lastly, in Chapter 4, I utilized stable isotope biomarkers to determine the
importance of salt marsh primary production on estuarine secondary production from the Gulf of Mexico to the Mid-Atlantic region.
In whole, this dissertation research provides key information to better understanding geographic and landscape-scale variation in the value of marsh habitats for estuarine nekton communities and the movement of organisms and energy across the land-sea biogenic habitat interface. My dissertation work emphasizes the relative importance of three key ecological drivers that influence geographic variation in coastal habitat structure and function for estuarine species: seascape, hydroperiod, and vegetation. Collectively, these studies reveal that patterns of habitat use by estuarine species and the process trophic relay (trophic transfer) from the marsh to estuary vary across space and time. Energy flows from the marsh to estuary occurs via distinct pathways (detrital vs. animal vectors) across regions driven predominantly by variation in tidal inundation. Across these regions, the diversity of primary producers within and adjacent to marsh systems may influence the relative contribution of marsh- versus aquatic-derived energy to estuarine fish species. In particular, in the Gulf of Mexico where marsh carbon is the dominant source of energy, estuarine food webs may be less resilient to continued loss of marsh habitat. While along the Atlantic coast, where a wide variety of basal-carbon sources are present and contributing to the diets of estuarine species, communities may be more capable of responding to marsh loss in regards to food-web dynamics.
Lastly, my work emphasizes the importance of understanding local or regional scale geographic variation to find commonality across salt marsh ecosystems regardless of latitudinal gradients, and predict how global change may influence marsh-associated estuarine species. The majority of research on the importance of marsh habitats for fisheries production has been
conducted in the Gulf of Mexico. From this work marshes have been deemed critical nursery habitats for many fishes and crustacean, however when considered for conservation and
REFERENCES
Baker, R., B. Fry, L. P. Rozas, and T. J. Minello. 2013. Hydrodynamic regulation of salt marsh contributions to aquatic food webs. Marine Ecology Progress Series 490:37–52.
Breed, G. A., G. A. Jackson, and T. L. Richardson. 2004. Sedimentation, carbon export and food web structure in the Mississippi River plume described by inverse analysis. Marine Ecology Progress Series 278:35–51.
Brown, J. H., J. F. Gillooly, A. P. Allen, V. M. Savage, and G. B. West. 2004. Toward a metabolic theory of ecology. Ecology 85:1771–1789.
Catenazzi, A., and M. A. Donnelly. 2007. The Ulva connection: marine algae subsidize terrestrial predators in coastal Peru. Oikos 116:75–86.
Fagan, W. F., R. S. Cantrell, and C. Cosner. 1999. How Habitat Edges Change Species Interactions. The American Naturalist 153:165–182.
Ibañez, C., A. Curco, J. W. Day, and N. Prat. 2000. Structure and Productivity of Microtidal Mediterranean Coastal Marshes. Pages 107–136 in M. P. Weinstein and D. A. Kreeger, editors. Concepts and Controversies in Tidal Marsh Ecology. Springer Netherlands, Dordrecht.
Irlandi, E. A., and M. K. Crawford. 1997. Habitat linkages: the effect of intertidal saltmarshes and adjacent subtidal habitats on abundance, movement, and growth of an estuarine fish. Oecologia 110:222–230.
Kneib, R. T. 2002. Salt Marsh Ecoscapes and Production Transfers by Estuarine Nekton in the Southeastern United States. Pages 267–291 in M. P. Weinstein and D. A. Kreeger, editors. Concepts and Controversies in Tidal Marsh Ecology. Springer Netherlands. Mann, K. H. 1986. The Role of Detritus at the Land-Sea Boundary. Pages 123–140 in P.
Lasserre and J.-M. Martin, editors. Elsevier Oceanography Series. Elsevier.
Micheli, F., and C. H. Peterson. 1999. Estuarine Vegetated Habitats as Corridors for Predator Movements. Conservation Biology 13:869–881.
Minello, T. J., L. P. Rozas, and R. Baker. 2011. Geographic Variability in Salt Marsh Flooding Patterns may Affect Nursery Value for Fishery Species. Estuaries and Coasts 35:501– 514.
Nakano, S., and M. Murakami. 2001. Reciprocal subsidies: Dynamic interdependence between terrestrial and aquatic food webs. Proceedings of the National Academy of Sciences 98:166–170.
Nordlie, F. G. 2003. Fish communities of estuarine salt marshes of eastern North America, and comparisons with temperate estuaries of other continents. Reviews in Fish Biology and Fisheries 13:281–325.
Polis, G. A., W. B. Anderson, and R. D. Holt. 1997. Toward an Integration of Landscape and Food Web Ecology: The Dynamics of Spatially Subsidized Food Webs. Annual Review of Ecology and Systematics 28:289–316.
Polis, G. A., and S. D. Hurd. 1996. Linking Marine and Terrestrial Food Webs: Allochthonous Input from the Ocean Supports High Secondary Productivity on Small Islands and Coastal Land Communities. The American Naturalist 147:396–423.
Rozas, L. P. 1995. Hydroperiod and its influence on nekton use of the salt marsh: A pulsing ecosystem. Estuaries 18:579–590.
Talley, D. M., E. W. North, A. R. Juhl, D. A. Timothy, D. Conde, J. F. C. deBrouwer, C. A. Brown, L. M. Campbell, T. Garstecki, C. J. Hall, F. J. R. Meysman, D. M. Nemerson, P. W. Souza Filho, and R. J. Wood. 2003. Research challenges at the land–sea interface. Estuarine, Coastal and Shelf Science 58:699–702.
Teal, J. M. 1962. Energy Flow in the Salt Marsh Ecosystem of Georgia. Ecology 43:614–624. Vander Zanden M. J., and D. M. Sanzone. 2004. Food web subsidies at the land-water ecotone.
CHAPTER 1: INFLUENCE OF MARSH ISLAND SIZE ON NEKTON COMMUNITIES: INTERMEDIATE OPTIMA RATHER THAN SLOSS
Introduction
Anthropogenic activities resulting in habitat loss or degradation at local, regional, and global scales is directly associated with the loss of biodiversity, declines in abundance, and decreases in overall community biomass across many ecological systems (Haddad et al. 2015). The
relationship between aboveground biomass of foundation species (biogenic habitat) and faunal diversity and abundance has been well studied across a variety of systems such as grasslands (Tilman et al. 1997), meadows (Roscher et al. 2005), freshwater wetlands (Engelhardt and Ritchie 2001), and tropical forests and among diverse animal groups (Alroy 2017). The loss of essential habitat altering functionality for species is particularly evident in shallow water coastal systems. For example, oyster reefs systems have been degraded globally to ~85% of their historic extent (zu Ermgassen et al. 2012), and the loss of oysters has resulted in the loss of resident species (e.g. worms, amphipods, etc.), decreased food resources for mobile species (Airoldi et al. 2008) and diminished ecosystem services (Grabowski et al. 2012). There is evidence that the transition from structured to relatively unstructured habitat due to habitat degradation can affect species identity, abundance, and richness (Micheli et al. 2008) as well as functional diversity within a system (Dobson et al. 2006)
.
extinction of species. Extinction rates tend to be highest and immigration rates lowest on small islands compared to large islands (MacArthur and Wilson 1967). The idea larger islands can sustain a greater diversity of species and overall number of organisms compared to small islands is attributed to increased habitat heterogeneity on large islands allowing for more species to colonize unique habitats reducing competition and extinction, as well as the ability of
populations on large islands to better withstand disturbances (i.e. knock-out effect). The degree of isolation from the mainland may also affect the faunal richness and abundance on both large and small islands due to the ability of species to disperse to these locations (Simberloff and Abele 1976). However, these relationships may not hold true on islands with fewer habitat niches (i.e. monocultures) or for islands that are colonized or utilized by highly mobile species which move across landscapes to access diverse resources (food or refuge; MacDonald et al. 2018).
To mitigate the loss of habitat for faunal species, scientists and managers have moved toward both the conservation of habitats through protected reserves and the active restoration of habitats. However, the design of reserves has been hotly debated in the field of conservation biology.
During the 1970s and 80s there began a debate in conservation ecology as to whether a single large or several small (SLOSS) reserves were a superior means of conserving biodiversity and maintaining high faunal abundance and biomass across fragmented landscapes. While SLOSS dynamics are still debated, syntheses across studies suggest the value of one large island or many small islands for enhancing biodiversity or faunal abundance is context dependent and therefore difficult to make overarching generalizations (Maiorano et al. 2008).
Evidence from terrestrial systems and theoretical models suggests that large contiguous tracts of habitat will support more species and individuals (and more biomass than several small
For example, in seagrass habitats several smaller patches tend to support higher recruitment, diversity, and abundances of organisms than one continuous meadow (McNeill and Fairweather 1993). Additionally, theoretical models of marine reserves for fishery species emphasizes that several smaller reserves tend to support the highest catches of economically and ecologically valuable species (Moussaoui and Auger 2015). There may also be complex interactions, for example, Yeager et al. (2016) found that only after a certain threshold of seagrass habitat area loss does biodiversity decline with increasing patch fragmentation. Estuarine wetlands (e.g. mangroves and salt marshes) lie at the interface between terrestrial and marine systems and therefore, may have unique dynamics in regards to SLOSS due to variable tidal flooding influencing access by mobile aquatic species. Studies in mangrove systems have shown that species diversity and abundance is dictated by island size, isolation, and ocean currents
(delivering propagules) suggesting one large island may be better for species (Field et al. 1998). However, most studies within mangroves have focused on relatively sessile species or terrestrial taxa that may not be influenced by daily tidal fluctuations. A recent study by Meyer and Posey (2014) found increased area of salt marsh islands up to 10,000m2 corresponded with increased
catch rates of marsh resident taxa but no effect on a mobile fish species. Yet the influence of marsh island size (area and perimeter length) in conjunction with local fine-scale habitat features and the surrounding habitat matrix has not been investigated in regards to overall estuarine community dynamics.
influences the species richness, and abundance of estuarine nekton through monthly sampling from June to October across 2 years considering both fine-scale habitat features and adjacent habitat structure. Using our empirical survey findings, we conducted quantitative simulations to determine the optimal island size and number (invoking SLOSS) that best maximize the
conservation impact vis-à-vis abundance of transient nekton communities as well as individual taxa. Specifically, if conservation or restoration practitioners were able to conserve or restore a given amount of marsh habitat (e.g. 10 acres or ~40,000m2: a large but reasonable scale based on
published examples: Levin et al. 1996, Johnston et al. 2002, Strange et al. 2002, Raposa et al. 2018) would one large marsh island sustain or support more or less individuals than several small islands?
Methodology
Habitat identification and characterization
We sampled 18 marsh sites across 3 sounds in North Carolina: Back Sound, Bogue Sound, and Core Sound are mixoeuhaline back-barrier embayments, encompassing both large fringing marshes and isolated marsh islands (Table 1). Within each sound we chose 2 fringing mainland marshes (wide >100 m and skinny < 50 m from the seaward to landward edge) and 4 isolated marsh islands ranging from 300 - 55,000 m2 in area with varying perimeter lengths. To
ensure that the entire range of natural marsh islands was encompassed in each sound during sampling we targeted natural islands that fit into 3 size bins: small 300 - 1,200 m2; medium 6,000
- 10,000 m2 and large 30,000 - 55,000 m2 (however, size bin was not formally included in
habitat (i.e., seagrass) was evaluated using Google Earth Engine (Gorelick et al. 2017). Using Landsat-8 imagery we trained the program to identify areas of seagrass using the classification and regression trees (CART) approach with the classifier package (Breiman et al. 1984).
Additionally, at each site, fine-scale marsh grass characteristics were measured by bi-monthly surveys from June to October in 2017 and 2018. We placed 4 transects up to 50 m in length landward from the marsh-estuarine edge. For marsh islands, transects were oriented toward the center of the marsh. Quadrats (0.25 m2) were placed at 1 m, 5 m, 10 m, 25 m or half
way to island center, and 50 m or island center. We enumerated the shoot density, the 3 tallest shoot heights, and the number of plant species present within each quadrat to assess the fine-scale heterogeneity of a given marsh site.
Characterization of the nekton community
and 10 m landward from the marsh edge. All nekton captured were identified to the lowest taxonomic level possible, counted, measured for standard length, and all individuals of a given species were weighed wet. We evaluated the nekton assemblage at each site based on species richness (count of species sampled), catch rate (CPUE), total relative nekton abundance, and relative nekton density (total relative nekton abundance/m2; Figure 1.1).
Statistical analysis
To broadly determine if there was a unique relationship between the overall catch rates of unfragmented mainland marshes and marsh islands, we ran a one-way analysis of variance (ANOVA) and a Tukey’s test to assess pairwise comparisons. To assess the influence of marsh size, perimeter length, edge shoot density and adjacent seagrass habitat on both species richness and faunal catch rates (number of nekton captured/net soak time) on only marsh islands, we ran linear mixed effect models with the lme4 package (Bates et al. 2015) in R (version 3.6.2). Our models used fixed factors of perimeter length, area, percent seagrass cover within a 250-m buffer of the marsh, average edge shoot density, and with a random factor of month. Optimal models were selected based on Akaike information criterion (AIC). AIC is a measure of how well the data is explained by a model and accounts for goodness of fit, model complexity, and parsimony (Akaike 1987).
We also leveraged our catch-rate data to investigate total relative abundance and density for each site and month. Total relative abundance is the number of fishes and crustaceans that would be present on a marsh island if the entire island was sampled. Density is the number of fish and crustaceans that are present within a given area (m2) on each island. These calculations
for each island by the number of sampling arrays that would span the island’s perimeter (Figure 1.1). This assumes that all fish leave the marsh platform as tide falls, which is reasonable as most nekton require at least 5 cm of water on the marsh surface to survive (Minello et al. 2012) and no island had sub-habitat features (e.g. ponds or pools) for species to colonize while the marsh platform was dry. To calculate density (#/m2), we divided total relative abundance for each
island by the marsh island’s area (Figure 1.1). Quantitative simulations
We conducted quantitative simulations utilizing our density calculations to investigate whether a single large or several small marsh islands support more or less fauna regardless of species, rather than number of species. We calculated the relative abundance of nekton (N) for a given island size and number that would make up a proposed conservation or restoration area. We multiplied the previously calculated density for each site (#/m2) by the total conservation
area of interest (x).
Nx = #/m2 * x
We then plotted the relative abundance for all island size and number combinations to determine the size of islands that would support the highest nekton abundance (holding total island area the same for each size-and-number combination). We ran these calculations for the entire nekton community, as well as for ecologically and economically valuable taxa: drums, Scianeidae, flounders, Paralichthys spp., blue crabs, Callinectes sapidus, and penaeid shrimp (Farfantepenaeus aztecus and Litopenaeus setiferus).
Results
(Table 3), wide fringing mainland marshes had the highest catch rates (59.11 +/- 8.39), seconded by skinny fringing marshes (54.65 +/- 7.95). Marsh island catch rates peaked at large islands (35.17 +/- 4.16) and was lowest at small marsh islands (27.13 +/- 4.65). For our analysis of marsh islands and landscape parameters (area, perimeter length, seagrass and marsh plant density), our final model (AIC = 906.5) incorporated fixed effects of island area and perimeter length with a random effect of month and we did observe a clear relationship between catch rates and marsh island area and perimeter length (Figure 1.2A). The 2 smallest marsh islands (BA2 and CS3) had much lower catch rates (11.31 +/- 1.5 and 16.0 +/- 3.4 individuals respectively) compared to all other islands (μ = 36.24 +/- 2.52) Surprisingly, the island with the highest
perimeter length (BA1) had low catch rates (19.2+/-3.8 individuals) compared to other islands of a similar size sampled (μ =40.48 +/- 1.94). The highest catch rates (44.2+/-9.6 individuals) were at the largest marsh island (CS6). Notably, there was large variability in overall catch rates across months indicative of community responses to seasonal changes in water temperature, recruitment phenology, and tidal patterns.
We found relationships between total nekton abundance and island area, perimeter length, and the proportion of seagrass to sandflat habitat surrounding the island (R2 = 0.925, F3,8
= 32.95, p < 0.001), with island area having the most influence on total abundance (t = 2.308, p = 0.049). Total abundance was highest at the largest island CS6 with 908.63 +/- 338.41 individuals and lowest at the second smallest island BA2 with an average of 16.54 +/- 6.9 individuals
(Figure 1.2B). However, the density of nekton per island had an inverse trend to total abundance (R2 = 0.581, F3,8 = 3.69 , p = 0.06), but no clear statistical relationship between island area,
individuals/m2 respectively (Figure 1.2C). The lowest densities of nekton were at the largest
islands BA1 and CS6 with 0.016 +/- 0.006 and 0.014 +/- 0.005 individuals/m2 respectively.
We did not detect a statistically clear relationship between species richness and island area or perimeter length (Figure 1.3). Our best model to estimate species richness incorporated marsh plant shoot density along the edge with a random effect of month (AIC = 492.7). On average we captured approximately 16 species per site per month (16.59 +/- 0.35). The highest species richness observed was 26 species in July 2017 at a medium-sized island (CS2) with an average shoot density of 61.0 +/- 6.35 shoots/0.25 m2 and the lowest was nine species in August
2017 at another medium-sized island (BA3) with an average shoot density of 9.5 +/- 0.71 shoots/0.25 m2.
Quantitative Simulations
Our quantitative simulations indicate that conserving or restoring ~0.28-acre islands would result in the greatest enhancement of nekton, per total unit area of marsh
conserved/restored, at whole-estuary scales. Indeed, our simulations indicate that several 0.28-acre islands (totaling 10 0.28-acres together) would support 7 times more nekton than 1 large 10-0.28-acre (40,000m2) island and 1.5 times more nekton than hundreds of 0.07-acre islands (also totaling 10
acres together, Figure 1.4).
follow a clear trend with the highest relative abundances at a few 1.6-acre and several 0.07-acre islands (Figure 1.5A). The relative abundance of blue crabs peaked at many islands less than 0.1-acre in size (Figure 1.5C).
Discussion
With continued anthropogenic and climatic stressors, continuous tracts of habitat are going to be more easily broken apart or fragmented (Opdam and Wascher 2004). The active conservation and restoration of key biogenic habitats are avenues to ensure structured habitats persist, providing essential refuge for many organisms. However, scientists, managers, and decision-makers need a better understanding of how the size (area), configuration (e.g., edge or perimeter length), and the matrix surrounding structured habitats influence the function of restoration or conservation areas for entire communities as well as for economically- and
ecologically-important taxa (Boström et al. 2011). Continued habitat loss and fragmentation will increase the prevalence of isolated islands altering the functionality of habitats for mobile or transient species. Our data emphasizes that prioritizing the conservation and restoration of not only structured habitats but, certain landscape-scale features is essential to providing the greatest support for a wide-range of ecologically and economically-valuable taxa.
shore connectivity creating one contiguous habitat. This increased catch rates of nekton at mainland marshes may be due to sub-habitat features provided by fringing marshes compared to marsh islands. Mainland marshes are dissected by tidal creeks, marsh pools, and ponds, which may provide enhanced protection of juvenile species from predators and result in increased use and access of the marsh platform (Able et al. 2012). In contrast, the marsh islands sampled were fairly ubiquitous in habitat type, with no creeks or ponds present. Due to more homogenous habitat features and clearly defined perimeters, marsh islands were further analyzed to identify the landscape and fine-scale habitat features that influence the support function of fragmented sites for transient estuarine species.
The results of the quantitative simulations indicate the highest relative abundance of nekton is found a multiple marsh islands of approximately 0.28 acres or 1000m2 in size, an
It is important to note, that the functionality of marsh islands and the optimal size and number of islands varies based on the species or functional group examined. For instance, we found that the relative abundances of blue crabs, both ecologically and economically-important in the system studied, continued to increase as marsh islands became smaller and more
numerous. Our results emphasize the value and importance at examining how restoration or conservation influences different species or functional groups in addition to the entire
community. Specifically, the plan or restoration strategy that seems to support the most species or highest abundance of individuals may be detrimental to key taxa within the system.
In terms of restoration and conservation practices, the quantitative simulations to determine the island size and number to best support transient nekton is a viable option at circular marsh islands. Circular marsh islands are often found naturally in our estuarine system and likely represent previously continuous marshes that have become eroded and separated from shore. We had low catch rates at the large marsh island with the greatest perimeter length of all sites (BA1) and a perimeter to area ratio of 0.05, however the total relative abundance was equivalent to other islands with similar areas. Potentially, increased edge provides more overall space for nekton species to flow back to the estuary as the tide recedes and would result in lower overall catch rates but high abundances of transient species. This would suggest that one long skinny section of habitat, rather than circular islands, may increase production or support of organisms due to high perimeter to area ratio, however over time habitats of this configuration are more susceptible to erosion increasing fragmentation.
adjacent to marshes there is increased diversity and abundance of estuarine fauna compared to isolated seagrass beds. In contrast, our analyses indicated that the amount of seagrass
surrounding a marsh did not have any effect on either species richness or the number of fauna captured at a given site. This suggests the presence of seagrass beds near a marsh may not enhance the function of a salt marsh for nekton and may simply provide habitat corridors for predatory species to move through less conspicuously (Irlandi and Crawford 1997). We did observe a clear relationship between marsh plant shoot density at the edge of the marsh and species richness, specifically as shoot density increased there were more species at a given marsh site. Increased habitat structure has previously been shown to increase species diversity across both terrestrial and aquatic systems (Willson 1974, Gorman and Karr 1978, Le Hir and Hily 2005). For example, the amount of live coral cover in a coral reef directly relates to the number of species and this relationship could be due to increased refuge or food resources among sites with increased habitat structure at the local scale (Bell and Galzin 1984, Roberts and Ormond 1987, Gratwicke and Speight 2005). Since, we did not observe an increase in total abundance or diversity with increased habitat structure (e.g. shoot density), we focused on landscape-scale factors for further analyses.
construct simple and easily usable mechanistic models to better predict the outcome of restoration and conservation practices.
Acknowledgements
We would like to thank M. Benavides, B. Ertel, D. Keller, R. Mahoney, L. Olmo, F. Peay, A. Poray, and C. Spear for valuable assistance in the field. Thanks to Dr. Steve Fegley and Dr. James Umbanhowar for discussion and key statistical advice that strengthened this
REFERENCES
Able, K. W., D. N. Vivian, G. Petruzzelli, and S. M. Hagan. 2012. Connectivity Among Salt Marsh Subhabitats: Residency and Movements of the Mummichog (Fundulus
heteroclitus). Estuaries and Coasts 35:743–753.
Airoldi, L., D. Balata, and M. W. Beck. 2008. The Gray Zone: Relationships between habitat loss and marine diversity and their applications in conservation. Journal of Experimental Marine Biology and Ecology 366:8–15.
Akaike, H. 1987. Factor Analysis and AIC. Pages 371–386 in E. Parzen, K. Tanabe, and G. Kitagawa, editors. Selected Papers of Hirotugu Akaike. Springer, New York, NY. Alroy, J. 2017. Effects of habitat disturbance on tropical forest biodiversity. Proceedings of the
National Academy of Sciences 114:6056–6061.
Baillie, C. J., J. M. Fear, and F. J. Fodrie. 2014. Ecotone Effects on Seagrass and Saltmarsh Habitat Use by Juvenile Nekton in a Temperate Estuary. Estuaries and Coasts:1–17. Baker, R., M. Sheaves, and R. Johnston. 2015. Geographic variation in mangrove flooding and
accessibility for fishes and nektonic crustaceans. Hydrobiologia:1–14.
Bates, D., M. Maechler, B, Bolker, and S. Walker 2015. Fitting linear mixed effects models using lme4. Journal of Statistical Software, 67:1-48. doi:10.18637/jss.v067.i01. Bell, J. D., and R. Galzin. 1984. Influence of live coral cover on coral-reef fish communities.
Marine Ecology Progress Series 15:265–274.
Boström, C., S. Pittman, C. Simenstad, and R. Kneib. 2011. Seascape ecology of coastal biogenic habitats: advances, gaps, and challenges. Marine Ecology Progress Series 427:191–217.
Breiman, L., J. Friedman, C. J. Stone, and R. A. Olshen. 1984. Classification and Regression Trees. Taylor & Francis.
Dobson, A., D. Lodge, J. Alder, G. S. Cumming, J. Keymer, J. McGlade, H. Mooney, J. A. Rusak, O. Sala, V. Wolters, D. Wall, R. Winfree, and M. A. Xenopoulos. 2006. Habitat Loss, Trophic Collapse, and the Decline of Ecosystem Services. Ecology 87:1915–1924. Engelhardt, K. A. M., and M. E. Ritchie. 2001. Effects of macrophyte species richness on
wetland ecosystem functioning and services. Nature 411:687–689.
Field, C., J. Osborn, L. Hoffman, J. Polsenberg, D. Ackerly, J. Berry, O. Björkman, A. Held, P. Matson, and H. Mooney. 1998. Mangrove biodiversity and ecosystem function. Global Ecology & Biogeography Letters 7:3–14.
Gorman, O. T., and J. R. Karr. 1978. Habitat Structure and Stream Fish Communities. Ecology 59:507–515.
Grabowski, J. H., R. D. Brumbaugh, R. F. Conrad, A. G. Keeler, J. J. Opaluch, C. H. Peterson, M. F. Piehler, S. P. Powers, and A. R. Smyth. 2012. Economic Valuation of Ecosystem Services Provided by Oyster Reefs. BioScience 62:900–909.
Gratwicke, B., and M. R. Speight. 2005. The relationship between fish species richness,
abundance and habitat complexity in a range of shallow tropical marine habitats. Journal of Fish Biology 66:650–667.
Haddad, N. M., L. A. Brudvig, J. Clobert, K. F. Davies, A. Gonzalez, R. D. Holt, T. E. Lovejoy, J. O. Sexton, M. P. Austin, C. D. Collins, W. M. Cook, E. I. Damschen, R. M. Ewers, B. L. Foster, C. N. Jenkins, A. J. King, W. F. Laurance, D. J. Levey, C. R. Margules, B. A. Melbourne, A. O. Nicholls, J. L. Orrock, D.-X. Song, and J. R. Townshend. 2015. Habitat fragmentation and its lasting impact on Earth’s ecosystems. Science Advances
1:e1500052.
Irlandi, E. A., and M. K. Crawford. 1997. Habitat linkages: the effect of intertidal saltmarshes and adjacent subtidal habitats on abundance, movement, and growth of an estuarine fish. Oecologia 110:222–230.
Johnston, R. J., G. Magnusson, M. J. Mazzotta, and J. J. Opaluch. 2002. Combining Economic and Ecological Indicators to Prioritize Salt Marsh Restoration Actions. American Journal of Agricultural Economics 84:1362–1370.
Lasiak, T. 1984. Structural aspects of the surf-zone fish assemblage at King’s Beach, Algoa Bay, South Africa: Short-term fluctuations. Estuarine, Coastal and Shelf Science 18:347–360. Layman, C. A. 2000. Fish Assemblage Structure of the Shallow Ocean Surf-Zone on the Eastern
Shore of Virginia Barrier Islands.
Le Hir, M., and C. Hily. 2005. Macrofaunal diversity and habitat structure in intertidal boulder fields. Biodiversity & Conservation 14:233.
Levin, L., D. M. Talley, and G. Thayer. 1996. Succession of macrobenthos in a created salt marsh. Marine Ecology Progress Series 141:67–82.
MacArthur, R. H., and E. O. Wilson. 2001. The Theory of Island Biogeography.
Maiorano, L., A. Falcucci, and L. Boitani. 2008. Size-dependent resistance of protected areas to land-use change. Proceedings of the Royal Society B: Biological Sciences 275:1297– 1304.
McNeill, S. E., and P. G. Fairweather. 1993. Single Large or Several Small Marine Reserves? An Experimental Approach with Seagrass Fauna. Journal of Biogeography 20:429–440. Meyer, D. L., and M. H. Posey. 2014. Influence of Salt Marsh Size and Landscape Setting on
Salt Marsh Nekton Populations. Estuaries and Coasts 37:548–560.
Micheli, F., M. J. Bishop, C. H. Peterson, and J. Rivera. 2008. Alteration of Seagrass Species Composition and Function Over Two Decades. Ecological Monographs 78:225–244. Minello, T. J., L. P. Rozas, and R. Baker. 2011. Geographic Variability in Salt Marsh Flooding
Patterns may Affect Nursery Value for Fishery Species. Estuaries and Coasts 35:501– 514.
Moussaoui, A., and P. Auger. 2015. Simple fishery and marine reserve models to study the sloss problem. ESAIM: Proceedings and Surveys 49:78–90.
Opdam, P., and D. Wascher. 2004. Climate change meets habitat fragmentation: linking landscape and biogeographical scale levels in research and conservation. Biological Conservation 117:285–297.
Pessanha, A. L. M., and F. G. Araújo. 2003. Spatial, temporal and diel variations of fish
assemblages at two sandy beaches in the Sepetiba Bay, Rio de Janeiro, Brazil. Estuarine, Coastal and Shelf Science 57:817–828.
Peterson, G. W., and R. E. Turner. 1994. The value of salt marsh edge vs interior as a habitat for fish and decapod crustaceans in a Louisiana tidal marsh. Estuaries 17:235–262.
Raposa, K. B., S. Lerberg, C. Cornu, J. Fear, N. Garfield, C. Peter, R. L. J. Weber, G. Moore, D. Burdick, and M. Dionne. 2018. Evaluating Tidal Wetland Restoration Performance Using National Estuarine Research Reserve System Reference Sites and the Restoration
Performance Index (RPI). Estuaries and Coasts 41:36–51.
Roberts, C. M., and R. F. G. Ormond. 1987. Habitat complexity and coral reef fish diversity and abundance on Red Sea fringing reefs. Marine Ecology Progress Series 41:1–8.
Roscher, C., V. M. Temperton, M. Scherer‐Lorenzen, M. Schmitz, J. Schumacher, B. Schmid, N. Buchmann, W. W. Weisser, and E.-D. Schulze. 2005. Overyielding in experimental grassland communities – irrespective of species pool or spatial scale. Ecology Letters 8:419–429.
Strange, E., H. Galbraith, S. Bickel, D. Mills, D. Beltman, and J. Lipton. 2002. Determining Ecological Equivalence in Service-to-Service Scaling of Salt Marsh Restoration. Environmental Management 29:290–300.
Tilman, D., J. Knops, D. Wedin, P. Reich, M. Ritchie, and E. Siemann. 1997. The Influence of Functional Diversity and Composition on Ecosystem Processes. Science 277:1300–1302. Tjørve, E. 2010. How to resolve the SLOSS debate: Lessons from species-diversity models.
Journal of Theoretical Biology 264:604–612.
Willson, M. F. 1974. Avian Community Organization and Habitat Structure. Ecology 55:1017– 1029.
Yeager, L. A., D. A. Keller, T. R. Burns, A. S. Pool, and F. J. Fodrie. 2016. Threshold effects of habitat fragmentation on fish diversity at landscapes scales. Ecology 97:2157–2166. zu Ermgassen, P. S. E., M. D. Spalding, B. Blake, L. D. Coen, B. Dumbauld, S. Geiger, J. H.
TABLES
Table 1.1 Information for each site including study ID, region, assigned marsh type, latitude, longitude, area (m2), perimeter length (m), distance to landward edge (m), edge to area ratio, and
percent seagrass surrounding the islands.
Site ID Region Island type Latitude Longitude Island area Edge Distance landward Edge:Area ratio Percent seagrass
BA1 Back sound large island 34.719722 -76.585278 37,005 2,105 - 0.0569 0.137
BA2 Back sound small island 34.706944 -76.6 430 88 - 0.2047 0.055
BA3 Back sound medium island 34.696944 -76.631944 6,610 500 - 0.0756 0.077
BA4 Back sound small mainland 34.721667 -76.636111 - - 45 -
-BA5 Back sound large mainland 34.715833 -76.619722 - - 348 -
-BA6 Back sound medium island 34.7247665 -76.619884 8,053 506 - 0.0628 0.25
BO1 Bogue sound large island 34.683056 -76.999722 31,950 963 - 0.0301 0.305
BO2 Bogue sound medium island 34.678889 -76.996667 6,553 543 - 0.0829 0.119
BO3 Bogue sound small island 34.676111 -76.996389 863 135 - 0.1564 0.03
BO4 Bogue sound large mainland 34.671944 -77.008611 - - 263 -
-BO5 Bogue sound small mainland 34.675 -76.983889 - - 61 -
-BO6 Bogue sound small island 34.675833 -77 1,119 151 - 0.1349 0.128
CS1 Core Sound large island 34.679167 -76.499722 30,181 947 - 0.0314 0.594
CS2 Core Sound medium island 34.6827943 -76.611763 9,338 623 - 0.0667 0.11
CS3 Core Sound small island 34.666667 -76.509722 317 82 - 0.2587 0.21
CS4 Core Sound small.main 34.646667 -76.508333 - - 140 -
-CS5 Core Sound large mainland 34.685556 -76.483611 - - 786 -
Table 1.1 ANOVA results for total catch rates across all marsh island types.
df mean squares F value p
Marsh type 4 5041 4.567 0.0017
Residuals 136 1104 -- --
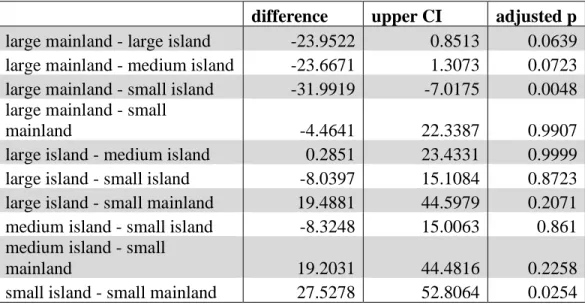
Table 1.2 Tukey HSD pairwaise comparison of means for all marsh types with 95% confidence intervals.
difference upper CI adjusted p
large mainland - large island -23.9522 0.8513 0.0639 large mainland - medium island -23.6671 1.3073 0.0723 large mainland - small island -31.9919 -7.0175 0.0048 large mainland - small
mainland -4.4641 22.3387 0.9907
large island - medium island 0.2851 23.4331 0.9999 large island - small island -8.0397 15.1084 0.8723 large island - small mainland 19.4881 44.5979 0.2071 medium island - small island -8.3248 15.0063 0.861 medium island - small
mainland 19.2031 44.4816 0.2258
FIGURES
Figure 1.1 Diagram explaining the response variables, calculations, study results and proposed mechanisms for each metric used to understand fish and crustacean communities across marsh island sites.
Response variable
Units of
measurement Calculations Study result
Catch rate Total abundance Density CPUE Individuals or # individuals/m2
Number of nekton caught per sampling array divided by time deployed
Catch rate multipled by the number of sampling arrays that fit arround a given
island perimeter
Figure 1.4 Representative figure for quantitative simulations examining the changes in
Figure 1.5 Representative figure for quantitative simulations examining the changes in
CHAPTER 2: DIETARY SHITS ACROSS BIOGEOGRAPHIC SCALES ALTER SPATIAL SUBSIDY DYNAMICS1
Introduction
Complex landscapes are comprised of diverse habitats connected by the movement of fauna over diel, seasonal, and ontogenetic (and additional) cycles. These faunal movements facilitate the flow of energy between systems, often via trophic interactions, playing a key role in ecosystem productivity. The concept of energy movement across systems has influenced many ecological disciplines and there is a trove of terminology encompassing this fundamental dynamic: energy flow, fluxes, spatial subsidies, outwelling, trophic relay, connectivity, f-ratio, allochthonous input, cross-habitat foraging, edge predation, etc. (Eppley and Peterson 1979, Polis and Hurd 1996, Kneib 2002). Concepts of spatial energy flow date back to Lindeman’s seminal work on aquatic ecosystems (1942), which considered changes in food webs through time and external sources that influenced the availability of nutrients in lake habitats. More formally, Teal (1962) introduced the concept of energy flows across spatial boundaries when he elucidated how detritus moved energy out of salt marsh systems to increase productivity
throughout estuarine and coastal ocean habitats. Vannote et al. (1980) proposed the River Continuum Hypothesis suggesting that, along the course of a river, inefficiency of upstream communities to utilize energy provides increased energy resources downstream. More recently, stable isotope analyses have been used to better understand how energy from one ecosystem
enhances another. For example, stable isotopes uncovered that salmon based marine-derived energy allows marten communities to maintain body condition and population levels when traditional prey items are scarce (Ben-David et al. 1997). Additionally, isotopic analysis has shown that energy from inshore seagrass meadows is transferred to offshore waters by migratory coastal fishes (Nelson et al. 2012).
Cross-boundary energy flows occurring at the land-water interface are of particular interest since they can greatly influence overall ecosystem functioning (production and transfer of energy) and dynamics of seemingly disparate systems. Organisms and energy can flow bi-directionally across the land-sea interface (Polis and Hurd 1996) and movement of both predators and prey across these distinct ecological boundaries have been shown to enhance secondary production in adjacent ecosystems (Nakano and Murakami 2001). For example, Brant geese (Branta bernicla) forage directly on seagrass and then move to upland areas transferring marine-derived energy toward terrestrial habitats subsidizing upland regions (Heck et al. 2008). Energy flows that occur across the land-sea interface can extend well beyond neighboring habitats, across large spatial scales, and multiple ecosystems. Pacific salmon gain about 90% of their biomass in marine systems before returning to freshwater systems to spawn (Gende et al. 2002). This migration has been observed to enhance production in aquatic systems upstream and also transfer energy from marine to terrestrial systems via scavenging insects, raptors, and bears foraging upon salmon enhancing overall secondary production (Hansen 1987, Reimchen 2000).
recent studies suggest that these energy pathways are more varied (Deegan 1993, Peterson and Turner 1994, Kneib 1997). One pathway for energy to move from the marsh to estuarine or offshore habitats is through food webs via a series of predator-prey interactions (e.g. trophic transfer or trophic relay; (Kneib 2002)). Energy flow across the marsh ecotone by predator-prey interactions is regulated by the ability of transient marine consumers to access prey items that are typically residents of the marsh platform. This access may be mediated by the ability of predators to move onto the marsh platform during high-water-level periods or by discharge of prey items from the marsh surface into adjacent estuarine habitats during low-water-level periods (prey emergence), which may be arbitrated by both abiotic factors (i.e., tidal regime) or biotic factors (i.e., plant density).
The magnitude and duration of marsh flooding is dictated by astronomical and/or
meteorological forces, and the significance of this hydrology in regulating functional roles of
intertidal marsh habitats for juvenile fishes and crustaceans is recognized (Rozas 1995, Kneib
1997, Connolly 1999). Specifically, at least 5 cm of water must cover the marsh platform for
shrimps, crabs, and small fishes to access the marsh platform (Minello and Rozas 2002, Minello
et al. 2012). Small marsh-associated fishes such as a mummichogs, Fundulus heteroclitus, and California killifish, Fundulus parvipinnis, move onto the marsh platform during flood tide and
retreat to shallow subtidal marsh creeks or marsh-enclosed pools at low tide (Talley 2000, Teo
and Able 2003). Likely in response to tidally driven prey behaviors, predatory juvenile striped
bass Morone saxatalis have been shown during ebb tide to move upstream to marsh creeks to
forage upon prey items that emerge from the marsh as the tide falls (Tupper and Able 2000).
few studies have explicitly examined relationships between hydrodynamics and mobile predatory
fish diets, and implications for overall food web dynamics vis-à-vis trophic relay.
Abiotic forces (e.g. fire, tidal cycles, wind, etc.) along ecotones may also influence habitat structure, and how organisms move into/out of and across habitat boundaries. For instance, higher wind speeds have been shown to disturb habitat structure along the edge of habitats decreasing the efficiency of predators, jostling tree branches decreasing prey visibility and altering olfactory cues (Cherry and Barton 2017). Within salt marsh habitats, the regular inundation by salt water due to tides can alter plant characteristics and the presence of certain types of plant species. For instance, in salt marshes with semi-diurnal tides (>0.75-m range) primary production has been observed to increase as tidal amplitude increases (Steever et al. 1976). Yet, little is known about how other basic marsh habitat characteristics such as plant shoot density vary with tidal amplitude and duration and its influence on nekton access and habitat use across a broader range of tidal regimes.
marsh associated prey in diets of transient fish predators would be positively correlated with tidal height and inversely correlated with marsh plant density.
Materials and Methods
Database assembly for fish diets
To quantify the diets of transient estuarine predators we conducted a literature search using ISI Web of Science between January 2017 – October 2017 adopting the following keyword searches: “marsh” AND “[geographic region]” AND “[trophic data]” AND “[predator species].” Geographic regions included: 1) Gulf of Mexico (GoM), 2) South Atlantic (SA), and 3) Mid-Atlantic (MA). For our analyses, we designated the Gulf of Mexico as Texas to southwest
Florida, the South Atlantic as southeast Florida to North Carolina, and the Mid-Atlantic region as Virginia to southern New York (south of Long Island Sound). Our trophic data search
parameters included 1) diet, 2) gut content, or 3) food webs. Predator species included: 1) red drum, Sciaenops ocellatus, 2) spotted seatrout, Cynoscion nebulosus, 3) bluefish, Pomatomus saltatrix, 4) striped bass, Morone saxatilis, and 5) flounders, Paralichthys spp. Predatory species were selected due to known utilization of marsh habitat for foraging during the estuarine portion of their life cycle (e.g. Dance and Rooker 2015). Predators had to be present within and have diet information for at least 2 of 3 regions of interest. We found data for red drum (stomach N=1814) and spotted seatrout (stomach N=670) in the GoM and SA; we found striped bass (stomach N=3699) data in the SA and MA; finally, we collected flounders (stomach N=557) and bluefish (stomach N=3493) data for all three regions.
We collected data on all prey species consumed by predatory species, however for the majority of analyses, we focused on two main prey types in diets of transient predators to
killifish Fundulus grandis, Mummichog Fundulus heteroclitus, Striped killifish Fundulus majalis, Longnose killifish Fundulus similis; Rainwater killifish Lucania parva, Sheepshead minnow Cyprinodon variegatus, and Sailfin molly Poecilia latipinna) and fiddler crabs (Red-jointed fiddler crab, Uca minax, Sand fiddler crab, Uca pugilator, and Atlantic marsh fiddler crab, Uca pugnax). Both killifishes and fiddler crabs (marsh-platform species) are numerically dominant, closely associated with the marsh platform and adjacent tidal creeks, typically share similar trophic levels, and therefore were grouped for analyses. Additionally, these species obtain a large amount (up to 80%) of their energy resources directly from Spartina alterniflora primary production (Baker et al. 2013) and marsh-platform benthic microalgae (Currin et al. 2003). In comparison, species such as grass shrimps (Palaemonetes sp.), penaeid shrimps, (Farfantepenaeus sp.) and blue crabs (Callinectes sapidus) utilize the marsh platform; however, they are also found across many estuarine habitats and cannot be reliably identified as marsh-platform residents. Simply, predatory species must either directly access the marsh marsh-platform to forage on marsh-platform residents, or these prey species must be flushed off the marsh platform at low tide (prey emergence) to be present in predator diets, and therefore represent key proxies of energy transfer from the marsh to the estuary (i.e., trophic transfer).
used across papers among the three geographic regions (25 of 56 papers inspected, 10,233 stomachs analyzed; see Dance & Rooker, 2015). Based on interrogation of N, FO, V, and W data, we note that our primary conclusions were robust across metrics (Table 2.1). A map of fish collection sites and a list of data sources used in the study are provided in the data sources section of the supporting information (Figure 2.1).
Literature search for environmental characteristics
To understand how marsh environmental characteristics differed across geographic regions, we conducted a literature search in ISI Web of Science using the following keyword searches: “marsh” AND “[geographic region]” AND “[“marsh characteristic”].” Geographic regions included: 1) GoM, 2) SA, and 3) MA. Marsh habitat characteristics included: 1) shoot density, 2) shoot height, and 3) biomass. Additionally, we gathered marsh characteristic data using habitat monitoring programs from the National Estuarine Research Reserves (NERRs), which was able to provide data from Florida, Maryland, New Jersey, and North Carolina. We considered shoot density, shoot height, and total biomass as biotic characteristics of the marsh that may alter nekton access, prey refuge, and food availability for transient predators and were averaged across geographic region. We aggregated data over multiple sites and dates to best characterize marshes within a given region and time period.
Tidal data acquisition
tidal amplitude across large scale gradients. We used the mean tidal range value for each site as a proxy for the average tidal amplitude and the periodicity of marsh flooding. According to
Minello et al. (2012), marshes along the East Coast of the US with high tidal amplitude had the highest flooding frequency and the lowest flooding duration, while Gulf of Mexico marshes had comparatively low amplitude, low flooding frequency, and the longest flooding durations. Statistical Analyses
To elucidate differences in biogenic habitat structure broadly across geographic regions we serially employed a Kruskal-Wallis test for shoot density, shoot height, and combined above- and below-ground biomass. For more in depth habitat analyses, we focused on the parameter of shoot density. Shoot height and total plant biomass (above- and below-ground) may not be as relevant to predator-prey interactions as density, which may have a greater influence on both predator access and/or movement and prey refuge. Several studies in seagrass habitats, show that beyond a certain threshold of shoot density, predation success is significantly diminished due to increased structure for prey to hide among (reviewed by Heck & Orth 2006). We assessed the relationships between marsh plant shoot density and tidal amplitude, and marsh plant shoot density and the frequency of occurrence of marsh platform species in predatory fish diets using linear regression.
To assess the differences in diet composition of transient estuarine predators among regions (including all prey species; e.g. blue crabs Callinectes sapidus, brown shrimp
Results
The frequency of occurrence of marsh platform species in the diets of estuarine predators was greatly affected by geographic region (H=8.67, p=0.01; Table 2.2). Marsh platform species were rarely present in the diets of estuarine predators in the Gulf of Mexico (0.10 FO +/- 0.10 but marsh-platform fishes and fiddler crabs appear regularly (an order-of-magnitude greater than the GoM) in predatory fish diets in the South Atlantic (1.35 FO +/- 0.83) and Mid-Atlantic regions (3.55 FO +/-1.23; Figure 2.2). For each region, the maximum FO for marsh platform species in the diets of transient fishes was 2.9 in the GoM, 8.91 in the SA, and 16.0 in the MA. The maximum FO observed across all predator/studies for all prey items in each region were 57.0 (striped mullet Mugil cephalus) in the GoM, 51.8 (menhaden Brevoortia spp.) in the SA, and 43.7 (sand shrimp Crangon spp.) in the MA.
Mean tidal range was distinct among the 3 regions (H=25.57, P<0.001). The mean tidal range was greater in both the SA (1.15 m +/- 0.14) and the MA (1.02 m +/- 0.13) regions than the GoM (0.39 m +/- 0.02; Fig 2.3A). The presence of marsh platform species in estuarine fish diets was correlated with mean tidal range (Χ2=38.03, P<0.001; Table 2.3, Fig 2.4A). Notably,
there appeared to be a threshold at approximately 1 m in tidal range where the presence of marsh platform species began to manifest regularly in the diets of transient estuarine predatory fishes.
There was a significant difference in shoot density (H=531.97, P<0.001; Fig 2.3B), shoot height (H=15.32, P=0.001), and plant biomass (H=44.23, P<0.001) among geographic regions. The SA region had the highest shoot density (203.89 shoots/m2 +/- 6.40), the GoM had
intermediate shoot density (117.15 shoots/m2 +/- 14.50) and the MA had the lowest shoot density
(R2=0.185, P<0.001; Table 2.4, Fig 2.3C) and the frequency occurrence of marsh platform
species (R2=0.011, P=0.009; Table 2.5, Fig 2.4B).
Geographic region was a significant predictor for differences among estuarine predator diet composition (F2,42=1.76, R2=0.077, P=0.026, Table 2.6). A two-dimensional axis was
utilized for NMDS ordinations with a stress of 0.12. Geographic region was more predictive of diet composition than species identity of estuarine predators (Fig 2.5). The differences in diet composition of estuarine predators across regions were driven by the presence or absence of marsh-platform species, indicating that these prey items are significant components in diets of predatory fishes although rating relatively modest FO values. Portunid crabs (e.g., blue crabs), penaeid shrimps (e.g., brown shrimp), and microinvertebrates (e.g., amphipods) were other species that drove differences in diet structure among regions.
Discussion
Our synthesis, encompassing multiple estuarine taxa across three biogeographic
—along all coasts—move into the marsh, obtain terrestrial derived-energy, and link that directly to the estuary or open ocean.
Hotspots for primary productivity, such as areas of upwelling or high plant biomass (e.g. mangroves, salt marshes, rainforests), are generally expected to export energy into adjacent systems (Polis et al. 1997, Heck et al. 2008). Cross-habitat movements by consumers and prey can be a key conduit for this energy flow, and thus greatly affect resource dynamics at several spatial scales across terrestrial, aquatic, and marine systems. Few examples, however, document how these movements and energy flows vary across environmental gradients or large geographic scales (Lafage et al. 2019, exception Baker et al. 2013). Our results suggest that patterns of outwelling of energy from marsh habitats via trophic relay is variable across regions, ultimately driven by physical (tidal) gradients. Broadly along ecotones, changes in physical variables such as temperature, wind, or wave action may influence cross-habitat foraging and spatial subsides. For example, increased riverine discharge (resulting from high precipitation) has been show to alter food chain length and result in exportation of more aquatic subsidies to downstream communities (Sabo et al. 2010).
crabs) as opposed to marsh-platform residents, or (3) indirect trophic linkages drive outwelling of marsh energy.