DEVELOPMENT OF PROSPECTIVE GATING IN STATIONARY DIGITAL CHEST TOMOSYNTHESIS USING A CARBON NANOTUBE X-RAY SOURCE
ARRAY
Allison Etta Hartman
A dissertation submitted to the faculty of the University of North Carolina at Chapel Hill in partial fulfillment of the requirements for the degree of Doctor of Philosophy in the
Department of Physics.
Chapel Hill 2017
Approved by:
Tamara Branca
Hugon Karwowski
David Lalush
Yueh Lee
Jianping Lu
ABSTRACT
Allison Etta Hartman: Development of prospective gating in stationary digital chest tomosynthesis using a carbon nanotube x-ray source array
(Under the direction Otto Zhou)
Purpose: To quantify the benefit of prospectively gated stationary digital chest tomosynthesis
(Gs-DCT) using a carbon nanotube (CNT) x-ray source array in a free breathing porcine study.
Methods: The Gs-DCT x-ray system consists of a linear x-ray array tube (80kVp, 0.125mAs per
projection for 29 projections over a 12◦angular span) and a flat panel detector (5 fps). Imaging was
performed on an anesthetized, free-breathing 13.5kg pig. A respiratory trace was acquired through
a transducer belt around the thorax. Each gated projection image was acquired at the temporal
coincidence of the detector integration time and the peak inhalation of the pig. The projection
images were reconstructed using iterative reconstruction with a 2mm slice thickness using iterative
reconstruction. Image blur was assessed as the reproduction of the diaphragm in the reconstructed
images. Respiratory phase timing quality was assessed through cross-correlation analysis.
Results: Animal respiration rate was 24.3±3.5bpm. The scan time for the gated scan was 86.9s±2.9s compared to the un-gated scanning time 6.3±.6s. An entrance dose of 0.4mSv was used. The blur in the reproduction of the diaphragm in the reconstructed images for gated study was 1.8±
0.5mm where in the un-gated case the diaphragm was 2.6±0.6 mm. The average cross correlation coefficient between of the respiratory trace at the time of the x-ray pulse was .91±.02 for the gated scan and .11±.01 for the un-gated scan.
Conclusions: Prospective gated imaging significantly reduced the motion blur, substantially
improving the image quality of the tomosynthesis images. The CNT based x-ray sources enable
precise x-ray pulse generation on demand. If enabled clinically, the Gs-DCT system could potentially
obtain 3D image stacks in patients that are unable to hold their breaths, such as the pediatric or
ACKNOWLEDGEMENTS
First and foremost, I would like to thank Dr. Hugon Karwowski for his advice, guidance, and
encouragement throughout this project. I am greatly appreciative to my dissertation advisor, Dr.
Zhou. I am thankful to Dr. Lee for making me more resilient and to Dr. Lu for helping me develop
new ideas to solve problems. I appreciate Dr. David Lalush and Dr. Tamara Branca for serving on
my committee and asking insightful questions throughout meetings and presentations. I would like
to thank past and present group members including Taylor Gunnel, Connor Puett, Jabari Calliste,
Pavel Chtcheprove, Christy Inscoe, Gongting Wu, Lei Zhang, Jing Shan, and Soha Bazyar for their
camaraderie and support.
I would like to thank the amazing educators at the Northfield Mount Hermon School. I would
not be here without the patience of Jeanne Reese and the dorm leaders of Mackinnon. I am thankful
for the support of my amazing family throughout my education. I would like to thank my Bubby,
Janet Hartman, for always believing in me. I am thankful to my Granddad for supporting me through
the College of the Holy Cross and for pushing me to be a better person. I am thankful to my Auntie
Mardie Hinkley fostering a love of learning in me and for being a great role model. I am grateful to
my Auntie Mary Blanchette for all of her great advice throughout graduate school.
I am grateful for my physics cohort, including Rohan Isaac and Jamin Rager, for so many fun
times and for keeping me sane. I am thankful to Jessie Barrack, Ana Doblas, Ben Mu˜noz, Gulfo and
Luke for their constant love and support.
I am extremely grateful to my parents who gave me the best education they could find and for
being so supportive of my crazy endeavors.
Most of all, I am thankful for the constant love, support, and patience from Scott Ravyts. I would
TABLE OF CONTENTS
LIST OF TABLES . . . x
LIST OF FIGURES . . . xi
LIST OF ABBREVIATIONS . . . xv
1 Introduction . . . 1
1.1 Overview . . . 1
1.2 Specific research aims . . . 2
1.2.1 Research Aim 1 . . . 2
1.2.2 Research Aim 2 . . . 2
1.2.3 Research Aim 3 . . . 3
1.3 Dissertation organization . . . 3
2 X-ray imaging for medical purposes . . . 4
2.1 Introduction. . . 4
2.2 Conventional X-ray generation . . . 4
2.2.1 Bremsstrahlung radiation . . . 5
2.2.2 Limitations of conventional X-ray sources . . . 6
2.3 Carbon Nanotube X-ray generation . . . 8
2.3.1 Motivation . . . 8
2.3.2 Field Emission . . . 8
2.3.3 CNT Field Emission . . . 9
2.4 Components of a CNT X-ray source . . . 9
2.4.1 Limitations of CNT X-ray source . . . 11
2.6 X-ray Image formation and quality assessment . . . 14
2.6.1 X-ray Attenuation . . . 14
2.6.2 X-ray Detectors . . . 16
2.6.3 Image Quality Parameters . . . 16
2.7 Key factors in gating . . . 17
2.7.1 Introduction to gating . . . 17
2.7.2 Applications of gating . . . 19
3 Research Aim 1: Create clinical prototype of s-DCT . . . 21
3.1 Introduction. . . 21
3.2 Motivation . . . 21
3.3 Materials and methods for non-gated s-DCT system . . . 22
3.3.1 System overview . . . 22
3.3.2 s-DCT x-ray source . . . 23
3.3.3 Detector . . . 26
3.3.4 System resolution . . . 27
3.3.5 System monitoring and control . . . 28
3.3.6 Reconstruction of tomosynthesis images . . . 29
3.3.7 Patient Population . . . 31
3.4 Dose delivered to patients . . . 32
3.4.1 CXR and CT images . . . 34
3.4.2 Image quality evaluation for the CF trial . . . 34
3.5 Results . . . 34
3.5.1 Overall patient imaging . . . 34
3.5.2 CF Study results . . . 35
3.5.3 LN Study results . . . 36
3.6 Discussion . . . 38
4 Research Aim 2: Creation of the Gs-DCT system . . . 41
4.1 Introduction. . . 41
4.2 Materials . . . 42
4.2.1 System overview . . . 42
4.2.2 Detector . . . 42
4.2.3 System resolution . . . 44
4.2.4 Physiological system monitoring . . . 44
4.3 Results . . . 46
4.3.1 X-ray triggering system . . . 46
4.3.2 Image saving . . . 47
4.3.3 Logical workflow . . . 49
4.4 Conclusions. . . 55
5 Research Aim 3: Quantify the benefit the Gs-DCT system . . . 56
5.1 Introduction. . . 56
5.2 Methods . . . 56
5.2.1 Imaging . . . 56
5.2.2 Image analysis . . . 56
5.3 Results . . . 59
5.3.1 Imaging . . . 59
5.3.2 Breath correlation . . . 60
5.3.3 Image quality . . . 60
5.4 Discussion and conclusion . . . 61
5.4.1 Physiological . . . 61
5.4.2 Image Quality . . . 61
5.4.3 Correlation . . . 64
5.4.4 Exhalation gating . . . 64
5.5 Limitations . . . 67
5.6 Conclusions and future work . . . 67
6 Summary and Future Directions . . . 69
6.1 Summary . . . 69
6.2 Future Directions . . . 69
LIST OF TABLES
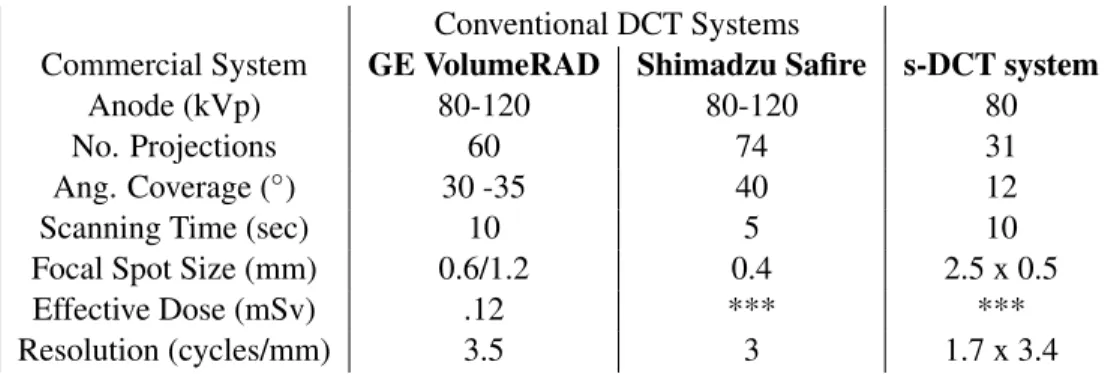
3.1 A comparison between two commercial DCT systems and the s-DCT system. (Dobbins et al., 2008a; Vikgren et al., 2008; B˚ath et al., 2010; Li
et al., 2008; Yamada et al., 2011) . . . 23
LIST OF FIGURES
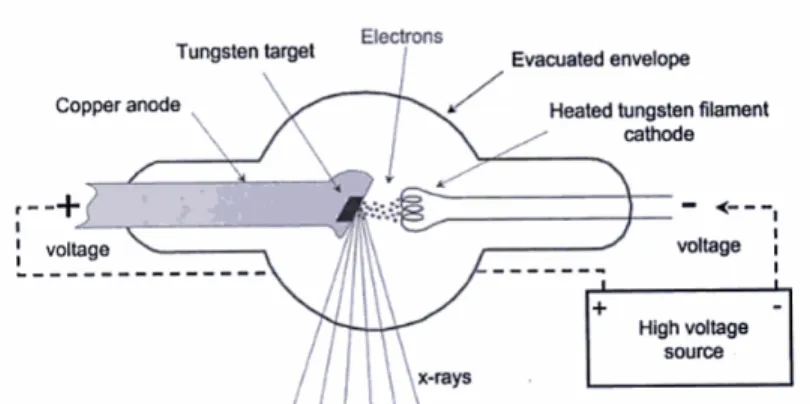
2.1 A schematic of a conventional X-ray tube. The right hand side shows the heated tungsten filament emitting electrons towards the anode. (Bushberg,
Jerrold T. , Seibert, J. Anthony, Leidholdt, Edwin Jr, Boone, 2002) . . . 6
2.2 This spectra shows the probability of each energy being output from the X-ray source due to Bremsstrahlung radiation with a low energy filter such as aluminum. (Bushberg, Jerrold T. , Seibert, J. Anthony, Leidholdt,
Edwin Jr, Boone, 2002) . . . 7
2.3 A schematic showing the Fermi energy within the metal cathode is lower than the vacuum potential. The difference in energy is known as the work function, (φ). By applying a strong electric field, the tunneling distance is
reduced and electrons can escape the cathode. (Hamanaka et al., 2013) . . . 9
2.4 The left side shows a schematic for a CNT X-ray source. The molybdenum substrate is coated in CNTs. A positive bias is applied to the gate allowing for electron field emission from the CNTs. The electrons are then focused and collide with the anode. X-rays are produced at a 90◦ angle to the
incident electrons.(Zhou and Calderon-Colon, 2010) . . . 10
2.5 A photo of the MRT experimental setup for small animal imaging.(Zhang
et al., 2014) . . . 12
2.6 (a) A schematic for the s-DBT system showing the multiple CNT X-ray sources illuminating the whole detector (b) A photo of the s-DBT system
installed in the UNC hospitals for clinical trial.(Tucker et al., 2013) . . . 13
2.7 A photo of the Micro CX-rayT system setup for small animal imaging.
(Cao et al., 2010) . . . 13
2.8 This graph shows the mass attenuation dependence on the energy of the photons passing through it. Mass attenuation coefficient is the attenuation coefficient of a material,µdividend by the mass density of that material ρ as function of X-ray energy. The contrast of an X-ray image comes from the difference in attenuation between anatomical features. This graph shows that fat and soft tissue have similar attenuations around 80 keV, therefore, it would be harder to distinguish between those two structures
in an X-ray image. (Seibert, J. Anthony, Boone, 2005) . . . 15
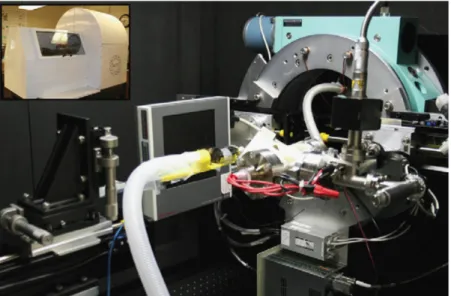
3.1 A photo of the clinical configuration of the s-DCT system. The CNT x-ray source array is covered and mounted above the bed. The electronics rack holds the equipment to monitor and drive the system. The flat panel
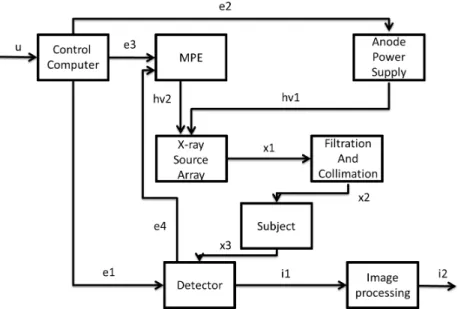
3.2 The topology of the s-DCT system. u- User setup of control computer, e1-initiation of the detector, e2-e1-initiation of anode power supply, hv1- apply high voltage on the x-ray source array, e3- initiation of MPE after hv1 reach the targeted voltage, e4 - Trigger to MPE for x-ray pulses, e5- After signal e4, the pulse train is sent to the Control Computer and Cathode Switching System. Each pulse represents a single detector acquisition, hv2 - Each signal in the pulse train will activate the Cathode Switching System and apply a voltage to the corresponding cathode which produces a current, x1 xrays are produced during each pulse of the cathodes., x2 -x-rays are filtered, x3 - X-rays interact with the object that is in the field of view of the detector, i1 - A raw image is produced for each pulse, i2 - Raw
images are processed and reconstructed on a secondary computer. . . 24
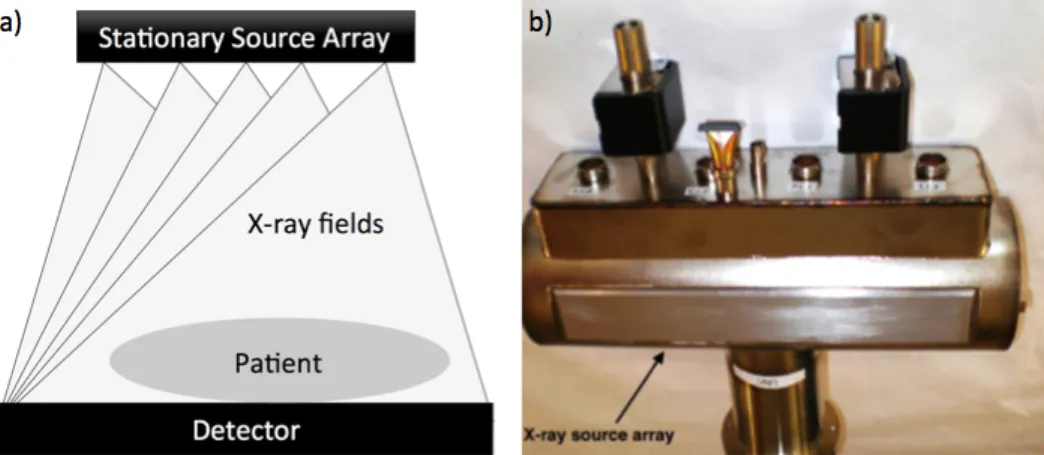
3.3 (a) The schematic for the s-DCT x-ray source array. Each pixel of the x-ray source illuminates the entire detector field, allowing for a complete tomosynthesis scan with no mechanical motion. (b) The x-ray tube used in this experiment. It is 29cm long with 75 cathodes. The collimation is
placed parallel to the x-ray window shown here. . . 25
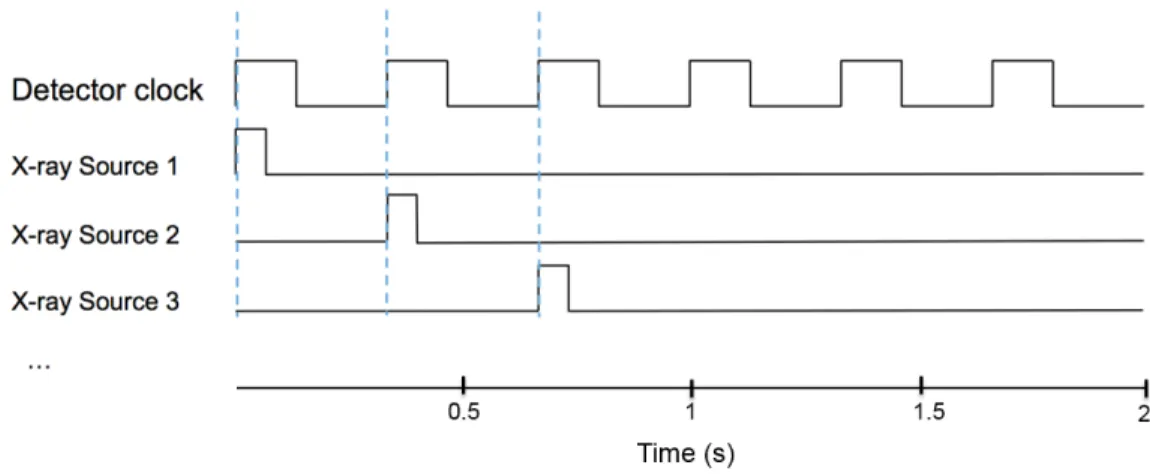
3.4 A Schematic timing diagram of the triggering system. When the detector clock is high, the detector is integrating, when the detector clock is low, the detector is reading out the image. The x-ray sources are triggered at
the rising edge of the detector clock. . . 26
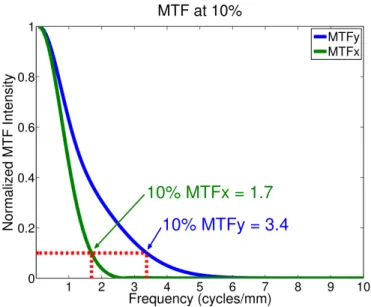
3.5 The MTF plot of the s-DCT system.(Shan et al., 2013) . . . 27
3.6 A flow chart for patient imaging in the s-DCT system.(Shan, 2015) . . . 30
3.7 CAD drawing of the geometry calibration phantom. Four tungsten bars were placed perpendicular to the acrylic layer. Each acrylic plate had four
metal beads embedded inside.(Shan, 2015) . . . 31
3.8 The relationship between the pulse width delivered and the entrance dose to the patient. The adult protocol assumes a chest height of 24.5cm. The
pediatric protocol assumes a chest height of 17cm. . . 33
3.9 A clinical CXR upright PA chest radiograph. The magnified region shows
some linear markings . . . 36
3.10 Reconstructed image slices from the s-DCT system for patient 2. The most anterior image is (a) while (c) is the most posterior image. Each slice represents a different depth in the patient. (a) The heart is in plane. This is depicted by the sharp heart edge. (b) The vasculature from the middle of the lung is in plane. Linear markings are shown in the insert. (c) The
spine and the posterior ribs are in plane. . . 37
3.11 Images of a lung nodule study patient. (a) a slice from the tomosynthesis. The arrow is pointing to a small lung nodule about 5.4mm in diameter (b)
4.1 The detector connection scheme. The x-rays are input on the flat panel detector and transmitted over a fiber optic cable to the command processor. The command processor supplies power to the detector and transmit data to the customer system. In this case, the customer system is the computer with BitFlow card. The x-ray control interface is ViVa software provided
by Varian. (Image from the Varian 4030X detector manual) . . . 44
4.2 The MTF functions for in the scanning and anti-scanning directions. 10% of the MTF was reported as the resolution for the system. The scanning
direction is 2.11±0.06 line/mm and perpendicular is 2.83±0.08line/mm . . . 45
4.3 The LabVIEW code that creates the acquisition window signal. The acquisition signal is made by a series of pulses. Each pulse is a truncated
version of the detector signal. . . 48
4.4 Triggering scheme for the Gs-DCT system. This system shows the trun-cation of the detector signal to create the acquisition signal. The Bio-Vet transformer takes the analog RSP signal and uses a threshold to create the RSP trigger. Then, when there is temporal coincidence between the RSP trigger and acquisition window, an x-ray is fired. Image adapted from (Cao
et al., 2010) . . . 49
4.5 This module of LabVIEW code is responsible for system shutdown, image
saving synchronization and converting patient size into scout image mAs. . . 50
4.6 This LabVIEW module is responsible for reading in the images from the BitFlow card. There are two cases for reading in images: scout images and tomosynthesis images. For the scout images, the image is displayed and the tomosynthesis pulse width is calculated. For the tomo images, the
images are saved to the correct folder and not displayed. . . 51
4.7 The front panel to the Gs-DCT system software. . . 53
4.8 The main logic for the Gs-DCT system. First, the signals are initiated by setting up the Bio-Vet computer, initializing the detector, and establishing a connection to the x-ray source. Then the patient is positioned and the Bio-Vet sensor is attached. After the patient is checked-in, the scout image subroutine logic is entered. The patient position is then checked. Finally
the tomo subroutine logic is entered. . . 53
4.9 The scout image subroutine is presented here. First, the anode is raised and the MPE is initialized. Then, when the user is ready for patient imaging, the user turns ’imaging on’ TRUE. Then, the signals are read into the AND gate. The middle x-ray source is triggered when there is temporal coincidence. The next image on the BitFlow card is saved. The image is displayed for the user to select the region of interest. The mean ROI is
4.10 In the tomo logic, the anode is raised and the MPE is initialized to fire each x-ray source one time. The user then turns the ’imaging on’ TRUE. Then, the MPE fires one x-ray source at the temporal coincidence of all of the signals. After each x-ray source is triggered, the next image to reach the BitFlow card is saved. This is repeated until all 29 sources have been
triggered. Then, the anode is lowered and the program ends. . . 54
5.1 Step 1.Blue line is the pressure on the chest strap, this is graphed to create the RSP trace. The x-ray pulse is overlaid (vertical line) and shows where the x-ray pulse was fired during the breath. Step 2. The teal box represents the .5s before the x-ray pulse and the .5s after the pulse. This is used to create a snippet of the breath captured during the breath cycle. Since there were 29 x-rays fired, 29 breath snippets are made. Step 3.The snippets of breath are overlaid, the pressure value of each time point is average together, this creates an average breath, shown in Step 4. The blue shows the average breath captured by the x-ray pulse during the scan. The red
shows the standard deviation of the RSP traces through the breaths. . . 58
5.2 (a) The RSP trigger (red) is fixed in the TRUE position for the un-gated study. Therefore, the X-ray triggers (yellow) in every detector acquisition window (not shown) regardless of the breath phase (blue). (b) The X-rays are only triggered when the RSP trigger is TRUE and therefore isolating
the peak . . . 59
5.3 a) The average breath signal captured by the X-ray trigger in the un-gated imaging setup (blue) the black is the standard deviation of the average at each point. There is an average of 0.12± 0.02 correlation between the average breath captured and each individual breath captured. b) The average breath captured by the X-ray trigger in the RSP gated study (blue). The standard deviation of the average is shown in black. The correlation
between each breath captured is 0.91±0.06. . . 60
5.4 A slice of the reconstructed image set where the diaphragm is in focus a) The diaphragm is blurred due to the motion during the projection images. The HWHM of the diaphragm edge is 2.6±0.6mm. b) The diaphragm edge is sharp due to the minimal motion during projection images, the HWHM of the edge is 1.8±0.5mm. c) A line plot over the diaphragm edge showing that the gated study has a significantly higher contrast than
the un-gated study. . . 62
5.5 The correlation of each projection throughout the image sequence over two physiological trigger lengths. By removing the three points with arrows,
LIST OF ABBREVIATIONS
AFS Artifact spread function
AFVR Adapted fan-beam volume reconstruction
AWT Acquisition window true
AP Anterior-posterior
BMI Body mass index
BPM breaths or beats per minute
BRIC Biomedical research imaging center
BT Buffer time
CF Cystic Fibrosis
CNR Contrast to noise ratio
CNT Carbon nanotube
CT Computed tomography
CXR Chest x-ray radiography
DAQ Data acquisition board
DCT Digital chest tomosynthesis
DSCT Dual-source computed tomography
ECG electrocardiogram
FDA Food and drug administration
FPS Frames per second
FWHM Full width half max
GPIB General purpose interface bus
LCA Lateral costophrenic angles
LN Lung nodule
LSF Line spread function
Micro-CT Micro-computed tomography
MPE Multi pixel electronics
MRT Micro beam radiation therapy
PA Posterior-anterior
PVDR Peak valley dose ratio
PW Pulse width
ROI Region of interest
s-DBT Stationary digital breast tomosynthesis
s-DCT Stationary digital chest tomosynthesis
SID Source to detector distance
SOD Source to object distance
SIRT Simultaneous iterative reconstruction technique
SNR Signal to noise ratio
TTL Transistor-transistor logic
CHAPTER 1 Introduction
1.1 Overview
Patients with lung disease are normally monitored with a 2D chest radiograph (CXR). CXR uses
a relatively low radiation dose and is low cost. The sensitivity of a radiograph is relatively poor due
to the superposition of normal anatomy over lesions. Studies have shown poor lung nodule sensitivity
for lesions less than 10mm. (Vult von Steyern et al., 2012; Dobbins et al., 2008b; Terzi et al., 2013b)
If there are suspicious indications on the CXR image, a computed tomography (CT) scan can be
required. A CT scan is the gold standard for chest imaging but requires a large dose of radiation and
is a high cost to the patient. In order to address these limitations, digital chest tomosynthesis (DCT)
has been developed.
DCT is an imaging modality that uses X-ray projection images acquired over a limited scanning
angle to reconstruct a 3D image of the lung field. The projection images are taken by translating a
conventional X-ray source. The projection images are reconstructed into a sequence of tomosynthesis
slices, each showing a different depth. The effects of overlapping tissues are minimized in
tomosyn-thesis imaging thus providing increased contrast of anatomic structures and depth localization of
lesions. This technology has been clinically used for breast and chest imaging.(Good et al., 2008;
Sechopoulos, 2013; Dobbins et al., 2008a) DCT has been shown to have better sensitivity than
CXR.(Dobbins et al., 2008b) DCT clinical trials have shown that tomosynthesis can detect nodules
as small as 5mm.(Dobbins and Mcadams, 2009; Vikgren et al., 2008; Bertolaccini et al., 2015) The
American College of Radiology has released a LungRADS assessment chart for the standardization
of lung nodule screening. The LungRADS assessment chart recommends a 1 year follow-up for
nodules less than 6mm.(Rad, 2014) Therefore, DCT screening could have the potential to reduce the
One main limitation of DCT is the long scan time. The scanning time is limited by the
me-chanical motion of the X-ray source. A conventional X-ray source uses a metal filament (cathode),
which is heated to emit electrons that are accelerated to strike a metal target (anode) to create
X-rays. Conventional X-ray tubes emit X-rays from a single focal spot. Our research group has
developed a field emission X-ray source array technology using carbon nanotubes (CNTs) as the cold
cathode.(Cheng and Zhou, 2003) A stationary digital breast tomosynthesis (s-DBT) using a CNT
X-ray source array has been successfully developed and installed in the University of North Carolina
Womens Hospital for clinical trials.(Tucker et al., 2014; Wu et al., 2015; Qian et al., 2012) Using
the X-ray source array, the stationary digital chest tomosynthesis (s-DCT) system can achieve full
angular coverage in tomosynthesis imaging with no moving parts. Previous studies on the stability
and geometry of the s-DCT system have been published.(Shan et al., 2013, 2014a)
The goal of this project was to develop prospective gating in stationary digital chest tomosynthesis
using a carbon nanotube X-ray source array in order to increase image quality for patients who
cannot complete a breath hold for lung imaging.
1.2 Specific research aims
1.2.1 Research Aim 1
The first research aim was to convert the bench top tomosynthesis system into a clinical prototype
s-DCT system. This required moving the equipment to a research imaging center, making the system
electrical safety and radiation safety compliant, and imaging patients to evaluate the diagnostic
relevance of s-DCT.
1.2.2 Research Aim 2
The second research aim was to create the gated stationary digital chest tomosynthesis (Gs-DCT)
system. This required integrating a flat panel detector, CNT X-ray source, and frame grabber card.
Customized operating software was developed to trigger and save the X-ray images. The system was
1.2.3 Research Aim 3
The final research aim was to quantify the benefit of the Gs-DCT system. The system was fully
characterized and tested in two porcine studies. The main research questions were: Is the temporal
resolution of this system high enough to image in-vivo animals, will global patient motion blur
overpower the benefit of gating, and will gating yield diagnostically relevant images?
1.3 Dissertation organization
This dissertation is organized in the following order: Chapter two focuses on the background of
X-ray imaging for medical purposes and gated imaging. The first part of chapter two covers X-ray
generation, image formation and quality assessment. The second part of chapter two covers key
factors in gating and current applications of gating. Chapter three covers the work completed on Aim
1 of this dissertation including previous the work done on the clinical prototype of the s-DCT system,
including the materials and methods of the X-ray source, the dosimetry used, and the patient studies
completed using this system. Chapter four reviews the work completed on Aim 2 and details the
application of gated imaging to the s-DCT. Chapter five covers the work completed on Aim 3 and
quantify the benefit of the Gs-DCT system. Chapter six includes conclusions of this dissertation and
CHAPTER 2
X-ray imaging for medical purposes
2.1 Introduction
This chapter covers key components of X-ray imaging and applications. X-ray imaging is
the most widely used medical test. The images allow physicians to gain anatomic and functional
information non-invasively. This chapter first explains conventional X-ray generation. Conventional
X-ray sources are used in all commercial transmission X-ray based imaging systems but have
limitations that are discussed here. To address the limitations of a conventional X-ray source, a
carbon nanotube (CNT) X-ray source has been invented. The second section of this chapter discusses
the CNT X-ray source and its applications. The third section of this chapter gives a short overview of
image formation and the ways image quality is assessed; image quality parameters will be analyzed
in later chapters. The last section of this chapter provides a background to gated imaging including
key factors in gating and current applications for gating.
2.2 Conventional X-ray generation
X-rays are generated by taking energy from electrons and converting it into photons. X-ray tubes
are used for all transmission X-ray imaging. There are two main parts to the X-ray tube. The first is
the energetic electron supplier. In a conventional X-ray source, a large current is passed through a
metal filament, due to the resistance, the filament is heated. When the filament temperature is high
enough, electrons are ejected from the metal through thermal emission. The source of the electrons
is known as the cathode and is commonly tungsten. A schematic of a conventional X-ray source is
shown in figure 2.1.
The second part of an X-ray tube is the positively biased target, where the electron energy is
converted into photons, this is known as the anode. The X-rays are created when the electrons are
to the current of the electrons generated by the cathode and by the square of the voltage applied to the
anode. The anode is normally a heavy metal, such as tungsten. This type of X-ray source is known
as a thermionic source. The emission of electron is dependent on the thermal energy of the electron
to break the potential barrier between the cathode and vacuum.
There are two main processes that occur when the electrons hit the metal target. The first
process is Bremsstrahlung radiation, produced by the slowing of the electrons hitting the metal
target. Bremsstrahlung radiation produces a continuous distribution of X-ray energies and is the
primary process for chest imaging radiation. The second process produces characteristic X-rays.
Characteristic X-rays are generated when the bombarding electrons have enough energy to knock an
electron out of one of the inner shells of the target metal atoms. Then the electrons from higher shells
drop down to fill the vacancy, emitting X-ray photons with precise energies determined by electron
energy levels. Characteristic X-rays are formed anytime the incoming electrons have an energy above
the K-edge of the metal target. For mammography, the bremsstrahlung radiation is filtered out and
only the characteristic X-rays are used. This allows for more accurate attenuation measurements in
the images. For chest imaging, there is not enough characteristic X-rays to effectively image the
chest. Therefore, Bremsstrahlung radiation is the dominant source of spectra seen for the systems
analyzed here.
The amount of radiation an X-ray source emits in a given time is known as the X-ray flux. The
higher the current emitted from the cathode, the higher X-ray flux that is output from the X-ray tube.
A large X-ray flux will decrease the amount of ’beam-on’ time needed to deposit a given amount of
dose on the detector.
2.2.1 Bremsstrahlung radiation
Modern diagnostic X-ray generation is a product of the deceleration of electrons, usually
electrons, when they are slowed down by the anode. The energy of the radiated photon is equal
to the loss of kinetic energy of the electrons. The energy output from Bremsstrahlung radiation is
continuous with the maximum energy equal to the input energy of the charge carrier. There are fewer
photons near the maximum photon energy because there is a low probability of complete transfer of
electron kinetic energy to photon energy. The energy spectra from Bremsstrahlung radiation can be
Figure 2.1: A schematic of a conventional X-ray tube. The right hand side shows the heated tungsten filament emitting electrons towards the anode. (Bushberg, Jerrold T. , Seibert, J. Anthony, Leidholdt, Edwin Jr, Boone, 2002)
The low energy photons do not have enough energy to pass through the patient without scattering.
Therefore, they do not add to the image quality. These photons add more X-ray dose to the patient
because they have a higher probability of being absorbed in the body and are ionizing radiation that
cause harm to cells. According to the food and drug administration (FDA) standards, X-ray sources
require filtration to be used to prevent unnecessary X-ray dose the the patient. The spectra in figure
2.2 corresponds to the the anode voltage at 90kVp with a low energy filter to prevent unnecessary
radiation exposure to the patient.
2.2.2 Limitations of conventional X-ray sources
Only 1% of the primary energy of the X-ray source is converted into bremsstrahlung radiation
in a conventional X-ray tube. (Behlig, 2016; Oppelt, 2005) Most energy is lost due to the back
scattering of electrons and heat dispersion. 50% of the primary electrons are backscattered from
the anode and do not create X-rays. (Behlig, 2016; Oppelt, 2005) This inefficiency causes several
limitations to the X-ray source.
For 3D imaging, the X-ray source must illuminate the detector from multiple angles. With
a conventional single source X-ray system, that would require motion of the X-ray source and/or
detector to acquire images. In order to address this concern, for many 3D imaging applications, the
detector and X-ray source are mounted to a rotating gantry. It is impractical to put conventional
Figure 2.2: This spectra shows the probability of each energy being output from the X-ray source due to Bremsstrahlung radiation with a low energy filter such as aluminum. (Bushberg, Jerrold T. , Seibert, J. Anthony, Leidholdt, Edwin Jr, Boone, 2002)
High operating temperature and power consumption are some major limitation of a conventional
X-ray source. The flux of the X-ray source is largely constrained by the heat dissipation of the anode.
One solution is to rotate the anode during imaging. The rotation of the anode spreads the heat load
over a much larger volume than a stationary anode. An oil cooling system can also be implemented
to dissipate heat away from the anode. The cooling system for the anode, increases the size of the
system. The power consumption for a conventional X-ray source is high because the inefficiency of
the cathode. (Kandlakunta et al., 2017)
Electron-beam CT was invented to complete a CT scan with no mechanical motion.(Neculaes
et al., 2014a) In a electron-beam scanner, an electron gun creates an electron beam aimed at a target
rings. This creates the effect of hanging a continuous X-ray source around the patient. These target
rings produce the X-rays and a detector ring collects the images. One main application of this system
is cardiac calcium scoring. However, a major challenge of the electron-beam CT is the small scanning
volume. There is little collimation for each X-ray source which creates challenges in localizing the
detector location with respect to the source. (Neculaes et al., 2014b)
Another limitation of the thermionic sources is the poor temporal resolution of the cathode.
Due to the high temperatures needed, thermionic emission cannot be switched rapidly. In order to
this leads to poor response time, difficulty generating uniform, and non-periodic X-ray pulses. Both
of these qualities are needed for gated imaging of moving objects. In addition, the mechanical shutter
requires the X-ray source to be fired for longer periods of time. This could create excessive anode
heating. The temporal resolution of thermionic sources has been improved with more sophisticated
power supplies, faster rotation speeds, and clinical implementation of two X-ray source and detector
pairs in a single CT scanner.
2.3 Carbon Nanotube X-ray generation
2.3.1 Motivation
A CNT cold cathode has been invented in order to address the limitations of the thermionic
X-ray source. The CNT X-ray source uses electron field emission to generate electrons from the
cathode. This design is more compact than a thermal emission cathode allowing multiple X-ray
sources to be mounted within a single X-ray tube. Since the electrons are emitted by the creation of
an electric field, switching of the X-ray sources can be done with sub-millisecond resolution.
2.3.2 Field Emission
The emission of electrons into a vacuum from the metal cathode is explained in terms of
quantum-mechanical tunneling. The total energy of the electron in the cathode is lower than the
barrier potential. The metal has an intrinsic potential where the Fermi level is filled with electrons.
The vacuum energy is the potential energy of an electron at rest outside of the metal. The energy
difference between the Fermi level and the vacuum energy level is known as the work function (φ).
In a strong electric field, electrons can tunnel through the surface potential barrier into the vacuum.
This can be seen in figure 2.3 where the tunneling distance is decreased by a strong electric field.
The smaller the tunneling distance, the greater probability of an electron tunneling.
The process of the extraction of the electron from a solid by tunneling through the surface
potential barrier is governed by the Fowler-Nordheim theory.(?) The Fowler-Nordheim equation
describes the current density,J, of the tunneling.
J = aF 2
φ exp − bφ3/2
F
!
Figure 2.3: A schematic showing the Fermi energy within the metal cathode is lower than the vacuum potential. The difference in energy is known as the work function, (φ). By applying a strong electric field, the tunneling distance is reduced and electrons can escape the cathode. (Hamanaka et al., 2013)
Whereais a constant equal to1.54×10−6A·eV ·V−2andbis a constant equal to6.83eV−3/2· V ·nm−1, F is the applied electric field.
This model shows the dependence of the emitted current on the electric field and the work
function. The electric field is dependent on the shape of the metal, voltage applied, and the distance
between cathode and anode. (Hamanaka et al., 2013) Since the current of electrons is dependent on
the applied electric field, the temporal resolution of the CNT cathode is significantly better than a
thermal emission cathode.
2.3.3 CNT Field Emission
CNTs are good field emitters due to their high aspect ratio, strength, high electrical and thermal
conductivity, and resistance to oxidization. The high aspect ratios enhance the electric field. The
electrical conductivity makes it easier for the electrons to tunnel out of the metal. The thermal
conductivity reduces the heating of the cathode. Their strength and resistance to oxidization keeps
them from burning during the high currents.
2.4 Components of a CNT X-ray source
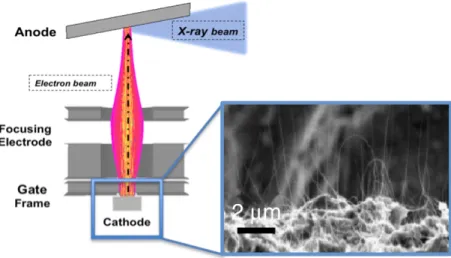
A CNT X-ray source is made of four main parts: CNT cathode, gate electrode, focusing
electrodes, and anode. In order to make the cathode, CNTs are deposited onto a highly conducting
substrate such as molybdenum. A scanning electron microscope (SEM) image of the deposited CNTs
Figure 2.4: The left side shows a schematic for a CNT X-ray source. The molybdenum substrate is coated in CNTs. A positive bias is applied to the gate allowing for electron field emission from the CNTs. The electrons are then focused and collide with the anode. X-rays are produced at a 90◦angle to the incident electrons.(Zhou and Calderon-Colon, 2010)
X-ray source. The size of the cathode will effect the focal spot size and maximum current from the
cathode.
The electrons are pulled from the cathode when the gate electrode is given a positive bias,
creating an electric field between the cathode and gate mesh. There are two designs that will produce
a positive bias. The first is a grounded cathode and a positive voltage around 1-2 kV. The second
design is a grounded gate and a negatively biased cathode. The gate mesh is commonly made of
tungsten.
The emitted electrons have a wide angular span. In order to focus the electrons to the desired
spot on the anode, focusing electrodes are used. These electrodes provide an additional electric field
to decrease the size of the focal spot on the anode. The anode voltage in the CNT X-ray sources can
vary from 24kV for mammography imaging to 140kV for CT imaging.
This cold cathode design is more compact than a conventional cathode. The components of the
X-ray source are shown in figure 2.4. These CNT cathodes could be put into any configuration to
create a multi-pixel X-ray source array. The most common configuration for medical applications is
2.4.1 Limitations of CNT X-ray source
There are limitations to the CNT X-ray source design. One of the limitations that arise from the
CNT X-ray source design is the relatively small X-ray flux, compared to a conventional X-ray source.
A larger amount of electrons generated from the cathode, known as tube current, allows for shorter
X-ray pulses which decrease the imaging time. The X-ray source current is limited by the thermal
management of the anode. If a rotating anode were to be used, a larger X-ray flux could be used. The
current CNT X-ray sources in use have a tube current between 1 and 80mA.
The amount of voltage applied to the gate cathode needed to yield a fixed current can change
over time due to the changes in the CNT X-ray sources. The CNTs can burn out, reducing the amount
of current passed through or they can elongate, increasing the amount of current that is produced. In
order to address this, the amount of current from each X-ray source is measured every time it is fired,
that data is fed back into the voltage supply of the gate. Then, automatically, the voltage applied to
each gate is fine-tuned to maintain constant output.
Another limitation of the multi pixel X-ray sources the risk of current arcing between the
sources at a high anode voltage. Arching can occur if there are contaminants in the X-ray tube. The
contaminants can ionize from the heated tube components or environmental contaminants; these ions
can cause arcing. In order to prevent arching, the X-ray source is in a vacuum, typically 10−8torr.
2.5 Applications of CNT X-ray sources
The CNT X-ray source has been used in radiation treatment and X-ray imaging applications.
For radiation treatment, a micro beam radiation therapy (MRT) system has been developed and that
has shown promising results in mice. (Chtcheprov et al., 2014) A photo of this system is shown
in in figure 2.5. The CNT cathodes has allowed for multiple X-ray sources with multiple focal
tracks as small as 100µm wide to be combined in a single system. Previously, MRT could only be
accomplished at synchrotron facilities.
The CNT X-ray source has also been integrated into a stationary digital breast tomosynthesis
system (s-DBT). (Qian et al., 2012; Tucker et al., 2014; Calliste et al., 2015) A schematic can
be seen in figure 2.6(a). The first generation s-DBT system is undergoing clinical trials, shown
Figure 2.5: A photo of the MRT experimental setup for small animal imaging.(Zhang et al., 2014)
conditioning and characterization. Digital breast tomosynthesis (DBT) is now FDA approved for
screening of breast cancer. The CNT X-ray source has allowed for a full DBT motion to be acquired
with no mechanical motion. This decreases the focal spot motion blur that degrades DBT’s ability to
distinguish malignant from non-malignant micro-calcifications.
An intra oral digital tomosynthesis system was created and tested to aid in diagnosis and
treatment planning of dental disease.(Shan et al., 2015b) The stationary intra-oral tomosynthesis unit
was shown to have image quality equivalent or superior to standard digital images with the added
benefit of 3D information. This system is currently installed in the UNC dental school for ongoing
clinical trials. Due to the compact nature of the CNT multi-pixel X-ray source, 3D intra-oral imaging
is being tested as a screening tool for tooth fractures and cavities.
The micro-computed tomography (micro-CT) system was used to gain respiratory and cardiac
gated images in small animals with high spatial resolution. There have been two micro-CT systems
built that will be discussed in later chapters.(Burk et al., 2012; Cao et al., 2010). A CAD drawing of
the first MRT system can be see in figure 2.7. The CNT X-ray source with fast temporal resolution
allowed for cardiac and respiratory gated imaging in mice studies.
A stationary digital chest tomosynthesis (s-DCT) system is another application of the CNT X-ray
Figure 2.6: (a) A schematic for the s-DBT system showing the multiple CNT X-ray sources illumi-nating the whole detector (b) A photo of the s-DBT system installed in the UNC hospitals for clinical trial.(Tucker et al., 2013)
2.6 X-ray Image formation and quality assessment
2.6.1 X-ray Attenuation
X-ray images are acquired using shadows of the X-ray beam passing through the subject. The
X-rays could pass through the patient with no attenuation or be attenuated by either absorption or
scattering. These attenuation events affect which and how many X-ray reach the imaging detector.
When an X-ray is absorbed by tissue in the body, the energy from the photon is dispersed in the
tissue. This can cause ionizing radiation that can have negative biological effects. When a photon is
scattered, the direction of the photon could be changed. Detecting a scattered photon is the cause of
noise in the image and degrades image quality.
For a monochromatic X-ray source, the intensity of the X-rays passing through a medium is
described by this equation:
I =I0e−
P
iµixi (2.2)
whereIis the output intensity,I0is the input X-ray intensity,µis the mass attenuation coefficient
for the material, andxiis the distance traveled in that material. This equation shows that the X-ray
absorption in the materials along the path between the X-ray source and X-ray detector are summed
together to find the total attenuation of the medium. The difference in attenuation of different
anatomical structures gives contrast in an image.
Figure 2.8 shows a graph of the common mass attenuation coefficients whereµis the attenuation
coefficient andρis the mass density of the material as a function of energy. This graph shows that
the attenuation of soft tissue and fat are very similar around the 80 - 120 keV range where lungs are
typically imaged. This means that it is harder to differentiate the fat from soft tissue. However, bone
has a higher attenuation provides good contrast against the background of the chest field of view. The
K-edge causes the sudden increase in the attenuation coefficient of the material. This occurs at the
energy above the binding energy of the K-shell electron, in this case of lead and iodine respectively.
A photon having an energy just above the binding energy is more likely to be absorbed than a photon
2.6.2 X-ray Detectors
The X-ray detector measures the spatial distribution and intensity of the photons as they hit
detector. Medical imaging detectors are flat panel detectors that could be indirect or direct.
An indirect detector uses a scintillator material to convert an X-ray to visible light, then the
visible light is detected. Each pixel contains a photo diode that generates a small current proportional
to the intensity of light produced by the scintillator layer on the front of the pixel. After the image is
acquired, the gray value of each pixel is read out to a command processor.
A direct flat panel detector uses a high voltage bias electrode and amorphous selenium. Electrons
are produced by the interaction of X-ray in the selenium and are collected in the storage capacitor of
each pixel, then the capacitors are discharged and the current of each pixel is read out to a command
processor.
The command processor converts the current read out by the pixel into a gray value. This yields
a 2D array of gray values that form an image.
2.6.3 Image Quality Parameters
The purpose of medical imaging is to help medical professionals understand and diagnose
internal structures and functions of their patients. The ability of the medical professionals to gain
diagnostic information from the images depends on the quality of the image. There are two main
components to diagnostic image quality: contrast and resolution. These image quality parameters
effect the sensitivity and specificity to the images.
Contrast quantifies the difference between characteristics of an object and surrounding
back-ground. (Prince and Links, 2006) High contrast allows for easier identification of individual objects
in an image. An effective way to quantify contrast is to examine the modulation of a periodic signal.
The modulation quantifies the relative amount the signal stands out from the average background in
an ROI.
The contrast can be degraded by noise in the system. The signal to noise ratio, (SNR) is the ratio
of primary signal to noise in an image. The primary signal is the X-rays that leave the X-ray source
and arrive at the detector with no scatter. The noise of the image is scattered X-rays that are detector
by dividing the average signal value of a region to the standard deviation of the gray values in the
same region. The SNR can be an indicator of sensitivity of the system.
Resolution is the ability of an imaging system to depict details. Image resolution quantifies how
close two lines can be to each other and still be visibly resolved into separate structures. In order to
calculate the resolution of the system, a thin tungsten wire is imaged. A line profile is then made
orthogonal to the imaged tungsten wire. The line profile becomes the line spread function (LSF).
The resolution of the system can be represented by the full width at half maximum (FWHM) of the
LSF. The FWHM of the LSF is the minimum distance two lines must be separated in order to appear
as separated in the recorded image. (Prince and Links, 2006) The 1D Fourier transform of the LSF
yields the MTF of the system. Therefore the MTF can effectively compare medical imaging systems
in terms of contrast and resolution. The calculation of the MTF will be discussed in Chapter 3).
2.7 Key factors in gating
2.7.1 Introduction to gating
Imaging of the chest has many complicating factors. First, there are many overlaying chest
structures such as the ribs, heart, and lungs that can mask disease and impede proper diagnosis.
Sec-ondly, breath holds can be difficult for sick patients. This can induce motion blur and reconstruction
artifacts into the images.
It has been shown that the main factor in image degradation during 3D imaging is patient motion
blur, even in images taken during a single breath hold.(Johnsson et al., 2014b) This is largely due to
the long scan times inducing global patient motion blur and physiological motion blur. Currently,
patients not capable of a breath hold are either given a CXR instead of a CT scan, or are sedated and
intubated. Patients not capable of a complete breath hold are excluded from DCT trials.
In order to address the challenges of chest imaging, gated imaging has been developed. This
section will cover some key factors in gating such as types of gating, image degradation,and temporal
coincidence.
Types of gating Gated imaging is the process of acquiring images during normal physiological
pro-cesses that are then reconstructed to obtain diagnostic information. There are mechanisms of gating:
process will occur and acquires images at that time in the future. Predictive imaging is very reliable
for cardiac imaging. Retrospective imaging acquires images throughout the physiological cycles and
sorts the images based off of the phase they were acquired in. In X-ray imaging, the radiation dose
associated with retrospective imaging is very high. Prospective imaging is acquiring images in real
time during the physiological process is occurring. (Lell et al., 2009)
Image degradation In 3D imaging, there is some inherent image degradation due to the multiple
projections needed to reconstruct a 3D image. There are three main types of motion blur in images:
X-ray source, global patient, and physiological motion blurring.
There is X-ray source motion blur, this is blur due to the motion of the X-ray source while it
translates. This is mitigated by a step and shoot technique while imaging, but can elongate the scan
time. An image would have streak artifacts in the scanning direction in the projection images if X-ray
source motion blur were present. In modern CT and DCT, X-ray source motion blur is not a major
factor to image degradation due to the high flux X-ray sources. When the X-ray source has a high
flux, the exposure time is low, therefore the translation time of the X-ray source during an exposure
is small.
Long scan times can increase global patient motion blur. This type of blurring comes from
patient’s inability to stay still for prolonged periods of time. This blurring is apparent when looking
at the posterior ribs of a patient. If the posterior ribs of the patient are blurred, then it is likely due to
global patient motion blur.
Physiological motion blur, mainly cardiac and respiratory motion blur, also degrade image
quality even when the scan is taken within a single breath hold. Cardiac blur can be seen by artifacts,
shadowing, or blurring at the heart edges in the reconstructed images. Respiratory motion blur is
easily spotted by looking at the edge of the diaphragm. The diaphragm will have artifacts, shadowing,
or blurring if the patient struggled to hold their breath during the scan.
Gated imaging is a way to limit cardiac and respiratory motion blur. Gated chest imaging
was first implemented for cardiac imaging in CT systems. Gating is required for most 3D cardiac
imaging due to the fast cardiac cycle. CT scanners are able to gate to the cardiac breath hold both
Temporal coincidence Most gating is driven by the temporal coincidence of the system. When
the inspiration phase of the respiratory signal is being isolated, in order to acquire an image, the
patient must be at peak inspiration, the detector must be counting photons, and the source must be in
the desired position to acquire the image, this is called temporal coincidence. In order to increase
temporal coincidence, the X-ray detector may be slowed down to increase the integration time or the
window of the physiological cycle to be captured could be increased.
2.7.2 Applications of gating
Predictive gating on a CT scanner Predictive imaging allows for cardiac imaging without
signifi-cantly increasing the radiation dose of the CT scan. In predictive gating, the diastole phase of the
heart cycle is isolated because it is the most still phase of the heart cycle. The time when the diastolic
phase of the cardiac cycle will occur is estimated from the prior 3 to 7 heart beats. During the scan,
the motion of the X-ray source, heart, and the patient table translation must all be synchronized.
As a result some heart beats are skipped during imaging, causing an increase in the scan time. For
a single slice CT, it takes roughly 48 heartbeats to take an image, for a DSCT it takes roughly 24
heart beats. The z-axis resolution is limited so the entire heart area can be imaged in a single breath
hold. This method is only effective for heart beats less than 90 beats per minute, any higher rate and
the diastole phase is not long enough to predictively gate.(Rasmussen et al., 2015; Nicolaou et al.,
2008) When predictive gating is not possible, retrospective gating may be possible. In retrospective
gated scanning, images are acquired continuously and the ECG signal is recorded. The images are
then sorted based on the phase of the heart they were acquired. For images to be reconstructed,
every position of the heart must be covered by a detector row at every point during the cardiac cycle.
Retrospective gating requires a large radiation dose due to the large number of projections needed.
(Desjardins and Kazerooni, 2004)
A single source CT scanner, using a high pitch mode, has a temporal resolution of between
250ms and 350ms. (Petersilka et al., 2008) The temporal resolution for a CT scan is the number of
views per segment multiplied by the time of repetition. Therefore to increase temporal resolution, the
rotation speed is increased. In order to increase the temporal resolution, DSCT scanners have been
applied. Using a dual source system, the temporal resolution is greatly improved to 75ms.(Petersilka
For patients with a heart beat above 90bpm, the temporal resolution of a conventional CT scanner
is not high enough to image the heart predictively. In this case, retrospective gating can be used. In
retrospective gating, images are acquired continuously through the cardiac cycle. The images are
sorted and reconstructed. These images can give some functional information about the cardiac cycle.
A large radiation dose is needed for these scans.
Prospective gating with a CNT X-ray source The fast switching of the CNT cathodes allows for
real time prospective gated imaging. This has been shown in a micro-CT mouse studies on two
generations of micro-CT scanners.(Cao et al., 2009, 2010) The micro-CT system contained 1 CNT
cathode and a high resolution detector. The temporal resolution for these studies was limited by the
flux of the X-ray source. Therefore the temporal resolution for the first generation tube was 50ms and
for second generation tube, 15ms. These studies showed the feasibility of high temporal resolution
switching in a CNT X-ray source.
The bench-top prototype for the s-DCT system completed a proof of concept study using the
CNT X-ray source array and a dynamic chest phantom. This study showed that a multipixel X-ray
CHAPTER 3
Research Aim 1: Create clinical prototype of s-DCT
3.1 Introduction
As discussed in the previous chapter, the multi-pixel CNT x-ray sources have shown promising
results in many applications. The focus of this dissertation is on the s-DCT system. This chapter
will provide the motivations, background characterization of the system, materials and methods,
important system parameters, and preliminary studies done on the non-gated clinical configuration
s-DCT system. This s-DCT system started as a bench top proof of concept study and was transitioned
to the Biomedical Imaging Research Center (BRIC) in Marsico Hall for clinical trials.
3.2 Motivation
Computed tomography (CT) is the current gold standard for lung imaging. CT provides a 3D
representation of the chest anatomy and produces a stack of images at different focal planes within
the patient. This limits the loss of sensitivity due to tissue overlap. A CT scanner uses a conventional
x-ray source and detector fixed on a rotating gantry. The rotation allows the CT scanner to acquire
∼1000 projection images at different angles with respect to the patient in a helical path. Recently dual source CT scans have been developed. The dual source systems cut the scan time in half due to
the dual x-ray source and detector systems.
The projection images are then reconstructed into a high contrast stack of images with each
image showing a different plane within the patient. A limitation of a CT is that it requires an effective
radiation dose of between .5 and 3 mSv. (Mott et al., 2013) Due to the high dose, CT is not ideal
for repeated screening for lung disease or routine follow ups. Another limitation of a CT scan is
the relatively long scan time (∼5-10s) (Von Steyern et al., 2012) . During that time, patients are instructed to hold their breath. If the patient breaths during the scan, the image quality can be
In order to address the limitation of the large x-ray dose required by a CT, digital chest
tomosyn-thesis (DCT) was created. A DCT scan acquires a small number of projection images over a limited
angular range. (Dobbins and Mcadams, 2009; Iii and Godfrey, 2003; Johnsson et al., 2014a) For a
DCT scan, a conventional x-ray source is on a translating gantry but the detector is stationary under
the patient. A DCT scan requires a dose of about 1/10th of a CT scan because a smaller number of
projections are acquired over a smaller angular span. (Vult von Steyern et al., 2012; Sabol, 2009;
Vikgren et al., 2008) DCT does not have the sensitivity and specificity of a CT scan but for screening
and cystic fibrosis (CF) disease monitoring it has been shown to be a good low dose alternative.
(Langer et al., 2016; Meltzer et al., 2016)
There are commercial DCT systems available and their imaging parameters are shown in table
3.1. These DCT systems use conventional x-ray sources therefore the anode voltage, focal spot,
and resolution are similar to a conventional CXR system. The DCT systems take between 60-74
images for a chest scan covering an angle of 30◦-40◦. An increased angular span, will increase the
depth resolution in the images. The scan time is 5s-10s. This scan time is limited by the need to
mechanically move the x-ray source. Overall, the system resolution, measured as MTF, is roughly
3-3.5 cycles/mm for the commercial DCT systems. The resolution is limited by the focal spot size,
the detector pixel size, and the imaging dose. The effective dose of the DCT scans are between
.12mSv and 1.2mSv. Increasing the resolution of the system would increase the dose required to
image the patient.
The greatest limitation of the a conventional DCT system is the long scan time. In clinical trials,
pediatric patients are excluded due to their inability to complete a breath hold. In order to address
the limitations of the DCT system, the s-DCT system was created. Due to the stationary CNT x-ray
source array, the entire DCT scan can be acquired without mechanical motion. This allows for faster
scan times and the ability to do prospectively gated imaging.
3.3 Materials and methods for non-gated s-DCT system
3.3.1 System overview
The s-DCT system is comprised of a CNT x-ray source, flat panel detector, computer, switching
Conventional DCT Systems
Commercial System GE VolumeRAD Shimadzu Safire s-DCT system
Anode (kVp) 80-120 80-120 80
No. Projections 60 74 31
Ang. Coverage (◦) 30 -35 40 12
Scanning Time (sec) 10 5 10
Focal Spot Size (mm) 0.6/1.2 0.4 2.5 x 0.5
Effective Dose (mSv) .12 *** ***
Resolution (cycles/mm) 3.5 3 1.7 x 3.4
Table 3.1: A comparison between two commercial DCT systems and the s-DCT system. (Dobbins et al., 2008a; Vikgren et al., 2008; B˚ath et al., 2010; Li et al., 2008; Yamada et al., 2011)
to the patient’s spine. Figure 3.1 shows the clinical configuration of the s-DCT system installed in
the BRIC on the UNC campus. The electronics rack holds the equipment that will be discussed in
later sections. The flat panel detector is embedded in the mattress, under the sheet. The x-ray source
is shown mounted above the patient bed. The x-ray source has been covered with white acrylic.
Also under the cover, x-ray filtration and collimation ensure the x-ray field meets all radiation safety
regulations. Behind a leaded wall (not shown in this picture) is a tech work station with a computer
to control imaging. This system has been electrical safety and radiation safety certified. System
topology can be found in 3.2.
3.3.2 s-DCT x-ray source
This XinRay x-ray source (Model 2008-08-L75-002, XinRay System Inc., Research Triangle
Park, NC) was designed for alternative experiments and was retrofitted for medical imaging purposes.
Some of the specifications of the x-ray source are not optimal for medical imaging. A schematic
drawing of the CNT x-ray tube is shown in figure 3.3a. The schematic shows how each individual
CNT x-ray source covers the same area of the detector using a cone beam. This allows the system to
acquire images at multiple angles with respect to the detector without any mechanical motion.
The x-ray tube used in this experiment is shown in 3.3b. This x-ray source has 75 independent
focal spots distributed in a 29cm linear array. For this study, 29 of the focal spots were used with
an 8mm pitch. Due to the 29cm length of the tube, using all 75 focal spots would over sample the
image space. This would increase the patient dose without increasing the image quality. The focal
Figure 3.1: A photo of the clinical configuration of the s-DCT system. The CNT x-ray source array is covered and mounted above the bed. The electronics rack holds the equipment to monitor and drive the system. The flat panel detector is embedded in the patient bed mattress.
Figure 3.3: (a) The schematic for the s-DCT x-ray source array. Each pixel of the x-ray source illuminates the entire detector field, allowing for a complete tomosynthesis scan with no mechanical motion. (b) The x-ray tube used in this experiment. It is 29cm long with 75 cathodes. The collimation is placed parallel to the x-ray window shown here.
2014a) The focal spot was measured using the pin-hole method described by European standard
EN12543-2.(Shan et al., 2013)
For the clinical configuration, each of the 29 individual cathodes output 5mA current. A high
voltage switching system controlled the voltage across the gate. The voltage across the gate controls
the electric field acting on the CNT cathode. The electric field determines the current drawn form the
cathode. The gate voltage was produced by a XinRay switching system (Research Triangle Park, NC,
Model 10524602), also known as an multi pixel electronics (MPE), that had a port for each cathode.
Therefore, the current from each cathode is independently electronically controlled.
The electrons pulled from the cathode then bombard the anode. The anode in this system is set to
80kVp for imaging. A Spellman high voltage power supply (Hauppauge, NY, model XRV160P1800)
powered the anode. The tungsten anode was elongated and shared by the cathodes. In order to
comply with the US Food and Drug Administration (FDA) regulations(Adm, 2013) on beam quality
for diagnostic imaging, the X-rays were filtered using 2.8mm of aluminum filtration. The x-ray
beams are then collimated in the scanning direction. Tungsten bars are fixed 2cm below the scanning
window and run the length of the x-ray window. This collimation limits the width of the x-ray field
to the width of the detector. There was no collimation perpendicular to the scanning direction. To
Figure 3.4: A Schematic timing diagram of the triggering system. When the detector clock is high, the detector is integrating, when the detector clock is low, the detector is reading out the image. The x-ray sources are triggered at the rising edge of the detector clock.
3.3.3 Detector
The flat panel x-ray detector was a Carestream Health Inc. (Rochester, NC) 35.3cm x 43cm
amorphous silicon detector (model DRX-1C) with a pixel size of 139µm in each direction. A scatter
reducing grid was not used. The detector was run in a continuous acquisition mode; meaning the
detector was constantly integrating and reading out images. Only during x-ray imaging were the
images saved to the computer. Because of the continuous acquisition of the detector, the detector
acted as the clock for the system. X-rays could only be fired during the start integration phase of the
detector. The detector speed was fixed at 3 frames per second (fps). The integration window was
fixed at 110ms and read out time was 270ms. The detector speed limited the imaging time in this
experiment. The total time to acquire a tomosynthesis set was 10 seconds.
The maximum allowed pulse width for this study was 100ms. To ensure that the whole pulse
width was collected during the integration window, the X-rays were always fired at the leading
edge of the integration window. The detector signal was read in through a detector box supplied by
Carestream. The detector box had an TTL output that indicated the phase that the detector was in.
When the signal was high, the detector was integrating and when it was low, it was reading out, as
shown in figure 3.4. The detector box had an ethernet output used to transmit images to the computer
Figure 3.5: The MTF plot of the s-DCT system.(Shan et al., 2013)
3.3.4 System resolution
The modulation transfer function (MTF) is a measure of the in-plane resolution of the system and
the artifact spread function (ASF) is a measure of out of plane resolution. Both of these measurements
were done with the tube voltage at 80kVp with an SID of 130cm and an SOD of 119cm. Yielding an
angular span of 12◦ covered during imaging.
The MTF of this system was measured to be 1.7 lines/mm in the scanning direction and 3.4
cycles/mm perpendicular to the scanning direction. This is shown in 3.5. The MTF was measured
using a 100µm tungsten cross wire phantom. The line spread function (LSF) was measured using
the slant angle oversampling method and fitted to a Gaussian function to remove noise. Then the
discrete Fourier transform of the LSF was taken to get the MTF. The MTF reported as the was 10%
of the MTF function.
The ASF is a good measure of out-of-plane blurring in tomosynthesis images.The ASF is
calculated by measuring the contrast between objects and the background in reconstructed images.
The ASF was measured to be 5.2 in this system.(Shan et al., 2014a) The ASF is taken by measuring
the contrast of the object and it’s background. The calculation for the ASF is shown in equation 3.1,
whereµis the attenuation of the material. Theµobj(z)is the gray value of the object when it is in
ASF(z) = |µobj(z)−µbkg(z)|
µbkg(z)
(3.1)
3.3.5 System monitoring and control
The s-DCT system was controlled by a LabVIEW program. The flow of this system can be seen
in 3.6. The first component of the LabVIEW code monitored the tube health. The anode voltage and
tube pressure were measured and displayed for the user to see. The anode voltage was monitored
via ethernet cable connected to the computer from the high voltage power supply. The pressure
of the x-ray tube was measured via vacuum gauges in the vacuum pumps connected to a Texas
International data acquisition board (DAQ). The DAQ read in the analog signal from the vacuum
pumps. Monitoring the pressure of the x-ray tube is important to ensure no harm is being done to the
cathodes and no arcing between the cathodes. The pressure in the x-ray tube also rises to signify
X-rays are firing. The x-ray system automatically shut down if the tube pressure exceeds the safe
pressure for the CNTs, typically below5x10−9torr. This process is done in the check equipment
and initialize modules section shown in figure 3.6
The second component of the LabVIEW code walks the x-ray technician through patient imaging
process. This is shown in the event flow in figure 3.6. At the start of an imaging session, a patient
was checked into the LabVIEW program. The user inputs the general size of the patient (small,
medium, or large) and the identification number.
The size of the patient determined the scout image pulse width. The predetermined pulse width
was then programmed into the two channel digital pulse generator (Model DEI PDG-2515) over a
general purpose interface board (GPIB) connection. Then, the MPE was initiated to fire the center
source one time using an output signal from LabVIEW. After the user starts scout image acquisition,
the pulse generator waits for the next trigger from the detector. Upon receiving the detector trigger,
pulse generator sends a TRUE signal for the duration of the x-ray pulse width to the MPE. The MPE
fires the center x-ray source one time for the duration the pulse generator signal is TRUE.
After the x-ray is fired, the scout image was then read into LabVIEW. The image is displayed
and the technician defines the region of interest (ROI) by placing two boxes in the lung region. Then,