THE IMPACTS OF ALTERED FLOODPLAIN HYDROLOGY OF THE LOWER ROANOKE RIVER ON TREE REGENERATION AND FLOODPLAIN FOREST COMPOSITION
Jacqueline Michael White
A dissertation summited to the faculty of the University of North Carolina at Chapel Hill is partial fulfillment of the requirements for the degree of Doctor of Philosophy in Ecology in the Curriculum for
the Environment and Ecology
Chapel Hill 2014
ii © 2014
iii ABSTRACT
Jacqueline Michael White: The impacts of altered floodplain hydrology of lower Roanoke River on tree regeneration and floodplain forest composition
(Under the direction of Robert K. Peet)
Tree regeneration in floodplain forests is broadly determined by the ability of species to tolerate the flood regime at a given location. River regulation affects all aspects of the flood regime, but the effect is not linear across the floodplain or over time. This study assesses regeneration patterns in relation to the inundation regime at small scales across a broad extent in order to anticipate trajectories of forest change. This research is a case study of the lower Roanoke River, a regulated brownwater river on the North Carolina Coastal Plain, but the results presented here have broad applications.
The first two chapters assess the combined effects of flood control and hydropower generation on the flood inundation regime. These changes are then mapped across the floodplain as an index of hydrologic stress. Next, I document variation in tree species regeneration dynamics over time and with respect to hydrologic setting. I then relate seedling dynamics to year-to-year variation in inundation patterns, and develop simple models to predict potential trajectories over time.
iv
seedlings would recruit into the sapling layer. The abundance of small stems declined over 14 years providing support for this prediction. Species that are prolific seeders, widely dispersed and have a broad tolerance range dominate the seedling layer as their regeneration strategy improves the
v
ACKNOWLEDGMENTS
I am so grateful for all the love and support I received while completing this endeavor. These final steps towards the completions of the dissertation have been difficult, and at times, I thought it would never come to fruition. Perhaps it wouldn’t have without all the support I was given along the way. I couldn’t have done this alone. Thank you for sharing the journey.
The project from which this dissertation arose was funded by Dominion Power, The North Carolina Nature Conservancy, US Fish and Wildlife Service. I am so proud that I was able to make a contribution to the cooperative management of the lower Roanoke River.
I would also like to thank my department and the Coker’s for their generous support. I am honored to have received these fellowships.
My committee has been as dynamic as a free-flowing river and I learned something from you all. I would particularly like to thank Bob, my committee chair. He left me to my own devices to grow as a leader, a researcher, and a mentor to others. Cliff Hupp, Sam Pearsall, Alan Weakley and Peter White, I learned so much from you all. There is a reason for a committee during the PhD process; to learn to see the discipline through others eyes.
To my technicians, those who know the rules of the river are an elite group. It was my goal to teach you that you are capable of more than you know, as the time spent working on the river taught me.
vi
TABLE OF CONTENTS
LIST OF FIGURES ...ix
LIST OF TABLES ...xi
CHAPTER 1: INTRODUCTION ... 1
Overview ... 1
Objectives ... 4
Significance ... 6
CHAPTER 2: RIVER REGULATION AND ITS IMPACTS ON FLOODPLAIN HYDROLOGY: A CASE STUDY OF THE LOWER ROANOKE RIVER, NORTH CAROLINA ... 8
Introduction ... 8
Methods ... 10
Study area description ... 10
Index of post-dam divergence of the flood inundation regime ... 13
Water level monitoring gages ... 14
Results ... 16
Changes in hydrology from flood model analysis ... 16
Index of flood deviation ... 17
Evaluating flood model predictions ... 19
Discussion ... 20
Changes in hydrology ... 20
vii
CHAPTER 3: EFFECTS OF HYDROPEAKING ON FLOODPLAIN INUNDATION ON THE
LOWER ROANOKE RIVER ... 25
Introduction ... 25
Study area description ... 27
Methods ... 28
Results ... 30
Discussion ... 33
CHAPTER 4: THE SPATIO-TEMPORAL DYNAMICS OF TREE SEEDLINGS IN RELATION TO HYDROPERIOD ON A REGULATED ... 36
Introduction ... 36
Methods ... 40
Study area description ... 40
Site selection and plot design ... 42
Assigning inundation discharge to seedling plots ... 43
Assessment of study period hydrology ... 43
Spring survivorship and recruitment protocol ... 44
Summer recount protocol ... 44
Analyses of seedling dynamics... 44
Results ... 45
Study period hydrology ... 45
Germination ... 46
Abundance, richness, and diversity within and between years ... 46
Variation in inundation discharge classes within and between years ... 47
viii
Establishment and survival ... 53
Abundance, survivorship, and richness within and between years ... 53
Variation across inundation discharge classes within and between years ... 54
Variation in species functional groups abundance across years, seasons, and the inundation gradient ... 56
Discussion ... 57
CHAPTER 5: THE EFFECT OF HYDROPERIOD ON LONG-TERM TRENDS IN TREE SPECIES DEMOGRAPHICS AND RESULTING FOREST COMMUNITY COMPOSITION ... 61
Introduction ... 61
Methods ... 64
Site description ... 64
Site selection and plot design ... 65
Seedling data collection methodology ... 66
Determination of inundation class ... 66
Defining functional types ... 67
Resampling permanent plots ... 70
Modeling functional-group seedling abundance over time ... 70
Static model ... 70
Dynamic model ... 73
Assessing model prediction with long-term forest composition data ... 74
Results ... 74
Static model ... 75
Dynamic model ... 78
viii
Changes in stem density within functional groups across the
inundation gradient (1995-2009) ... 81 Discussion ... 83 CHAPTER 6: CONCLUSIONS ... 89 APPENDIX 1: MAXIMUM CORRELTATION (MC) BETWEEN DAILY DISCHARGE AND
AVERAGE GAGE DEPTH DURING THE 2009 GROWING SEASON PEAKING COMPARED TO NINE RANDOM TIME INTERVALS (RC) OF THE SAME DURATION
USING CROSS CORRELTION ANALYSIS ... 139 APPENDIX 2: HYDROLOGIC VARIABLES CALCULATED USING USGS STREAMGAGE
DATA (USGS GAGE ROANOKE RAPIDS, NC AND THE TOWNSEND FLOOD
ix LIST OF FIGURES
Figure 1: Map of the lower Roanoke River downstream of the fall-line in
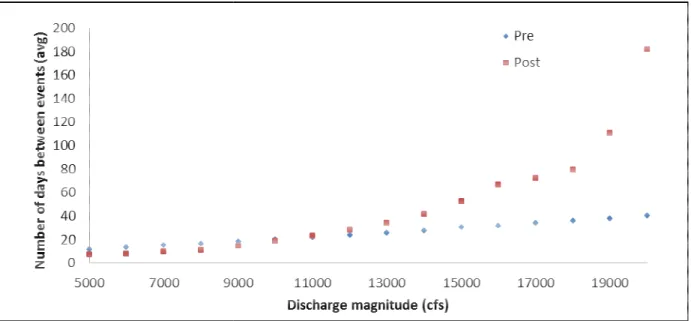
northeastern North Carolina... 91 Figure 2: Change in average return interval (days between events) for floods of
different magnitudes in the pre- and post-dam periods ... 91 Figure 3: Maximum annual discharge (cfs) recorded at USGS gaging station at
Roanoke Rapids, NC ... .92 Figure 4: Post-dam proportional change in the number of growing season flood
events for a given discharge magnitude ... 92 Figure 5: Post-dam proportional change in the average duration of a growing
season event of a given discharge magnitude ... 93 Figure 6: Annual average duration in days of growing season floods of different
magnitudes pre- and post-dam in years when the flood occurred ... 93 Figure 7: Annual average duration in days of different magnitude floods pre- and
post-dam in years when the flood occurred ... 94 Figure 8: Cumulative maximum duration in days of growing season floods of
different magnitudes pre-and post-dam ... 94 Figure 9: Monthly maximum, minimum and average flows on the lower Roanoke
River pre- and post-dam. ... 95 Figure 10: Principal Components Analysis in the flood inundation regime on the
lower Roanoke River for different flood magnitudes pre- and post-dam ... 96 Figure 11: Comparison of (1) the correlation between the predicted inundation
discharge from and the number of days a gage was flooded with (2) the correlation between the corrected inundation discharge (actual) and the number of days the
gage was flooded for the period 8/2007—8/2009. ... 97 Figure 12: Slope of the trajectory of the pre- to post-dam flood regime reaches of
the lower Roanoke River ... 98 Figure 13: Corrected inundation discharge for plots with gages compared to the
total number of hours the gage was flooded ... 98 Figure 14: Comparison of water gage readings for two 20,000 cfs floods, one in
January and one in June ... 99 Figure 15: Water depth in monitoring gages with increasing flood duration
x
Figure 16a-b: Comparison of water level drawdown in three gages located on
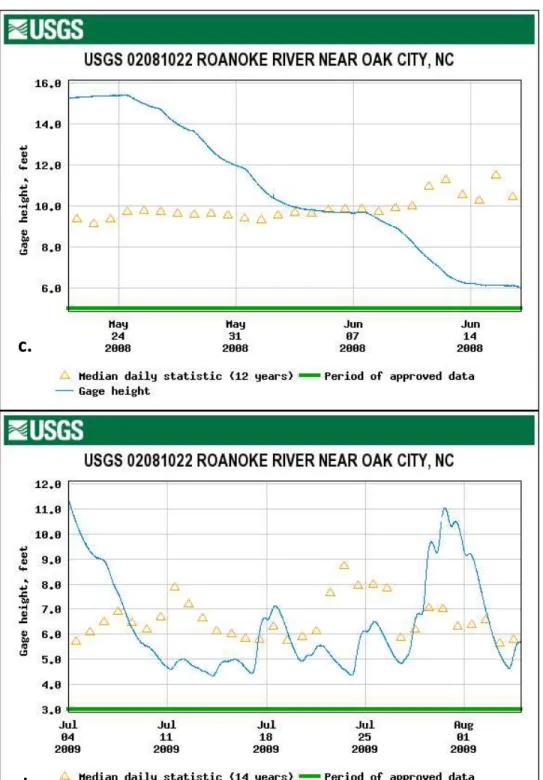
Wide Levee following floods during peaking (A) and non-peaking (B) ... 100 Figure 16c-d: River stage on the Roanoke River at the Oak City, NC stream gage
during (c) the peaking interval (7/04/2009—8/4/2009 and (d) the non-peaking
interval (5/21/2008—6/16/2008. ... 101 Figure 17: Daily precipitation during a non-peaking interval (5/26—6/28/2008)
and a peaking interval (7/4—8/6/2009) ... 102 Figure 18a-b: Comparison of discharge (a) and water level drawdown (b) in gage
23_274 located in a backswamp on wide levee after floods followed by a peaking
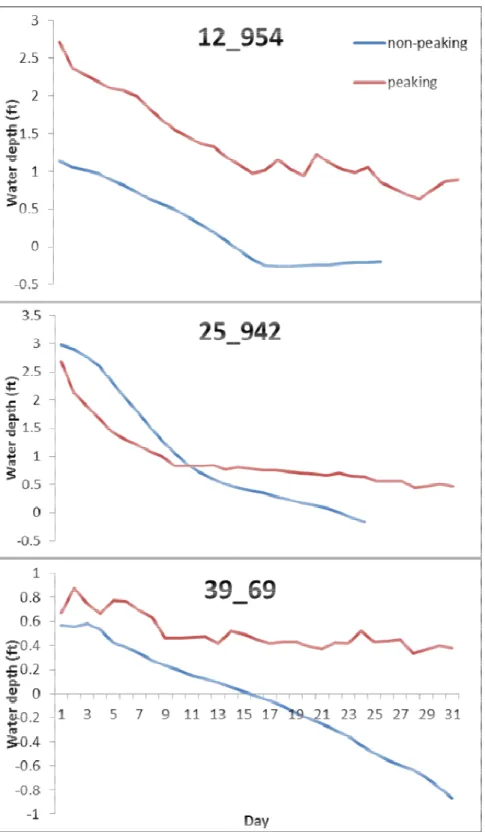
interval (7/4—8/06/2009) and a non-peaking interval (5/26—6/15/2008)... 103 Figure 19: Water depth in three gages compared between the peaking period
(7/06—8/04/2009) and the non-peaking period (5/26—6/15/2008) ... 104 Figure 20a: Gage locations used for the analysis of peaking effects ... 105 Figure 20b: Distribution of all water monitoring wells on the lower floodplain
In relation to seedling monitoring sites ... 106 Figure 21: Average variance of hourly water depth for each monitoring gage over
a 4-day, non-peaking interval (5/30—6/2/008) compared to a 4-day peaking
interval (7/7/20/2009) ... 107 Figure 22: Water depth in gage 23_274 (red) compared to average daily discharge
(solid blue) and daily range of discharge (dotted blue) from Roanoke Rapids, and
daily rainfall at the Lewiston at gage ... 108 Figure 23: Hourly discharge from Roanoke Rapids USGS gaging station compared
to water level depth in gage 12_954 located in near Big Swash ... 109 Figure 24: Comparison of overall trends in hydrology (mean daily discharge and
the daily range in discharge) between 6/1 – 8/31/2008 and 6/1—8/31/2009 to illustrate the difference in the rate that the floods recede following flood control
releases with and without peaking ... 110 Figure 25: During non-peaking intervals, the water depth on the floodplain is well
correlated with discharge, although there is a lag. Rainfall events occurred but
there is no observable response in the gage ... .111 Figure 26: Distribution of selected transects along the lower Roanoke River
xi
Figure 28: Change in the average number of individuals of first-year seedlings
grouped by inundation discharge class... 114 Figure 29: Average number of first-year species within inundation discharge
classes for the study duration ... 115 Figure 30: Average abundance of older seedlings across seasons by inundation
discharge class ... 116 Figure 31: Average richness of older seedlings across seasons by inundation
discharge class ... 117 Figure 32: Modeled seedling abundance per hectare by size class of the moderately
flood-tolerant, shade-tolerant, low-density functional group in each of the inundation
discharge classes over a 10-year interval ... 118 Figure 33: Modeled seedling abundance per hectare in the 51—100cm size class
and the >100cm size class of the moderately flood-tolerant, shade-tolerant, low-density functional group in each of the inundation discharge classes over
a 10-year simulation ... 119 Figure 34: Modeled seedling abundance per hectare by size class of the
moderately flood-tolerant, shade-intolerant, high-density functional group
in each of the inundation discharge classes over a 10-year simulation ... 120 Figure 35: Modeled seedling abundance per hectare in the 51—100cm size class
and the >100cm size class of the moderately flood-tolerant, shade-intolerant, high-density functional group in each of the inundation discharge classes over
a 10-year interval ... 121 Figure 36: Modeled seedling abundance per hectare by size class of the
flood-tolerant, shade-tolerant, low-density functional group in each of the
inundation discharge classes over a 10-year simulation ... 122 Figure 37a-c: Three dynamic models of seedling abundance per hectare by size
class of the moderately flood-tolerant, shade-tolerant, low-density functional
group in each of the inundation discharge classes over a 10-year simulation ... 123 Figure 38: Stem density for three functional groups by size class (diameter at
breast height) and inundation discharge class ... 126 Figure 39: The number of stems in 31 (100m2) Carolina Vegetation Survey plots
in 1995 compared to 2009 by diameter class ... 127 Figure 40: Change in the number of stems in 31 Carolina Vegetation Survey (CVS)
xii
inundation zones from1995-2009 ... 128 Figure 41: Proportional change in the number of stems in 31 Carolina Vegetation
Survey (CVS) plots partitioned into four diameter classes by flood-tolerance
group in three inundation zones from 1995—2009 ... 129 Figure 42: Number of stem within functional groups by stem diameter class in
xi LIST OF TABLES
Table 1: Possible peaking intervals during the growing season used for cross
correlation analysis ... 131 Table 2: Comparison of maximum correlation between river discharge at
Roanoke Rapids and water depth in monitoring gages during the growing
season peaking intervals using cross correlation an annual timestep ... 132 Table 3: Comparison of maximum correlation between river discharge at
Roanoke Rapids and water depth in monitoring gages during a non-peaking
interval compared to two peaking intervals ... 134 Table 4: Number of plots in zones delineated by the predicted five-day
release (in CFS) necessary for inundation as updated based on field observations
and well gage data ... 135 Table 5: Total growing season duration of flow magnitude for the study period ... 135 Table 6: Average abundance and species richness (per 20m2 of first-year seedlings) ... 136 Table 7: Functional groups and example species based on their flood tolerance,
shade tolerance, and wood density ... 136 Table 8: Abundance of first-year seedling in species functional groups based
on flood- and shade-tolerance and wood density ... 137 Table 9: Abundance and percent change in abundance of older seedlings within
year (between) ... 138 Table 10: Average abundance per 20m2 (no. of individuals) and richness (no. of
species) of established individuals (> one year old) for each year of the study with
variance measured using standard error of the mean ... 138 Table 11: Survivorship, percent survival, and recruitment of individuals between
consecutive years’ spring ... 138 Table 12: Number of older individuals surviving and recruiting between spring
1
CHAPTER 1: INTRODUCTION Overview
2
The flood inundation regime (the frequency, duration, timing and distribution of water on the floodplain) regulates tree species distribution (Hook 1960, Wolmann et al. 1964, Wharton et al. 1982, Nilsson et al. 1989, Gosselink et al. 1990, Mitsch and Gosselink 1993, Sharitz and Mitsch 1993, Poff et al. 1997, Leyer 2006). The combined effect of the increase in intensity of floods, reduction in frequency, and altered timing puts substantial stress on the vegetation. Because the dams alter all dimensions of the hydrologic regime (e.g., timing, duration, frequency, return interval, and rate of change of flows), river regulation is one of the greatest threats to the extent and function of such altered floodplain forests (Bunn and Arthington 2002, Nilsson and Svedmark 2002, Townsend and Foster 2002). The concern of management and conservation organizations is that floodplain forests downstream of the dams are being impacted due to operation policies of those upstream dams that result in too much water on the floodplain at the wrong time of year.
The floodplains of large, brownwater Coastal Plain rivers contain heterogeneous mosaics of forest types due to the differential distribution of tree species along a gradient of anoxic stress driven by inundation duration (Wharton et al. 1982). Rice and Peet (1997) studied the vegetation patterns of the lower Roanoke River and out of the 32 vegetation types they documented in this system as consistent with units in the U.S. National Vegetation Classification (U.S. Federal Geographic Data Committee 2008, Jennings et al. 2009), they recognized 8 alluvial forest and 3 swamp forest vegetation types. The
3
Two previous studies provide evidence of changes in forest composition resulting from the regulated flow regime of the lower Roanoke. Rice and Peet (1997) compared overstory and understory tree species composition (large stems compared to small stems) in 136 Carolina Vegetation Survey vegetation plots (Peet et al. 1998, 2012) grouped by vegetation class. Similarities between strata were lowest in alluvial forests found on high ridges where floods had been eliminated or had become extremely rare. Saplings of tolerant oaks (Quercus lyrata, Q. laurifolia) and moderately flood-tolerant oaks (Q.pagoda, Q. phellos, Q. michauxii) were infrequent, but beech (Fagus grandifolia), a flood-intolerant species not observed in the overstory, was frequent in the understory. Many of these high ridges would have been inundated annually for brief periods in the pre-dam era. Even short-duration floods can inhibit the encroachment of flood-intolerant upland species (Townsend 1997). Canopy-understory similarity was also low in forests on alluvial flats that flood for much longer duration under the managed flood regime than prior to construction of the dams. The low sapling recruitment rate was concluded to be insufficient to maintain most tree species with significant canopy presence (i.e., >10% relative basal area) with the exception of red maple (Acer rubrum). Rice and Peet concluded that shifts in vegetation composition on high ridges and alluvial flats were likely due to prolonged growing-season flooding on the flats and lack of flooding on the ridges. Townsend (1997, 2001) corroborated these findings. This evidence suggested a critical need for further study of regeneration patterns in relation to the inundation regime across a broad spatial extent in order to anticipate trajectories of the forest composition and structure over time.
4
strategy for hydropower generation where water is released through the turbines when demand is highest) conducted at Roanoke Rapids also has the potential to affect the frequency and duration of floods (Pearsall et al. 2005). In 1999, congressional authorization was granted for a study to evaluate the continued operation of Kerr Dam to mitigate potential impacts on the downstream ecosystem.
According to the Reconnaissance Report from the US Army Corps of Engineers (USACE), the federal oversight agency for Kerr, an economically viable solution to the reoperation of Kerr Dam for the benefit of the system downstream is likely. The feasibility study began in 2001 and was scheduled to be
completed in 2008. As of 2014, the study is ongoing.
The relicensing process overseen by the Federal Energy Regulatory Commission has been completed for the Roanoke Rapids dam. Dominion, the owner and operator of the dam, opted for the new strategy of Alternative Relicensing Process (ALP) which requires stakeholder and licensee
cooperation to reach a settlement. Under the terms of the settlement, Dominion and the stakeholders are committed to an adaptive management plan to document and mitigate effects of Dominion’s hydropeaking. The results and conclusions of this dissertation are intended to inform both processes. Objectives
5
Due to the conservation value of this system, multiple studies have been conducted to ascertain the effects of river regulation on the system as a whole. However, fine-scale data linked to broad-scale patterns, particularly in the interaction between regeneration and flooding across multiple gradients, are needed to accurately inform management of the lower Roanoke floodplain. The motivation for my research was to inform a specific application--conservation of the bottomland forests of the lower Roanoke River floodplain. However, the questions addressed in this dissertation are likely applicable to other rivers in the Southeast, both regulated and unregulated. Regionally, rivers have similar species composition, spatial gradients and soil types. Flooding complexity will vary depending on the size and floodplain attributes of the river, but the relationship between regeneration and flooding should be generalizable. This research also has broader implications, both theoretical and applied, in multiple sub-fields of ecology (e.g., plant, landscape, riparian, disturbance, conservation, and restoration ecology), environmental management, and hydrology. For example, this research addresses how changes in disturbance regimes impacts forest regeneration and the potential consequences over time; a core question for disturbance and restoration ecology. I explore the relative importance of the various dimensions of the flood regime on the success of regeneration, which can be compared to patterns on floodplains in other regions. I address the usefulness and limitations of hydrologic models and the complexity of the relationship between floodplain hydrology and stream flow. These are examples of some of the broader implication of the following chapters.
In Chapter 2, I describe changes in the flood inundation regime due to river regulation, including frequency, duration, and timing for incremental changes in discharge by comparing average daily pre- and post-dam US Geological Survey (USGS) stream-gage data. I use a previously developed flood
6
installed on the floodplain. This was done to determine which flood variables are most informative at different spatial and temporal scales.
Chapter 3 documents the hydrologic effects of hydropeaking on flooding in the context of the management of the flood control dam. Combining the flood model predictions and the
water-monitoring gage data, I compare the hydrograph during peaking, non-peaking, and flood-control releases to the response in the water-monitoring wells. These data allow me to clarify the interactive effects of flood-control and hydropeaking activities.
The objective of Chapter 4 is to document the relationship between fine-scale floodplain hydrology and seedling dynamics, and to provide an assessment of how these findings scale up to landscape-level trends in forest composition.
In Chapter 5, I assess forest changes over time due to river regulation. I develop models to predict trajectories of the floodplain forest change over broad spatial scales. I then use long-term data on forest composition and structure to assess the degree to which the projections of long-term change are consistent with observed change.
In Chapter 6, I review and interpret the conclusions of the prior chapters to provide a holistic view of the combined impacts of hydropower and flood control dams on the flood regime, the relationship to seedling regeneration, and an assessment of the potential long-term consequences. Significance
7
al. 2009a). The present research builds on prior work by comparing changes in flooding at fine-scales and provides evidence to quantify the contribution of multiple dams on flooding. These detailed flooding data enabled documentation of the spatio-temporal extent of alteration in tree seedling dynamics across a range of species, particularly in the context of lateral and longitudinal gradients in fine-scale patterns of flooding. I also examined the relationship between discharge at the Roanoke Rapids gaging station to the fine-scale hydrology data under different scenarios to partition the relative impacts on the downstream hydrology of a flood-control dam with high storage capacity and a
hydropower dam with much less storage capacity. Using this information, I built models to predict potential trajectories of the forest change over time and developed a spatially explicit index of deviation from pre-dam flooding. This work is significant in that it not only provide critical information that can be used for mitigating effects of regulation on the Roanoke, but can be applied for assessment of
8
CHAPTER 2: RIVER REGULATION AND ITS IMPACTS ON FLOODPLAIN HYDROLOGY: A CASE STUDY OF THE LOWER ROANOKE RIVER, NORTH CAROLINA
Introduction
The damming and regulation of large rivers is one of the greatest threats to the function of fluvial systems globally (Poff et al. 1997). In temperate areas, dams alter instream hydrology by attenuating peak flows and increasing the duration of moderate magnitude flows. This eliminates flooding at high elevations of the floodplain relative to the channel and increases the duration of floods in the lower-lying areas (Graf 2000). River regulation generally reduces the overall variability of flows and thereby homogenizes the hydrologic gradient to which the river and floodplain biota are exposed (Poff et al. 2007), though this is not always the case (McManamay et al. 2012).
Flooding, or more precisely the spatio-temporal variation in flooding, is the master variable driving floodplain processes such as hydro-geomorphic dynamics, forest succession, and nutrient dynamics (Hupp 2000), but establishment of a clear linkage between flow alteration and ecological response has remained elusive. By changing the flow of water, sediment, nutrients, energy, and biota, dams interrupt and alter many of the important ecological processes on the downstream floodplain. Consequently, the damming and subsequent regulation of rivers degrades the ecological functioning of these systems (Poff et al. 1997).
9
LiDAR data in a geographical information system (Kufer et al. 2013 and others), but few have assessed the changes in the flood regime resulting from river regulation across the hydrologic gradient at fine scales (see Townsend and Walsh 2001). These changes are difficult to quantify because for many rivers data on pre-dam hydrology is not available. Some studies have compensated for this deficiency in available data by comparing unregulated and regulated reaches of the same river or even different rivers. The confounding factors in the latter approach make this method far from ideal (McManamay et al. 2012). Changes in the flood regime can be most accurately assessed using pre- and post-dam stream-gage data in combination with a flood inundation model.
Mitigating the ecological impact of dams requires a detailed understanding of the changes in river hydrology and floodplain inundation dynamics. With this information biological data can be directly linked to fine-scale hydrologic processes and thereby enable the formation of concrete objectives for dam management designed to lessen the impact of river regulation (Poff et al. 1997, Poff et al. 2010, Poff and Zimmerman 2010).
10
multivariate, I combine the relative change in each variable into an index of hydrologic stress using Principal Components Analysis (PCA) and link this index to the GIS. I then assess homogenization (i.e., whether variability was reduced) due to river regulation. Finally, I examine the accuracy of the flood model to assign the flow magnitude necessary to inundate at fine-scales and analyze whether flood magnitude is sufficient to determine the frequency and duration of floods at that scale. This work increases understanding of the linkage between altered river hydrology and floodplain inundation on the lower Roanoke River and provides a framework for assessing the effects of dams on other regulated rivers.
Methods Study area
The Roanoke River has a total drainage area of 25,220 km2. It originates in the Ridge and Valley Province of Virginia and flows through the Virginia Piedmont and into North Carolina where it crosses the fall line onto the Coastal Plain. The Coastal Plain segment, here referred to as the lower Roanoke River, is a 220 km segment that flows over Miocene sedimentary material overlain by Quaternary alluvium from the fall line to the Albemarle Sound (Brown et al. 1972) (Figure 1). The region is characterized as a humid sub-tropical environment with long humid summers and warm winters. On average the watershed receives 120 cm precipitation yearly and the mean annual temperature is approximately 15.5° C. Soil texture varies with topography: loamy to silty-loam fluvial deposits in the backswamps with slightly sandier loam on levees to sandy loam on high terraces.
11
Richter et al. 1996, Townsend 2001, and Pearsall et al. 2005). Richter et al. (1996) used pre- and post-dam USGS streamgage data to develop a method to quantify changes in instream hydrology: Indicators of Hydrologic Alteration (IHA). Townsend (2001) examined changes in floodplain hydrology using a flood inundation model. The operation of the dams has significantly changed the hydrologic gradient on the floodplain, most notably by eliminating large, short-duration flood events, increasing the duration of moderate and small floods, and extending flooding later into the growing season (Townsend and Foster 2001). This broad-scale examination of changes in instream and floodplain hydrology is useful for developing hypotheses of the effect on physical and biological processes.
12
Despite these ongoing changes in sediment dynamics, there is considerable lateral diversity in landforms that increases from the upper to middle reach and declines downstream (Hupp et al. 2009b). The floodplain is underfit, meaning that the floodplain is broader than is expected under the current hydrologic regime (Leopold et al. 1964, Hupp 2000). In the upper reaches, the floodplains are narrow relative to the middle and lower reaches with high levees and a constricted backswamp. In the middle reach, the geomorphic variation increases as levees grade into backswamps with alluvial flats and ridge-and-swale landforms between. In the lower reach, landform diversity decreases to two types: low levees and expansive backswamps.
The flood regime across the hydrologic gradient on the floodplain cannot be forecast using stream flow because movement into, out of, and though the internal drainage network on the
floodplain is complex. Therefore, to describe changes in the flood regime across the gradient, I used the average daily discharge calculated from USGS streamgage data recorded at Roanoke Rapids (USGS 02080500 ROANOKE RIVER AT ROANOKE RAPIDS, NC) to characterize change in stream flow in the channel from the pre-dam period of record (1912—1950) to the post-dam record (1964—2009). Then I used an inundation model developed by Townsend (1997) based on eleven Radarsat-1 SAR images covering the entirety of the lower Roanoke River floodplain to determine the relationship between river discharge at Roanoke Rapids and flooded area downstream as the response variable for a power law function relating discharge to area flooded. From the model, an ArcGIS flood model extension was created that directly links the interface to spatially represent the extent of floods of different
13
feet per second (cfs)1 increments from 5,000 cfs to 35,000 cfs, and then 5,000 cfs increments from 35,000 cfs – 100,000 cfs. The floods were initiated after a discharge of that magnitude or higher for 5 days as this duration was sufficient to result in a flood in water monitoring gages distributed across the floodplain. I used the composite flood inundation model (Townsend 2001) to link the hydrologic variables to the pixels based on the pixel-specific inundation discharge. This enabled mapping of each variable individually. I used spatial statistical tools in ArcGIS to calculate the absolute (post-dam – pre-dam) and relative (post-dam – pre-dam/pre-pre-dam) change for each variable. Using these data, I developed a multivariate index describing change in flood dynamics across the active floodplain. Index of post-dam divergence of the flood inundation regime
Using Principal Components Analysis, I examined the spatial variation in the inundation regime among the inundation discharge zones pre- and post-dam. I selected for use in the PCA eight of the 26 variables that describe average, cumulative, and maximum frequency and duration both annually and during the growing season as well as return interval (Table 1). Correlation addresses relative variability of the relationship between the variables because input data have been normalized to a zero mean and unit variance. Therefore, correlation is a dimensionless similarity metric appropriate for comparing variables with different units or scales. I examined the correlation of the first two axes with the inundation variables. I then drew trajectories between pre- and post-dam inundation magnitudes and calculated the slope of the trajectory from the pre-dam position to the post-dam position for each inundation magnitude in order to create an index of deviation describing the direction and the magnitude of movement along the axes. The correlations of the variables with each axis describe the composite change in the inundation regime. Multiple sets or combinations of flood variables could be used for this analysis depending on the question of interest.
1
14
In order to visualize the change at the landscape scale in the relationship between pre- and post-dam magnitudes, I linked the slope of the trajectory to a GIS. I assigned the flood magnitude for each 30 x 30 m pixel from the flood inundation model described previously. The slope of the trajectory for each inundation discharge zone was calculated as the difference in the position of the post- to pre-dam magnitude on PC2 divided by the difference between the position of post and pre-pre-dam magnitudes on PC1. The slopes of the trajectories were mapped for the portion of the lower Roanoke River
floodplain that would flood at a discharge magnitude < 20K cfs. This provides a visualization of the composite change in the duration of floods (average, maximum, and cumulative), average flood frequency, and return interval in both direction and magnitude.
Water-level monitoring gages
To assess the accuracy of the flood inundation model used for the above analyses, I installed 50 in situ surface level Troll gages to a depth of 1.5 feet below ground level on the lower Roanoke
floodplain in August 2007. These gages measure pressure and temperature at specified intervals, in this case every hour, and convert to depth of water over the device. The accuracy of these gages is ±0.01ft (http://www.in-situ.com/products/water-level/level-troll-family/level-troll-700h-instrument). The measurements were corrected for variation in barometric pressure using two Barro-Troll gages placed at equidistant intervals between the longitudinal distributions of the water gage locations within the study region of the Roanoke River. Data were downloaded using the Rugged Reader (InSitu Inc,
15
with high spatial variability in landforms. Most of the gages were still functioning at the end of this project and as a consequence more data than reported here are available. The locations of the gages are shown in Figure 20.
I used the water-monitoring gages as well as site visits to access the accuracy of the composite flood model (Townsend and Foster 2001). I compared 40 of the water monitoring gages, the hourly data from 2007-2010 and hourly discharge rates from Roanoke Rapids dam to assess the accuracy of the assigned inundation discharge class by isolating flood events in each gage. I then extracted the prior 1, 3, and 5-day average daily discharges. If the values differed, I used the larger of the values for a
16 Results
Changes in hydrology from flood model analysis.
All five dimensions of the flow regime have been altered by dam construction. This includes the return interval (number of days between flood events), frequency, duration, timing and rate of change (Richter et al. 1996). My goal was to demonstrate the change in the various dimensions of the flood inundation regime in order to develop a multivariate visual representation of the degree of alteration across the hydrologic gradient.
The difference between the pre- and post-dam flood variables increased with increasing inundation magnitude. That is, the greater the flow magnitude necessary to flood an area of the floodplain, the greater the difference between pre- and post-dam flood regime. In general, the return interval and duration increased and the frequency decreased along the hydrologic gradient. There are caveats for each of the flood variables, however, primarily that the areas that flood at the lowest magnitudes often had opposite trends. For areas of the floodplain that would flood due to flows less than 12,000 cfs, the return interval has not changed significantly. The divergence between pre- and post-dam return interval increases from 13,000 to 20,000 cfs (Figure 2), which is the typical maximum flow release from Roanoke Rapids (Figure 3). It can be assumed that the divergence of the return interval for larger magnitude floods (up to 35,000 cfs) continues to increase.
The change in annual frequency and growing-season frequency of flood events is similar to the change in return interval with the exception of the lowest areas of the floodplain. For inundation
17
growing-season flood events. In areas that flood at 12,000 cfs and higher, the frequency of events is lower and divergence increases.
The proportional difference in the growing season frequency of floods increased in the wettest zones, but decreased as the inundation magnitude increased. The proportional change for growing-season events ranged from 0.5 to 0.13 for discharge magnitudes between 5,000 cfs and 8,000 cfs, and from -0.01 to -0.5 for discharge magnitudes between 9,000 cfs and 20,000 cfs (Figure 4). Flood duration increased for all flood magnitudes above 5,000 cfs. During the growing season, the duration for most discharge magnitudes is 1 to 5 times longer compared to pre-dam (Figure 5). Growing-season flood durations (Figure 6) were longer than floods at other times of the year. This was evident from the higher average duration during the growing season compared to the annual average duration (Figure 7). In general, the deviation increased with increasing flood magnitude for both growing-season and annual average. However, this is the average duration of an event for those years when an event occurs. A 20,000 cfs event does not occur in all years, but when it does it is typically much longer in duration due to the USACE Kerr Water Management Plan and water release rules that govern flood releases.
Although cumulative growing-season duration of flooding is not considerably different on average, the maximum cumulative duration in the post-dam era has increased from 50 to 150 days depending on the magnitude (Figure 8). In addition, the timing of the events has shifted a month later into the growing season (Figure 9) (Townsend and Foster, 2002).
Index of flood deviation
18
growing-season maximum, and growing-season cumulative and maximum averages. Growing season frequency was also negatively correlated but not as strongly as the others. The post-dam inundation magnitude was always lower on PC1 compared to the pre-dam position reflecting increased flood duration in each zone overall. Pre-dam inundation magnitudes have consistently high values on this axis and low variance. Therefore, the scaled flood variables were more similar between inundation
magnitudes pre-dam indicating that flooding was more similar between these zones pre-dam. PC2 discriminates between the post-dam flood magnitudes. PC2 was strongly negatively correlated with variables describing average duration including average, annual average, and growing season average. Return interval was negatively correlated and average frequency is positively correlated. For inundation magnitudes <10,000 cfs the position on this axis either increased or remained relatively constant
between pre- and post-dam. For inundation magnitudes >10,000 cfs, the position on PC2 was lower. The magnitude of the difference increases from 11,000 cfs to 20,000 cfs.
In summary, the pre- to post-dam shift in inundation magnitude on PC1 illustrated the change in the maximum and cumulative flood duration and growing season frequency. This was the case for all zones of the floodplain. The change in position on PC2 demonstrated the decrease in average duration and return interval and increase in average frequency in the wettest zones (<8,000 cfs). For all other zones (9,000 – 20,000 cfs) the average duration and return interval increased and the frequency decreased. The magnitude of the change increased with inundation magnitude.
19
magnitude of the value represents the distance between the post- and pre-dam position and indicated the degree to which the inundation magnitude has shifted, particularly on PC2.
Evaluating flood model predictions
Some areas of the floodplain have similar inundation patterns as a result of typical thresholds in dam releases. Therefore, the 1,000 cfs intervals were placed into bins. I grouped areas that were predicted to flood at: 1.) <10,000 cfs (<10k) ,2.), >10.000—<12,000 cfs (11-12k), 3.) >12,000-<14,000 cfs (13-14k), 4.) >14,000-<20,000 cfs (15-20k), and 5.)>20,000 cfs (>20k). The labels in parentheses are used for reference in this and subsequent chapters.
From site visits during the June 2009 flood control release, sixteen sites that were predicted to flood at a discharge less than 20,000 cfs were not inundated, so those sites were moved from the 15k-20k to the >15k-20k bin. Six sites that were inundated were moved from the >15k-20k to the 15-15k-20k cfs bin. By moving these sites, the correlation improved considerably (Figure 12), yet there is still unexplained variation in flood duration for a given inundation discharge (Figure 13, Figure 14).
Not only is the duration of flooding inconsistent for a given inundation discharge, but also for a given gage at the same discharge for the same duration. Water depth in gages after 6 days at 20,000 cfs in January compared to 6 days in June 2009 were different for many gages (Figure 15). The depths, when different, tended to be lower in January, but several were higher.
20 Discussion
Changes in hydrology
Current operations exchange the historic regime of frequent, short-duration flood pulses for infrequent, long-duration flood events of lower potential maximum flow. For low magnitude flood events (<8,000 cfs), the frequency of flood events increased as well as duration (growing season and maximum), but not return interval. The divergence was moderate compared to higher-magnitude events. For flood events >9,000 cfs, the annual frequency has decreased and the return interval has increased. When floods occur, they are of much longer duration. This deviation increased with increasing discharge magnitude for events up to 35,000 cfs (data are presented for discharge up to 20,000 cfs). This is most notable for growing-season flood events, which are as much as 5 times longer than pre-dam.
In the situation on the Roanoke the combination of decreased frequency and increased duration (intensity) of the floods between 10,000 and 20,000k (and higher) likely creates considerable stress on the plant community for a significant portion of the floodplain. In the years when the long-duration floods do not occur, the environment selects for a certain suite of species that are not likely to be adapted to the long-duration floods that occur in wet or even moderately wet years, whereas in wet years selection is for flood-tolerant species; very few species compete well in both circumstances. Tree seedlings are the most vulnerable stage due to their low statue as mortality increases when the flood exceeds the height of the apical meristem (Grubb 1977, Kozlowski 2002a,b).
The inundation regime has multiple dimensions (e.g., frequency, duration, and extent of
21
variables and the change in the relative importance of flood variables pre- and post-dam. This holistic view is useful because it is likely the interactive effect that drives physical and biological processes on the floodplain. For example, in a recent meta-analysis on the effects of flow alteration on biological process, the most studied variable and the most predictive variable was flow magnitude (Poff and Zimmerman 2010). As was demonstrated, flood magnitude is a proxy for multiple dimensions of the flood regime. The fact that flood magnitude is most predictive compared to simply frequency or duration illustrates the interactive effect of the multiple dimensions. A multivariate analysis using flood magnitude as the response variable enabled assessment of how the other dimensions varied and interacted with magnitude.
A multivariate index provided a means for differentiating unique areas of the floodplain (i.e., inundation magnitude zones with different flow regimes) and identified the variables that drive the difference. For example, the maximum duration of floods was highly correlated with PC1. Average flood duration, average frequency, and return interval were highly correlated with PC2. With the exception of the wettest inundation zones, maximum duration of floods varied little between the pre- and post-dam among inundation zones as was demonstrated by the similar position of post-dam magnitudes on PC1. In contrast, the inundation magnitudes lay on a gradient along PC2 from low to high reflecting the variation in average duration, average frequency, and return interval as flow magnitude changes. From these trends, I concluded that it is not the cumulative or maximum duration and frequency, but rather the averages that differentiate the flood magnitude zones post-dam. Differential change in processes between the zones was the result of the difference in average duration and frequency, while processes that changed consistently were due to change in maximum duration and frequency. This tool provides a broader prospective of the complexity of the effect of river regulation across the inundation gradient.
22
most extreme in the intermediate zones of the floodplain as wetter areas became wetter and drier zones became drier resulting in homogenization of the flood regime as variability declined. The conclusion is that river regulation causes a squeeze-effect where the wettest and driest zones of the floodplain expand and the intermediate zones are compressed. It is obvious that the scale of
23
zones would likely be obscured. However, for the purposes of flow management to mitigate the physiological, geomorphic, and biological impacts of regulation within societal and economic restraints that often stall adaptive management of river flows, it is more important to assess what is happening in the current active floodplain. There are likely thresholds within the intermediate zones, or particular combinations of variables that are most relevant to this endeavor.
Analyses of flood model predictions
Flood inundation models are used to assess the overall change in the extent, frequency and duration of flooding due to river regulation, but these models are not typically designed to quantify the flood inundation regime at fine scales. The results of this study revealed the complexity of the effects of river hydrology on the floodplain inundation regime that were not predicted from the flood inundation model. First, there is a necessary relationship between inundation discharge and flood duration, but inundation discharge predictions from the developed flood model alone were not sufficient to fully predict flood duration. Models are generalizations based on the resolution of the data. However, models are rarely used to attempt to provide spatially explicit information at fine scales unless the a priori use of the model demanded this precision (Hunter 2007). If fine-scale data are needed after model
development, water monitoring gage sites can be selected to capture the gradient. From site observations and gage data collected over the course of the study, it was apparent that floodplain hydrology is more complicated than the model assumed. This appeared to be due to the interaction between discharge magnitude and duration, antecedent groundwater conditions, precipitation in the watershed, and site conditions such as lateral and longitudinal landscape position and soil texture and organic matter content.
Some areas of the floodplain are more connected to the channel than others, and consequently the number of days of a given duration it took to reach maximum depth for a magnitude varied.
24
quickly as expected from the flood inundation model; floods increased in water depth as duration increased. Flood extent and depth increased for up to one month in some gages. During the June 2009 flood control release, depth in gages continued to increase for 16 days (the duration of the release) in most gages (Figure 19). Floodplain position, distance downstream, and antecedent soil conditions likely modified the response. The composite flood model (Townsend and Foster 2002) assumes a 10-day average to initiate a flood event of a given magnitude. The observation that floods increased in extent and depth when the flow remained constant, potentially up to one month, has important implications for both this study and the broader management of the lower Roanoke River.
I conclude that the accuracy of predicted flooding patterns for sites is low unless associated with water-monitoring gages. Although the flood inundation model provides a reliable indication of overall landscape patterns, it is not precise enough to obtain annual flooding patterns at individual point locations. This observation, combined with the variation in the duration of flooding with similar
25
CHAPTER 3: EFFECTS OF HYDROPEAKING ON FLOODPLAIN INUNDATION ON THE LOWER ROANOKE RIVER, NC
Introduction
26
The effects of river regulation on hydrology are well documented, but the linkage between hydrology and the floodplain inundation regime (i.e., the frequency, duration, timing, and rate of change for different magnitude floods) is less understood. Flood control dams have a large impact on
downstream flooding due to the storage capacity behind the dam. However, during peaking, the increase in water released from the hydropower dam can affect river stage downstream (Pearsall et al. 2005). The exact distance had been a subject of debate (Graham and Conner 2000). The working hypothesis is that the increase in river stage can push water into the floodplain via rising groundwater through lateral flow and thereby inhibit water drainage off the floodplain if peaking is continued for several days. When the floodplain is inundated, the potential for this effect is higher due to the high connectivity between the water in the channel and water on the floodplain via groundwater. Because there has been little if any study of the effects of hydropeaking on the flood inundation regime, this reasoning has been merely speculative. However, one study does provide preliminary evidence that the reallocation of water due to hydropeaking can drive water into the floodplain (Pearsall et al. 2005).
Documenting the independent and interactive effects of hydropeaking and flood control is challenging because flooding is dependent on fine-scale geomorphology, floodplain position, and antecedent conditions. In order to determine the fine-scale spatial effects of river hydrology on
floodplain inundation, precise measurements of the water response on the floodplain are needed. Flood models typically used to predict floodplain inundation are not sufficient for this purpose. These models can provide an approximation of flooding in response to flow, but they are often based on other models themselves. In that regard, they are useful for landscape-level assessment of floodplain inundation, but they do not provide the resolution needed for linking the flood regime to spatially explicit processes. Another limitation of flood models is an inability to partition the effects of multiple dams.
27
The lower Roanoke River , a brownwater Coastal Plain river in the southeastern United States, provides a case study for this approach. The floodplain forest associated with the LRR is one of the largest and least fragmented bottomland systems on the Atlantic Coastal Plain (Lynch 1981). In 1950, four dams were commissioned on the Roanoke River, three of which are positioned just above the Fall Line, but only two are relevant to this study. The upstream dam is the largest of the three dams and is operated primarily for flood control (Kerr operated by USACE), whereas the third dam is primarily for hydropower generation including use of hydropeaking when conditions are appropriate (Roanoke Rapids operated by Dominion).
The purpose of this study is to determine how hydropeaking affects the floodplain inundation regime in the context of flood control. Using a previously developed flood inundation model, locations potentially impacted by the interaction of flood control and hydropeaking were identified to install water-monitoring gages. A comparison of the hydrograph during peaking, non-peaking, and flood-control releases to the response in the water-monitoring gages was used to clarify the interactive effects of flood-control and hydropeaking activities. I hypothesized that within-week peaking would increase flood duration in low-lying areas of the floodplain, particularly when the floodplain was saturated or partly inundated. When the floodplain is saturated, hydrologic connectivity between the river and the floodplain is high. This should reduce the time it takes for the floodplain water to respond to rapid water fluctuations.
Study area description
28
the upper and middle reaches between Halifax and Jamesville, NC (Figure 1); the lower reach is not included as it is tidally influenced and is much less likely to be impacted by river regulation which should have damped out by the time the pulses of water reach this part of the river.
The lower Roanoke River is a high conservation priority. The river system provides habitat for a diverse suite of species, several federally or state listed, and a mosaic of vegetation types that are designated as exemplary by the North Carolina Natural Heritage Program. Conservation organizations, as well as federal and state management agencies, are concerned for the long-term sustainability of the diversity and function of the system owing to the presence of the upstream dams. The operation of the dams has significantly increased the duration of flooding, potentially suppressing regeneration on the floodplain of bottomland hardwood forests located on levees, flats, and ridges as well as brownwater swamp forests that occur in the low lying regions. In order to reduce the effects of river regulation on the floodplain, the contributions of the individual dams needs to be understood, particularly as they impact these diverse habitats.
Methods
Water well response was compared to water-monitoring-gage data during peaking and non-peaking periods during the growing and non-growing seasons. I examined the response to non-peaking after flood control releases from Kerr when the floodplain was inundated. This enabled the effects of
hydropeaking to be assessed in the context of flood control releases. In addition, I compared the hydrograph and gage response to rainfall data to assess the impact of precipitation on the independent and interactive effects of hydropeaking, flood control, and precipitation.
29
2008, 2009, and 2010. However, the increase in water depth in a gage lags behind the increase in discharge at Roanoke Rapids due to travel times associated with the downstream distance from the dam and the distance of the gage from the channel with the consequence that it was necessary to correct for the time lag. This was complicated because the gages are located at different distances from the
Roanoke Rapids stream gage and different positions relative to the channel. Consequently, each water-monitoring gage has a different time lag.
Cross correlation analyses (Crawley 2007) examine the covariance between two time series at different time lags by shifting the series one unit at a time until a specified maximum was reached; the maximum lag was 200 hours (8 days). This analysis was conducted by year using a growing-season peaking interval, a non-growing-season peaking interval, and a non-peaking interval. This was done for different intervals associated with non-peaking and peaking (Table 1, Table 3). During the growing season, peaking is only permissible prior to April 15 and after June 15 due to the releases mandated during the spawning season to increase the population of commercially valuable fish such as striped bass. Water fluctuations during this interval are minimal compared to other times of the year (USGS 02080500 ROANOKE RIVER AT ROANOKE RAPIDS, NC).
Peaking has the potential to change the correlation between water monitoring gage reading and discharge because the time lag in gage response typically is significantly longer than the peaking
interval. The maximum correlation for each gage for the period each year (2008-2010) during which peaking occurred was calculated. Yearly peaking intervals (PI) were defined by examining the hourly discharge records from the gage at Roanoke Rapids (USGS 02080500; Table 1).
30
times. PI correlation to this distribution was compared. If the PI correlation had a very low probability compared to the generated distribution, the gage was classified as impacted for that year. The p-value cutoff was <.01 for impact/non-impact. The growing season interval was the primary focus, but for comparison, the impact from one non-growing season was calculated.
Results
The effect of peaking on floodplain hydrology is to increase the duration of flooding once the floodplain is inundated. The mechanism is fluctuation in instream flow between volumes that are sufficiently low to allow drainage and those that are not. There is an interaction with rainfall, but the effect of even a large rainfall event is minimal as groundwater and flood depth did not respond to isolated events during non-peaking periods. It was only during peaking that an effect was observed, but the long lag time suggests an interaction with groundwater due to rising instream flow and the degree of hydrologic connectivity between the inundated floodplain and stream flow. In a comparison of three gages located on Wide Levee in the middle reach between Hamilton and Williamston (see Figure 19), during peaking and non-peaking intervals following a similar discharge event, water drained much more slowly during the peaking interval (Figure 16a, b. The difference between water drainage off the
31
Therefore, while precipitation may interact with peaking to increase drainage time, the effect of peaking is much more pronounced. I could not test the effect of the interaction due to the limitations of the dataset. This would have required modeling runoff or gage data for a period of growing season peaking after flood control without precipitation and the inverse scenario, precipitation without peaking.
32
When the floodplain was inundated, I observed that large rainfall events could cause
fluctuations in stream flow resulting in an increase in flood depth on the floodplain. There was usually a time lag. Average daily discharge and the absolute range in daily discharge (i.e., the difference between daily maximum and minimum release) was used as a measure of the fluctuations due to peaking (as evidenced by high daily range in the average daily discharge and the absolute range of daily discharge; see Figure 22). In the lower panel, precipitation is plotted in comparison with the gage patterns. Note the 1” rainfall event on June 14, 2008 (day 17 of the non-peaking interval for comparison with Figures 17 and 18 above) did not result in water level fluctuations in the gage. There was a discharge spike of 12,000 cfs on that day, but the overall daily average was little impacted. The large rainfall that occurred on July 5, 2008 was associated with a spike in the gage, but this was correlated with peaking. Notice that the gage did not flood until 7 days after the rainfall event and after several days of peaking. This
illustrates the way the effects of rainfall and peaking are interactive. Large rainfall events can cause fluctuations in water on the floodplain, but this occurs mostly because of peaking.
Taking a broader view of the average trends, Figure 23 illustrates the daily average patterns for discharge and water depth in a gage located in Big Swash (12_954; near Palmyra, NC) for the interval March 1 – September 30, 2009. Again, daily fluctuations in the gages closely follow average daily conditions, even during peaking times (July Sept). In 2008, the gage was dry (note depth of the gage is -1.5’). In 2009, groundwater was elevated by a combination of precipitation and peaking. Additional peaking without precipitation resulted in a flood. After more peaking days and rainfall, the gage flooded again. Once mean discharge fell below 5,000 cfs, the floodplain drained and did not respond to
33
occurred during this time that likely contributed to the slow drainage. From hourly data, many of the correlations during the peaking interval were significantly different from other random intervals, but typically only in 2009 (Table 2).
A significantly lower peaking effect identified using the permutation test described above could simply be a consequence of hydrologic change downstream being more damped (less instantaneous) than change at Roanoke Rapids. Daily averaging did improve the correlation between discharge and gage water depth during peaking. There were less significant difference, yet the correlation was still higher during random intervals of time compared to the peaking interval (Appendix 3).
Discussion
Hydropeaking in general, has been assumed by dam managers to have limited effect on floodplain hydrology. However, this hypothesis has been minimally tested and is assessment is non-existent in the literature. Comparisons of discharge from Roanoke Rapids with observations of water depths in monitoring gages provided strong evidence for the hypothesized peaking effect. I expected that within-week peaking increases flood duration in low-lying areas of the floodplain, particularly when the floodplain is saturated or partly inundated. This is because when the floodplain is saturated, less water can be absorbed by the soil. In addition, when the floodplain is partly flooded, the connection between water in the channel and water on the floodplain via the surface-groundwater interface and movement of water in the backswamp through guts and crevasses should reduce the time it takes for the floodplain water to respond to rapidly rising and falling river stage.
Previous work on the Roanoke River provided evidence that hydropeaking could cause flooding if the average daily flow rate is sufficiently increased due to within week reallocation of water (i.e., releasing more water on the days when demand is highest) (Pearsall et al. 2005). I did not find
34
peaking affects floodplain hydrology by prolonging flood duration when the floodplain is saturated or inundated.
Precipitation likely plays a role in the patterns observed, but the effects are apparent only during peaking periods. The results of this study suggest that concurrent precipitation prior to river stage increases due to peaking could be a mechanism for prolonged flooding and water-level
fluctuations in the gages during peaking. The data demonstrated that precipitation alone is not sufficient to account for the prolonged flooding and water level fluctuations in gages. Gage, daily discharge, and precipitation data indicate an interactive effect is the likely mechanism. It is more probable that there is an interaction between peaking and precipitation in that the combined effect of the two is greater than either the effect of precipitation or peaking alone. First, both peaking and rainfall increase river
discharge for brief intervals. It was only after several days in a row of peaking that the average daily discharge increased after a rainfall event. A large precipitation event (2.5”) after the initiation of peaking was associated with a rise in groundwater, but because the event co-occurred with peaking, it is not possible to determine the independent effect.
35
effects on floodplain hydrology are most pronounced when the floodplain is still saturated following a flood control release, especially when there is interaction between precipitation and peaking following flood control.
The most parsimonious conclusion has been emphasized, given the available data. Without controlled experiments, the independent effects of rainfall and peaking on floodplain hydrology remain unproven. However, I found no evidence in data from the observation period to suggest that local rainfall resulted in a flood when Dominion was not also peaking. When there is ample precipitation, peaking appears to be able to elevate groundwater levels, which then makes flooding from peaking more probable. However, local rainfall during the study period did not seem sufficient to initiate a flood due to the short duration of the events. Consequently, I conclude that the effect of peaking on
floodplain hydrology can be significant when the floodplain is saturated, and particularly when the floodplain is saturated coupled with large rainfall events.
It is beyond the scope of the study to completely tease this interaction apart. Three
recommendations for experiments to test this hypothesis are offered. First, Dominion, the owner of Roanoke Rapids dam, could increase the time between the end of the flood control step down and the initiation of peaking. Then, the water monitoring gage data could be assessed to determine if peaking resulted in flooding when the floodplain was dry. Secondly, Dominion could choose not to peak when large storms are expected and examine the gage data for fluctuations, comparing to intervals of both peaking and precipitation. Third, Dominion could experiment with lower magnitude peaking over a longer period during periods when normal peaking has demonstrated risks.
36
water quality on the floodplain, lowers productivity, and drowns seedlings inhibiting regeneration of forest tree species. The increase in flood duration during the growing season by both dams threatens the functioning and sustainability of the floodplain system.
37
CHAPTER 4: THE SPATIO-TEMPORAL DYNAMICS OF TREE SEEDLINGS IN RELATION TO HYDROPERIOD ON A REGULATED RIVER
Introduction
The flood regime (the frequency, duration, timing and magnitude of flood inundation) is the ‘master variable’ driving tree species’ distribution and floodplain forest composition (Ward and Stanford 1979, Poff et al. 1997, Graf 1999, Hupp 2000, Mitsch and Gosselink 2000, Nillson and Svedmark 2002). Variation in the flood gradient, particularly on the floodplains of large low-gradient rivers, is determined by variation in elevation by as little as a few centimeters. It follows that topographic heterogeneity on the floodplain increases the variety of niches that can support the diverse suite of species. However, tree species tolerance ranges broadly overlap, particularly in intermediate zones, limiting the predictability of forest composition in relation to the flood regime.
The effect of river regulation on the floodplain hydrology is variable across the flood gradient. In intermediate zones of the floodplain on low-gradient, regulated rivers, flood frequency is lower, but when flooding occurs it is of much longer duration, often at different times of the year compared to the unregulated flood regime. The extremity of the new flood regime is stressful for vegetation as the new regime is outside the conditions to which the species’ would have been subject prior to regulation. The working hypothesis is that the most detrimental change is the extension or altered timing of growing-season floods.
38
the ability of the system to absorb disturbance while maintaining structure (Holling 1973, Eisner et al. 2003)). More specifically, in the floodplain ecosystem, resilience is the degree to which the maintenance processes (e.g., seed production and dispersal to safe sites, intensity of flooding compared to species tolerances) are functioning. Catastrophic disturbances alter structure and composition, and perhaps drive dominance of the one or a few species that have adaptations to persist (Gunderson 2010).
Predicting change in floodplain forests is complicated. In general, there is a complex interaction between the spatio-temporal variation in flooding and species flood tolerances, which often overlap on rivers with large floodplains. This is particularly the case in the topographically diverse intermediate zones. As an individual ages, its tolerance to variation in flooding increases, adding to the complexity. This four-way interaction, the spatial and temporal variation in flooding, species specific tolerance, and ages of the individuals, limits the predictability of forest dynamics, even on unregulated river, much less on those subject to an altered flood regime where the flood regime and vegetation are in disequilibrium.
Since regeneration is the mechanism that maintains forest composition, regeneration dynamics (germination, establishment and survival) of species in relation to the flood regime is the best indicator of the likelihood of the forest to persist. Comparing the seedling layer and the mature canopy is a viable alternative, but does not necessarily predict how the forest will change over time (White et al. 1985). Consequently, knowing how different flood scenarios affect the survival of seedlings from germination to establishment is essential for developing models of forest change (Pearlstine et al. 1985). A more complete understanding of the relationship between forest dynamics and flooding is needed to effectively mitigate the effects of changed flood regimes and conserve the remaining extent of these highly-valued systems (Merritt et al. 1999, Nilsson and Svedmark 2002).