Body-mass index and all-cause mortality:
individual-participant-data meta-analysis of 239 prospective studies in
four continents
The Global BMI Mortality Collaboration*
Summary
Background Overweight and obesity are increasing worldwide. To help assess their relevance to mortality in diff erent populations we conducted individual-participant data meta-analyses of prospective studies of body-mass index (BMI), limiting confounding and reverse causality by restricting analyses to never-smokers and excluding pre-existing disease and the fi rst 5 years of follow-up.
Methods Of 10 625 411 participants in Asia, Australia and New Zealand, Europe, and North America from 239 prospective studies (median follow-up 13·7 years, IQR 11·4–14·7), 3 951 455 people in 189 studies were never-smokers without chronic diseases at recruitment who survived 5 years, of whom 385 879 died. The primary analyses are of these deaths, and study, age, and sex adjusted hazard ratios (HRs), relative to BMI 22·5–<25·0 kg/m².
Findings All-cause mortality was minimal at 20·0–25·0 kg/m² (HR 1·00, 95% CI 0·98–1·02 for BMI 20·0–<22·5 kg/m²; 1·00, 0·99–1·01 for BMI 22·5–<25·0 kg/m²), and increased signifi cantly both just below this range (1·13, 1·09–1·17 for BMI 18·5–<20·0 kg/m²; 1·51, 1·43–1·59 for BMI 15·0–<18·5) and throughout the overweight range (1·07, 1·07–1·08 for BMI 25·0–<27·5 kg/m²; 1·20, 1·18–1·22 for BMI 27·5–<30·0 kg/m²). The HR for obesity grade 1 (BMI 30·0–<35·0 kg/m²) was 1·45, 95% CI 1·41–1·48; the HR for obesity grade 2 (35·0–<40·0 kg/m²) was 1·94, 1·87–2·01; and the HR for obesity grade 3 (40·0–<60·0 kg/m²) was 2·76, 2·60–2·92. For BMI over 25·0 kg/m², mortality increased approximately log-linearly with BMI; the HR per 5 kg/m² units higher BMI was 1·39 (1·34–1·43) in Europe, 1·29 (1·26–1·32) in North America, 1·39 (1·34–1·44) in east Asia, and 1·31 (1·27–1·35) in Australia and New Zealand. This HR per 5 kg/m² units higher BMI (for BMI over 25 kg/m²) was greater in younger than older people (1·52, 95% CI 1·47–1·56, for BMI measured at 35–49 years vs 1·21, 1·17–1·25, for BMI measured at 70–89 years; pheterogeneity<0·0001), greater in men than women (1·51, 1·46–1·56, vs 1·30, 1·26–1·33; pheterogeneity<0·0001),
but similar in studies with self-reported and measured BMI.
Interpretation The associations of both overweight and obesity with higher all-cause mortality were broadly consistent in four continents. This fi nding supports strategies to combat the entire spectrum of excess adiposity in many populations.
Funding UK Medical Research Council, British Heart Foundation, National Institute for Health Research, US National Institutes of Health.
Copyright © The Author(s). Published by Elsevier Ltd. This is an Open Access article under the CC BY license.
Introduction
The worldwide prevalence of overweight and obesity is
high and is increasing.1,2 WHO estimates that more
than 1·3 billion adults worldwide are overweight, defi ned by WHO as a body-mass index (BMI) of 25–<30 kg/m², and a further 600 million are obese
(BMI ≥30 kg/m²).3 Appropriate analyses of large-scale
prospective studies with prolonged follow-up generally indicate that both overweight and obesity are associated with increased mortality, as is underweight (defi ned conservatively by WHO as BMI <18·5 kg/m²). However, it is not known how such associations vary across major global regions, an uncertainty relevant to international
strategies for overweight and obesity.4 Most previous
analyses have focused on people living in one particular
country or continent,5–12 even though associations with
overweight and underweight might diff er from one population to another.
Estimation of the relationships between BMI and mortality in various populations can help to assess the adverse physiological eff ects of excessive adiposity (and the adverse physiological eff ects of various determinants of low BMI). However, reliable estimates of the causal relevance of BMI to mortality need to limit the eff ects of reverse causality, because chronic disease and smoking can themselves aff ect BMI. To help achieve more valid estimates, prospective studies of BMI and mortality should, when possible, exclude: smokers, participants who already have some chronic disease at recruitment that could aff ect
BMI, and those dying within 5 years of recruitment.13–16
The Global BMI Mortality Collaboration was established to provide a standardised comparison of
Lancet 2016; 388: 776–86
Published Online July 13, 2016 http://dx.doi.org/10.1016/ S0140-6736(16)30175-1
See Comment page 734
*Members of the writing committee are listed at the end of the paper and a full list of investigators is provided in the appendix
Correspondence to: Prof John Danesh, Department of Public Health and Primary Care, University of Cambridge, Cambridge CB1 8RN, England, UK
associations of BMI with mortality across diff erent populations. It includes individual-participant data for 10·6 million adults in 239 prospective cohort studies in 32 countries, mainly located in Asia, Australia and New Zealand, Europe, or North America, about 4 million of whom were never-smokers without reported chronic diseases (mainly cardiovascular disease, cancer, or
chronic respiratory disease) at recruitmentand who were
still being followed up 5 years afterwards.
Methods
Search strategy and selection criteria
In 2013, over 500 investigators (appendix pp 49, 50) from over 300 institutions in 32 countries agreed an analysis plan for combining individual-participant data from contributing studies. This prespecifi ed analysis plan is provided in the appendix (pp 51–53). The goal was to produce reliable estimates of potentially causal associations of overweight and obesity with mortality using data from studies in several regions. The
prespecifi ed analysis methods were designed to
maximise the internal validity by reducing the scope for bias. This Article follows PRISMA for Individual Patient
Data reporting guidelines (appendix pp 54, 55).17
We sought data from large prospective studies (≥100 000 participants at baseline) or large multicohort consortia (total ≥100 000 participants at baseline). We identifi ed studies published from January, 1970, to January, 2015, through systematic literature searches and discussion with investigators (appendix pp 56, 57). Electronic searches were done with MEDLINE, Embase,
and Scopus, and with the terms ‘“body-mass index”, “mortality” or “death”, “cohort” or “prospective”, and combinations of the words “risk”, “relative”, “ratio”, “hazard”, or “rate”. Prospective cohort studies or consortia thereof were eligible if they: (1) had information about weight, height, age, and sex; (2) did not select participants on the basis of having any previous chronic disease; (3) recorded overall or cause-specifi c deaths; and (4) had accrued 5 years or more of median follow-up. We identifi ed only two eligible studies that were unable to
contribute (appendix p 37).18,19 Details of the included
studies are provided in the appendix (pp 3–14). The contributing studies classifi ed deaths according to the primary cause (or, in its absence, the underlying cause), on the basis of coding from the International Classifi cation of Diseases, revisions 8–10, to at least three digits (appendix p 15), or according to study-specifi c classifi cation systems. Ascertainment of outcomes was generally based on death certifi cates, supplemented in some studies by additional data.
The appendix (p 37) describes the inclusion and exclusion criteria. We excluded participants with a BMI of less than 15 kg/m² or 60 kg/m² or more, or baseline age younger than 20 years or older than 90 years. To limit residual confounding by smoking and bias due to eff ects of pre-existing disease on baseline BMI (ie, reverse causality), the primary analysis was restricted to never-smokers without specifi c known chronic diseases at baseline (eg, cardiovascular disease, cancer, or respiratory diseases), and omitted the fi rst 5 years of follow-up.
Research in context
Evidence before this study
A previous study has claimed that relative to normal weight (defi ned by WHO as a body-mass index [BMI] of
18·5–<25·0 kg/m²), overweight (BMI 25·0–<30·0 kg/m²) and grade 1 obesity (30·0–<35·0 kg/m²) are not associated with higher all-cause mortality. However, reliable estimates of the causal relevance of BMI to mortality should limit the effects of reverse causality, because chronic disease and smoking can themselves affect BMI. To help achieve such estimates, we established the Global BMI Mortality Collaboration, which involved analysis of individual-participant data from about 10·6 million adults in 239 prospective studies in 32 countries in Asia, Australia and New Zealand, Europe, or North America, about 4 million of whom were never-smokerswithout chronic disease at recruitment who were still being followed up at least 5 years afterwards.
Added value of this study
The Global BMI Mortality Collaboration has combined several features to help guide international public health policy. First, it involved a detailed and standardised comparison of the associations of BMI with mortality across prospective studies in
four continents. Second, this analysis has been comprehensive, entailing data from 97% of eligible participants in relevant prospective cohort studies. Third, the study further subdivided the WHO’s normal BMI range, which is excessively wide. Finally, the study’s approach should have reduced the potentially distorting eff ects of smoking and ill health on BMI because the primary analyses were of never-smokers without previous disease who survived at least 5 years.
Implications of all the available evidence
Statistical analysis
Associations of all-cause mortality with BMI depend not only on the associations of specifi c causes of death with BMI in diff erent regions (which might diff er quantitatively), but also on how relatively common each specifi c cause of death is in the particular region (which can diff er substantially by region and over time). Hence, the association of all-cause mortality with BMI might diff er in regions with diff erent underlying mortality patterns. Therefore, the prespecifi ed primary analysis was stratifi ed by fi ve major geographical regions, three with extensive data (east Asia, Europe, and North America) and two with more limited data (Australia and New Zealand, and south Asia). Data from some or all regions are shown separately, in the main text or in the appendix.
Each study (or consortium of studies) analysed individual-participant data according to a common analytical plan with SAS version 9.3 (SAS Institute, Cary, NC, USA) or Stata version 12 (StataCorp, College Station, TX, USA) provided by the coordinating centres. These
separate results were then meta-analysed at Cambridge University, UK. To facilitate standardised comparisons with other meta-analyses, we calculated hazard ratios (HRs) for mortality in the six WHO-defi ned baseline BMI categories: underweight (15·0–<18·5 kg/m²), normal (18·5–<25·0 kg/m²; the reference category for analyses of these six BMI groups), overweight (25–<30·0 kg/m²), and obesity grade 1 (30·0–<35·0 kg/m²), grade 2
(35·0–<40·0 kg/m²), and grade 3 (40·0–<60·0 kg/m²).20
Because, however, most people are of normal weight or overweight, these two categories were subdivided, yielding nine groups (15·0–<18·5 kg/m²; 18·5–<20·0 kg/m²; 20·0–<22·5 kg/m²; 22·5–<25·0 kg/m², the reference category for analyses of nine BMI groups; 25·0–<27·5 kg/m²; 27·5–<30·0 kg/m²; 30·0–<35·0 kg/m²; 35·0–<40·0 kg/m²; and 40·0–<60·0 kg/m²). The BMI group with the largest number of participants was chosen as the reference group.
Study-specifi c log HRs in specifi c BMI categories were pooled by inverse-variance-weighted random-eff ects
Underweight (15·0– <18·5 kg/m²)
Normal weight (18·5– <25·0 kg/m²)
Overweight (25·0– <30·0 kg/m²)
Obesity grade 1 (30·0– <35·0 kg/m²)
Obesity grade 2 (35·0– <40·0 kg/m²)
Obesity grade 3 (40·0– <60·0 kg/m²)
Crude analysis with no exclusions*
Participants/deaths 292 003/68 455 5 586 892/810 838 3 467 617/526 098 946 257/144 871 237 223/36 113 92 458/15 399
HR (95% CI) 1·82 (1·74–1·91) 1·00 (0·98–1·02) 0·95 (0·94–0·97) 1·17 (1·16–1·18) 1·49 (1·47–1·51) 1·95 (1·90–2·01)
Participants without known disease at baseline†
Participants/deaths 255 000/52 789 4 922 817/631 488 2 916 978/388 781 756 075/102 315 183 689/24 556 696 88/10 321
HR (95% CI) 1·81 (1·72–1·91) 1·00 (0·98–1·02) 0·95 (0·95–0·96) 1·18 (1·16–1·20) 1·52 (1·48–1·55) 2·05 (1·98–2·13)
Participants without known chronic disease at baseline, adjusted for smoking status‡
Participants/deaths 245 080/51 170 4 751 019/618 881 2 826 687/381 617 733 108/100 113 178 130/23 945 67 593/10 002
HR (95% CI) 1·70 (1·61–1·80) 1·00 (0·98–1·02) 0·99 (0·98–1·00) 1·25 (1·23–1·27) 1·63 (1·59–1·66) 2·24 (2·15–2·33)
Participants without known chronic disease at baseline, adjusted for smoking status, and excluding the fi rst 5 years of follow-up§
Participants/deaths 208 044/33 817 4 234 052/496 310 2 513 128/312 450 641 237/80 037 152 741/18 737 56 232/7 659
HR (95% CI) 1·60 (1·51–1·70) 1·00 (0·98–1·02) 1·03 (1·01–1·04) 1·31 (1·29–1·33) 1·70 (1·67–1·74) 2·36 (2·27–2·45)
The primary prespecifi ed analysis: never-smokers without known chronic disease at baseline—excluding the fi rst 5 years of follow-up¶
Participants/deaths 114 091/12 726 2 145 550/192 523; 1 250 103/130 293; 330 840/37 318 80 827/9 179 30 044/3 840
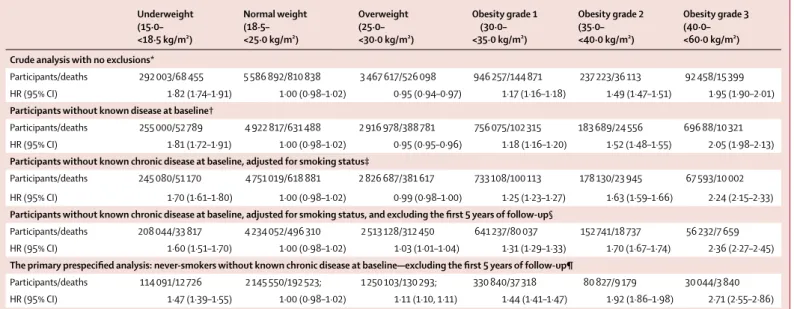
HR (95% CI) 1·47 (1·39–1·55) 1·00 (0·98–1·02) 1·11 (1·10, 1·11) 1·44 (1·41–1·47) 1·92 (1·86–1·98) 2·71 (2·55–2·86)
CIs were calculated with fl oating variance estimates (refl ecting independent variability within each group, including the reference group). Reference group is normal weight (18·5–<25·0 kg/m2). All analyses are adjusted for age and sex. Baseline BMI categories were defi ned by WHO. BMI=body-mass index. HR=hazard ratio. *237 studies; 10 622 450 participants; 1 601 774 deaths. †236 studies; 9 104 247 participants; 1 210 250 deaths. ‡234 studies; 8 801 617 participants; 1 185 728 deaths. §213 studies; 7 805 434 participants; 949 010 deaths. ¶189 studies; 3 951 455 participants; 385 879 deaths.
Table 1: Eff ects of successively stricter precautions against bias on analyses of six WHO defi ned groups of BMI versus all-cause mortality
15·0– <18·5 kg/m²
18·5– <20·0 kg/m²
20·0– <22·5 kg/m²
22·5– <25·0 kg/m²
25·0– <27·5 kg/m²
27·5– <30·0 kg/m²
30·0– <35·0 kg/m²
35·0– <40·0 kg/m²
40·0– <60·0 kg/m²
Participants/deaths 114 091/12 726 230 749/20 989 838 907/72 701 1075 894/98 833 821 303/84 952 428 800/45 341 330 840/37 318 80 827/9 179 30 044/3 840
HR (95% CI) 1·51
(1·43–1·59)
1·13 (1·09–1·17)
1·00 (0.98–1.02)
1·00 (0·99–1·01)
1·07 (1·07–1·08)
1·20 (1·18–1·22)
1·45 (1·41–1·48)
1·94 (1·87–2·01)
2·76 (2·60–2·92)
189 studies; 3 951 455 participants; 385 879 deaths. The primary prespecifi ed analysis in never-smokers without known chronic disease at baseline, excluding the fi rst 5 years of follow-up (with normal weight and overweight categories further subdivided into: 18·5–<20·0 kg/m², 20·0–<22·5 kg/m², 22·5–<25·0 kg/m², 25·0–<27·5 kg/m², and 27·5–<30·0 kg/m²). CIs were calculated using fl oating variance estimates (refl ecting independent variability within each group, including the reference group). Reference group is 22·5–<25·0 kg/m². All analyses are adjusted for age and sex. Baseline BMI categories were defi ned by WHO. BMI=body-mass index. HR=hazard ratio.
meta-analyses (an extension of the DerSimonian and Laird procedure) and plotted against the mean BMI value within each category. Sensitivity analyses used other statistical methods (eg, fi xed-eff ect models). To enable comparisons across BMI groups irrespective of the choice of a reference group, a fl oating variance estimate (refl ecting independent variability within each group, including the reference group) was attributed to each category using Plummer’s
method and used to calculate group-specifi c confi dence intervals.21
To estimate the BMI levels at which mortality risk was lowest (ie, the nadir), weighted linear regression yielded
the best-fi tting second-degree fractional polynomial
model relating pooled log HRs to pooled mean BMI levels (weighted by the inverse of the fl oating variance of the log HR), and the minimum of this polynomial was
Figure 1: Association of body-mass index with all-cause mortality, by geographical region
Boxes are plotted against the mean BMI in each group. The HR per 5 kg/m² higher body-mass index (BMI) and its 95% CI are calculated only for BMI more than 25·0 kg/m². Analyses restricted to never-smokers without pre-existing chronic disease, excluding the fi rst 5 years of follow-up. The reference category is shown with the arrow and is 22·5–<25·0 kg/m². CIs are from fl oating variance estimates (refl ecting independent variability within each category, including reference). Areas of squares are proportional to the information content (ie, inverse of the fl oating variance). HR=hazard ratio.
0·5 1·0 2·0 4·0 8·0
Hazard ratio
Overall
Studies 189
Participants 3 951 455
Deaths 385 879
HR per 5 kg/m2 1·31 (1·29–1·33)
European cohorts
Studies 89
Participants 1 135 600
Deaths 56 477
HR per 5 kg/m2 1·39 (1·34–1·43)
North American cohorts
Studies 40
Participants 1 415 087
Deaths 219 922
HR per 5 kg/m2 1·29 (1·26–1·32)
15 20 25 30 35 40 45
0·5 1·0 2·0 4·0 8·0
Hazard ratio
Mean body-mass index (kg/m2) Mean body-mass index (kg/m2) Mean body-mass index (kg/m2)
Australia and New Zealand cohorts
Studies 11
Participants 149 602
Deaths 4656
HR per 5 kg/m2 1·31 (1·27–1·35)
15 20 25 30 35 40 45
East Asian cohorts
Studies 46
Participants 1 074 385
Deaths 100 784
HR per 5 kg/m2 1·39 (1·34–1·44)
15 20 25 30 35 40 45
South Asian cohorts
Studies 3
Participants 176 781
Deaths 4040
the nadir. We assessed all-cause mortality and its main components, coronary heart disease, stroke, other cardiovascular disease, cancer, and respiratory disease (appendix p 15). HRs were calculated separately within each study with Cox regression models stratifi ed for baseline age and sex (appendix pp 51–53), with participants contributing from the baseline survey in crude analyses or from year 5 in the primary analyses. HRs in sex-specifi c and baseline-age-specifi c groups (and, when appropriate, by trial groups) were combined
across studies.22 To avoid over-fi tting of statistical models,
studies with ten or fewer deaths from a particular cause
were excluded from meta-analyses of that cause.23,24
Because the associations of BMI with mortality were approximately log-linear above a BMI of 25 kg/m², we calculated HRs per 5 kg/m² higher BMI increase by inverse-variance-weighted regression of the pooled log
HRs on mean BMI values in each category.17 For all-cause
mortality, we estimated population-attributable fractions for underweight, overweight, and obesity by combining
the proportional excess mortality (X0, X1, and X2, where
X=HR-1) in these BMI categories with the corresponding
prevalences (P0, P1, and P2, taken from Global Burden of
Disease25 region-specifi c prevalences). The
population-attributable fractions for overweight and obesity are then P1X1/k and P2X2/k, where k=1 + P0X0 + P1X1 + P2X2.
Between-study heterogeneity was quantifi ed by the I2 statistic.26 We
used two-sided p values and 95% CIs.
Role of the funding source
The funders of the study had no role in study design, data collection, data analysis, data interpretation, or writing of the report. SK, PG, EDA, and JD had access to all the data, and, together with SNB and FBH, were responsible for the decision to submit for publication.
Results
Of 10 625 411 participants from 239 studies (median
follow-up 13·7 years, IQR 11·4–14·7), 3 951 455 people in 189 studies were never-smokers without specifi c chronic diseases at recruitment who survived 5 years, of whom 385 879 died. To limit bias, the prespecifi ed primary analyses involved this restricted population. To avoid merging importantly diff erent risks, many of these primary analyses further subdivided the WHO-defi ned normal and overweight BMI categories, yielding nine BMI groups rather than six.
Table 1 shows the substantial relevance of successively stricter exclusions, going from crude analyses of about 10·6 million to prespecifi ed analyses of about 4 million adults. With BMI in only six groups, the whole range from 18·5 kg/m² to less than 25 kg/m² is the reference group, and HRs were: underweight 1·47 (95% CI 1·39–1·55), overweight 1·11 (1·10–1·11), grade 1 obesity 1·44 (1·41–1·47), grade 2 obesity 1·92 (1·86–1·98), grade 3 obesity 2·71 (2·55–2·86), and any obesity 1·64 (1·61–1·67; appendix pp 16, 17, 25). With normal and overweight groups more fi nely subdivided, however, BMI 22·5 kg/m² to less than 25·0 kg/m² becomes the reference group, and with this more precise reference group, the HRs for grade 1, 2, and 3 obesity increased
slightly (table 1, 2). Mortality was lowest in the
BMI range from 20·0 kg/m² to less than 25·0 kg/m², and was signifi cantly increased just below this BMI range and in the overweight range just above it (table 2).
In these prespecifi ed analyses of almost 4 million adults, the HRs for overweight and for obesity grade 1 were broadly similar across diff erent geographical regions (Europe, North America, east Asia, and Australia and New Zealand; numbers of deaths in south Asia were too small to be reliable), but the HRs for underweight
15·0– <18·5 kg/m²
18·5– <20·0 kg/m²
20·0– <22·5 kg/m²
22·5– <25·0 kg/m²
25·0– <27·5 kg/m²
27·5– <30·0 kg/m²
30·0– <35·0 kg/m²
35·0– <40·0 kg/m²
40·0– <60·0 kg/m²
Europe*
Participants/deaths 13 398/675 42 584/1508 199 369/7449 306 566/13278 249 929/12 850 153 147/8935 127 536/8386 32 749/2424 10 322/972
HR (95% CI) 1·79
(1·63–1·97)
1·25 (1·14–1·38)
1·02 (0·97–1·07)
1·00 (0·97–1·03)
1·07 (1·06–1·09)
1·21 (1·18–1·25)
1·52 (1·45–1·58)
1·99 (1·87–2·12)
3·04 (2·84–3·27) North America†
Participants/deaths 22 028/3846 67 114/8597 274 883/36 200 359 022/54 995 317 721/53 464 168 183/28 471 149 807/25 348 39 379/6299 16 950/2702
HR (95% CI) 1·51
(1·34–1·70)
1·09 (1·02–1·16)
1·01 (0·96–1·06)
1·00 (0·97–1·03)
1·06 (1·04–1·07)
1·17 (1·12–1·22)
1·39 (1·30–1·49)
1·93 (1·74–2·13)
2·58 (2·26–2·93) East Asia‡
Participants/deaths 46 979/7178 94 409/10 206 301 242/27 537 336 758/28 755 194 857/17 070 72 133/6950 25 658/2753 1941/231 408/104
HR (95% CI) 1·36
(1·25–1·49)
1·11 (1·04–1·18)
0·99 (0·97–1·02)
1·00 (0·97–1·03)
1·07 (1·04–1·11)
1·28 (1·21–1·35)
1·54 (1·42–1·67)
2·01 (1·59–2·54)
2·38 (1·33–4·24)
p value for heterogeneity§ 0·0045 0·28 0·42 ·· 0·89 0·46 0·20 0·48 <0·0001
Normal weight and overweight are subdivided, and the reference category is BMI 22·5 kg/m² to less than 25·0 kg/m². Numbers of studies, participants, and deaths are shown after exclusions from these prespecifi ed principal analyses. CIs were calculated using fl oating variance estimates (refl ecting independent variability within each group, including the reference group). Results from studies in south Asia and Australia and New Zealand are in fi gure 1, with details in the appendix (p 20). *89 studies; 1 135 600 participants; 56 477 deaths. †40 studies; 1 415 087 participants; 219 922 deaths. ‡46 studies;
1 074 385 participants; 100 784 deaths. §p value for heterogenity is for all three regions.
and grade 3 obesity appeared somewhat higher in Europe than in east Asia (fi gure 1, table 3, appendix pp 16 –21).
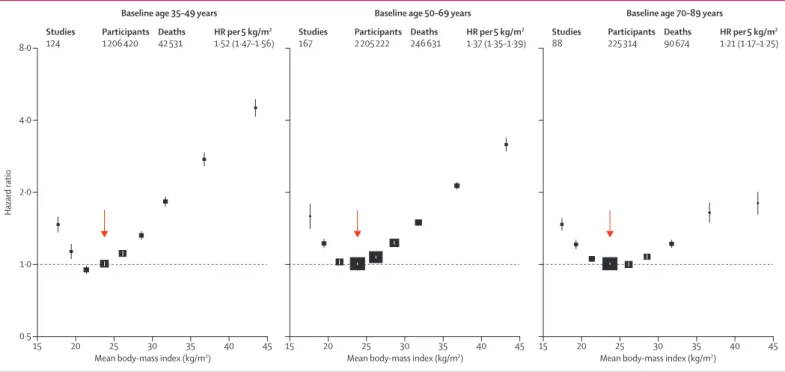
Combining all regions, the HRs for overweight and obesity were higher at younger ages than older ages, and in men than women (fi gures 2 and 3); this fi nding held in each major geographical region (appendix pp 22–24, 38–40). In each region, BMI was non-linearly associated with all-cause mortality, with nadir at BMI 20·0 kg/m² to less than 25·0 kg/m² and excess mortality in underweight, overweight, and at BMI 18·5 kg/m² to less than 20·0 kg/m², at the lower end of the WHO-defi ned normal range. The nadir depended on age, and was BMI=22 kg/m² for baseline age 35–49 years, BMI=23 kg/m² for baseline age 50–69 years, and BMI=24 kg/m² for baseline age 70–89 years.
Population-attributable fractions for all-cause mortality due to overweight or obesity were 19% in North America, 16% in Australia and New Zealand, and 14% in Europe, but only 5% in east Asia (appendix p 25). For BMI 25 kg/m² or more, the association of BMI with all-cause mortality was approximately log-linear, and of similar strength in each region (except perhaps south Asia, where numbers of deaths were small), with HR per 5 kg/m² units higher BMI 1·31 (95% CI 1·29–1·33) overall, 1·39 (1·34–1·44) in east Asia, 1·39 (1·34–1·43) in Europe, 1·29 (1·26–1·32) in North America, and 1·31 (1·27–1·35) in Australia and New Zealand. The HR decreased with age from 1·52 (1·47–1·56) for ages 35–49 years at baseline to 1·21
(1·17–1·25) for ages 70–89 years at baseline (trend p<0·0001; appendix p 26). The HR was 1·51 (1·46–1·56) for men versus 1·30 (1·26–1·33) for women (heterogeneity p<0·0001; fi gure 3). Hence, a given increase in BMI is associated with a far greater absolute mortality increase in men than in women (appendix p 45). As there were far more women than men, particularly among obese people, the HR among all participants was similar to the HR just among women.
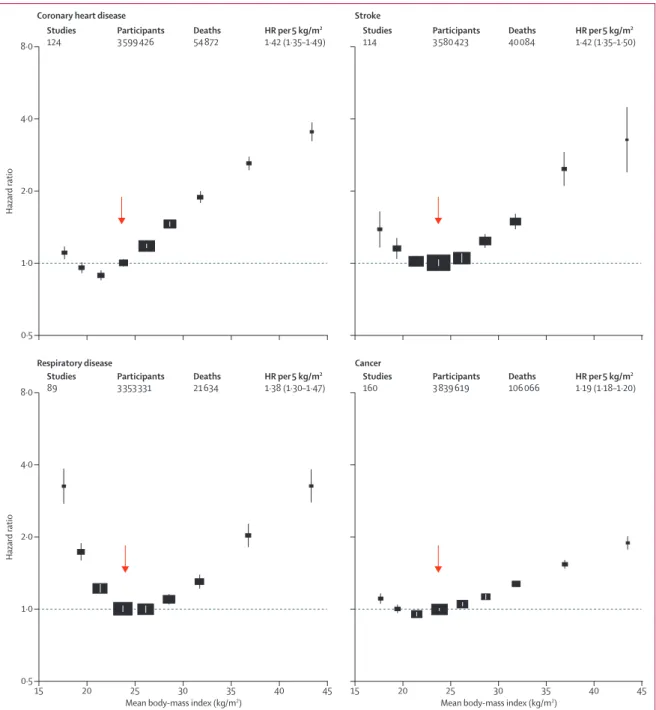
For each major cause of death, BMI was non-linearly associated with mortality in each major region we studied (appendix pp 27–29, 41, 42). Above 25 kg/m², BMI was strongly positively related to coronary heart disease, stroke, and respiratory disease mortality, and moderately positively related to cancer mortality (fi gure 4); these fi ndings were broadly similar in Europe, North America, and east Asia (appendix pp 28, 29). Within WHO’s wide normal BMI range (18·5–<25·0 kg/m²) the main geographical diff erence was that, in east Asia, mortality from coronary heart disease had its nadir at 18·5–<20·0 kg/m², lower than in other regions (appendix p 28). In all regions, underweight was associated with substantially higher respiratory disease mortality and somewhat higher mortality from coronary heart disease, stroke, and cancer (fi gure 4). HRs comparing underweight versus normal-weight cardiovascular disease mortality were more extreme in Europe than elsewhere (appendix pp 28, 29).
Compared with the strict primary analyses described above, crude analyses that ignored smoking and any
Figure 2: Association of body-mass index with all-cause mortality, by baseline age group
The HR per 5 kg/m² higher body-mass index (BMI) and its 95% CI are calculated only for BMI more than 25·0 kg/m². Analyses restricted to never-smokers without pre-existing chronic disease, and excluding the fi rst 5 years of follow-up, and include data from all geographical regions. The reference category is shown with the arrow and is 22·5–<25·0 kg/m². CIs are from fl oating variance estimates (refl ecting independent variability within each category, including the reference category). Areas of squares are proportional to the information content. Analyses by baseline age and the three main geographical regions are in the appendix (p 38). HR=hazard ratio.
15 20 25 30 35 40 45
0·5 1·0 2·0 4·0 8·0
Hazard ratio
Mean body-mass index (kg/m2) Mean body-mass index (kg/m2) Mean body-mass index (kg/m2)
Studies 124
Participants 1 206 420
Deaths 42 531
HR per5 kg/m2 1·52 (1·47–1·56)
15 20 25 30 35 40 45
Studies 167
Participants 2 205 222
Deaths 246 631
HR per5 kg/m2 1·37 (1·35–1·39)
15 20 25 30 35 40 45
Studies 88
Participants 225 314
Deaths 90 674
eff ects of prior disease at baseline, and did not exclude
the fi rst 5 years of follow-up, yielded diff erent
(presumably substantially biased) results, with ex-aggerated HRs for underweight, inverted HRs for overweight, and less than half of the excess risk for grade 1 obesity suggested by the strict primary analyses (tables 1, 2, appendix p 43).
In sensitivity analyses (appendix pp 30–36, 46–48), HRs were little changed in analyses that used fi xed eff ect models or restricted follow-up to years 5–15; considered age at risk rather than age at baseline; adjusted additionally for race or excluded participants with diabetes at baseline; used only studies that included both sexes; used only studies with baseline data for heart disease, stroke, and cancer; or subdivided studies by mean baseline BMI or median recruitment year (HRs were somewhat higher in studies starting before 1990 than those after 1990, but meta-regression of HRs on year of recruitment was not signifi cant). HRs did not vary substantially between larger and smaller studies, between studies with measured and self-reported BMI, or between occupational and other studies.
Discussion
Associations between BMI and mortality can help to estimate the public health impact of excess adiposity only if the estimated relationships are not substantially
distorted by the eff ects of smoking or ill health on BMI. Hence, our primary analyses were of never-smokers without previous disease who survived at least 5 years. Both overweight and obesity were associated with increased all-cause mortality. In the BMI range above 25 kg/m² (ie, above the upper limit of the WHO’s normal range) the relationship to mortality was steep in every global region we studied, except perhaps south Asia
where numbers of deaths were small.27
Our primary analyses challenge previous suggestions that overweight (25–<30 kg/m²) and grade 1 obesity
(30–<35 kg/m²) are not associated with higher mortality,28
bypassing speculation about hypothetical protective metabolic eff ects of increased body fat in apparently
healthy individuals.29 In particular, the fi ndings here
contrast with those of a 2013 review that claimed that, relative to normal weight, grade 1 obesity was not associated with excess all-cause mortality and that
overweight was associated with lower all-cause mortality.28
That review could not, however, control for the biases controlled for in our analysis. Indeed, the results of the current analysis (eg, table 1, table 2, and appendix pp 16, 17) show how the limited ability of that literature-based review to control for bias could have accounted for its misleading fi ndings. Our study was able to reproduce such fi ndings when conducting crude analyses with inadequate control of reverse causality, but not when we conducted appropriately strict analyses.
Despite broadly similar overall fi ndings across diff erent continents, we found some diff erences. HRs per 5 kg/m² higher BMI above 25 kg/m² appeared to be somewhat greater in Europe than in North America. In each major region we studied, HRs were substantially higher at younger than at older ages, although the absolute excess mortality was higher in older people. HRs were substantially higher in men than in women, consistent with previous observations that, at equivalent BMI levels, men have greater insulin resistance, ectopic (eg, liver) fat
levels, and type 2 diabetes prevalence.30 Our primary
analyses of never-smokers included, however, far more women than men, particularly at higher BMI levels. Hence, our HRs for obesity (and, above 25·0 kg/m², the excess HR per 5 kg/m² increase in BMI) mainly describe eff ects in women, despite the substantially larger HRs in men. Our HRs for grade 1 obesity (male 1·70, female 1·37; appendix p 22) suggest that men have almost double the proportional excess mortality of women— but, as age-specifi c death rates are typically more than 50% higher in men, the absolute excess death rate associated with grade 1 obesity is about three times as great in men (appendix p 45).
Because the prevalence of obesity diff ers by region, for all-cause mortality there was wide variation across regions in the approximate population-attributable fraction due to overweight and obesity. These fi ndings suggest that if the overweight and obese population had WHO-defi ned normal levels of BMI, the proportion of premature deaths
Figure 3: Association of body-mass index with all-cause mortality, by sex The HR per 5 kg/m² higher body-mass index (BMI) and its 95% CI are calculated only for BMI more than 25·0 kg/m². Analyses restricted to never-smokers without pre-existing chronic disease, excluding the fi rst 5 years of follow-up, and include data from all geographical regions. The reference category is shown with the arrow and is 22·5–<25·0 kg/m². CIs are from fl oating variance estimates (refl ecting independent variability within each category, including reference). Areas of squares are proportional to the information content. Analyses by sex and the three main geographical regions (east Asia, Europe, and North America) are in the appendix (p 39). HR=hazard ratio.
Women Men
15 20 25 30 35 40 45
0·5 1·0 2·0 4·0 8·0
Hazard ratio
Mean body-mass index (kg/m2) Men
Women Studies 157 141
Participants 913 174 2 743 371
Deaths 115 328 264 657
that could be avoided would be about one in fi ve in North America, one in six in Australia and New Zealand, one in seven in Europe, and one in 20 in east Asia, assuming that the associations of overweight and obesity with mortality in our primary analyses largely refl ect causal eff ects. Moreover, BMI is increasing in many populations, so the pattern of high mortality from adiposity in North America
might become typical elsewhere.31 At the opposite extreme,
there was a substantially higher mortality not only among those in WHO’s underweight category, but also in those with BMI 18·5 kg/m² to <20 kg/m², suggesting that in excessively lean adult populations underweight remains a cause for concern. We have no information about whether the BMI in underweight individuals was always low.
Figure 4: Association of body-mass index with mortality, by major underlying cause
The HR per 5 kg/m² higher body-mass index (BMI) and its 95% CI are calculated only for BMI more than 25·0 kg/m². Analyses restricted to never-smokers without pre-existing chronic disease, excluding the fi rst 5 years of follow-up, and include data from all geographical regions. The reference category is shown with the arrow and is 22·5–<25·0 kg/m². CIs are from fl oating variance estimates (refl ecting independent variability within each category, including reference). Areas of squares are proportional to the information content. Analyses of cause-specifi c mortality by three geographical regions (east Asia, Europe, and North America) are in the appendix (pp 41, 42).
15 20 25 30 35 40 45
0·5 1·0 2·0 4·0 8·0
Hazard ratio
Mean body-mass index (kg/m2) Mean body-mass index (kg/m2)
Studies 89
Participants 3 353 331
Deaths 21 634
HR per5 kg/m2 1·38 (1·30–1·47)
15 20 25 30 35 40 45
Studies 160
Participants 3 839 619
Deaths 106 066
HR per5 kg/m2 1·19 (1·18–1·20) 0·5
1·0 2·0 4·0 8·0
Hazard ratio
Studies 124
Participants 3 599 426
Deaths 54 872
HR per5 kg/m2 1·42 (1·35–1·49)
Studies 114
Participants 3 580 423
Deaths 40 084
HR per5 kg/m2 1·42 (1·35–1·50)
Coronary heart disease Stroke
Our primary analyses used three main approaches to help avoid bias. First, we restricted analysis to never-smokers to avoid residual confounding by smoking as far as possible because merely adjusting for smoking habits would be unlikely to eliminate important residual biases due to the eff ect on BMI of diff erent intensities of
smoking.13 Second, we sought to exclude people known
to have specifi c pre-existing chronic diseases (although full information about this variable was often unavailable). Finally, we omitted the initial 5 years of follow-up from the analysis because diseases at baseline that might cause death over the next 5 years could result in reverse causation (where lower BMI at recruitment is the result, rather than the cause, of the underlying pathology).14–16
Our fi ndings are consistent with other (albeit less precise) studies that have used eff ective methods to reduce potential bias in evaluations of a causal relationship between excess BMI and mortality,
such as Mendelian randomisation analyses,32,33 other
instrumental variable analyses,34 and a meta-analysis of
randomised trials.35 Our fi ndings are also broadly
consistent with the stricter analyses done in a 2015
study36 of 12 million Korean adults and with a 2016 review
that attempted to limit the eff ects of reverse causality.37
The most important limitation is that our only measure of adiposity was BMI, so we could not directly address aspects of body composition such as visceral fat or fat
distribution,38,39 nor could we consider modifi cation of
HRs by metabolic factors.40 Such factors might have
diff erent eff ects in diff erent populations because, at the same BMI, people of Asian ancestry might have higher amounts of body fat and greater risk of developing
metabolic diseases than people of European ancestry.41
Moreover, south Asia, Africa, and Latin America were either unrepresented or poorly represented, and large studies in those areas might yield diff erent fi ndings. The study-specifi c results were in general not adjusted for ethnicity or for socioeconomic status. We did not adjust for regression dilution because previous surveys have reported high levels of concordance in replicate BMI
measures taken from the same adults some years apart.42
There are, however, particular strengths. Compared with single-country studies, we enhanced generalisability by combining fi ndings from 239 studies across four continents. We had access to data for about 97% of the participants in the studies eligible for this analysis (giving large numbers and negligible bias from unavailability of particular studies), we used a prespecifi ed analysis plan, we analysed individual-participant data to avoid the potentially important
limitations of literature-based reviews,43 and we analysed
clinically relevant subpopulations reliably, exploiting the considerable statistical power of the study. We avoided potential over-adjustment by not adjusting for variables (eg, diabetes status and physical activity) that could mediate
associations between BMI and mortality.44 Finally, our
results were robust to a variety of sensitivity analyses.
We conclude that wherever overweight and obesity are common their associations with higher all-cause mortality are broadly similar in diff erent populations, supporting strategies to combat the entire spectrum of excessive adiposity worldwide.
Contributors
All of the authors contributed to data collection, and the design, analysis, interpretation, and re-drafting of this paper. EDA, SNB, DW, SK, BJC, RH, SL, MW, JD, and FBH drafted the study protocol and analysis plan. SK, PG, and DW conducted the combined statistical analysis. EDA, SNB, RP, JD, and FBH drafted the manuscript.
The Global BMI Mortality Collaboration
Writing Committee (*equal contribution)—Emanuele Di Angelantonio
(University of Cambridge, Cambridge, UK)*; Shilpa N Bhupathiraju (Harvard TH Chan School of Public Health, Harvard University, Boston, MA, USA)*; David Wormser (University of Cambridge, Cambridge, UK)*; Pei Gao (University of Cambridge, Cambridge, UK and Peking University, Beijing, China)*; Stephen Kaptoge (University of Cambridge, Cambridge, UK)*; Amy Berrington de Gonzalez (National Cancer Institute, Bethesda, MD, USA)*; Benjamin J Cairns (University of Oxford, Oxford, UK)*; Rachel Huxley (Curtin University, Perth, Australia)*; Chandra L Jackson (Harvard Medical School, Harvard University, Boston, MA, USA)*; Grace Joshy (Australian National University, Canberra, Australia)*; Sarah Lewington (University of Oxford, Oxford, UK)*; JoAnn E Manson (Harvard TH Chan School of Public Health and Harvard Medical School, Harvard University, Boston, MA, USA)*; Neil Murphy (Imperial College London, London, UK)*; Alpa V Patel (American Cancer Society, Atlanta, GA, USA)*;
University, Wellington, New Zealand)*; Walter C Willett (Harvard TH Chan School of Public Health and Harvard Medical School, Harvard University, Boston, MA, USA)*; Simon G Thompson (University of Cambridge, Cambridge, UK)*; John Danesh (University of Cambridge, Cambridge, UK)*; Frank B Hu (Harvard TH Chan School of Public Health and Harvard Medical School, Harvard University, Boston, MA, USA)*.
Declaration of interests
EDA received research funding from UK Medical Research Council, British Heart Foundation, National Institute of Health Research, NHS Blood and Transplant, European Commission Framework Programme during the conduct of the study; and personal fees from Elsevier (France). Since January, 2014, DW has been a full-time employee of F Hoff mann-La Roche and received personal fees and holding shares in F Hoff mann-La Roche. PG received grants from Recruitment Program for Young Professionals in China and British Heart Foundation. BJC, JG, GKR, and VB received research funding from Cancer Research UK and Medical Research Council. BJC received funding from the British Heart Foundation Centre of Research Excellence, Oxford. MW received personal fees from Novartis and Amgen. OHF received research funding from Nestle and Metagenics. RJK received grants from National Health and Medical Research Council. NS received personal fees from AstraZeneca, Boehringer Ingelheim, and Janssen. EB received grants from National Health and Medical Research Council of Australia and National Heart Foundation of Australia. SGT received grants from UK Medical Research Council and British Heart Foundation. JD has received research funding from the British Heart Foundation, NIHR Cambridge Comprehensive Biomedical Research Centre, BUPA Foundation, diaDexus, European Research Council, European Union, Evelyn Trust, Fogarty International Centre, GlaxoSmithKline, Merck, National Heart, Lung and Blood Institute, National Institute for Health Research, National Institute of Neurological Disorders and Stroke, NHS Blood and Transplant, Novartis, Pfi zer, UK Medical Research Council, and Wellcome Trust. All other members of the writing committee declare no competing interests.
Acknowledgments
This paper is dedicated to the memory of Gary Whitlock, who contributed much to developing the collaboration. Global BMI Mortality Collaboration provides links to websites of the component studies (or consortia), many of which describe their funding. The coordinating centre at the University of Cambridge was funded by the UK Medical Research Council (G0800270), British Heart Foundation (SP/09/002), British Heart Foundation Cambridge Cardiovascular Centre of Excellence, and National Institute for Health Research Cambridge Biomedical Research Centre. The work of the coordinating centre at the Harvard TH Chan School of Public Health was funded by grants P01 CA87969, UM1 CA176726, UM1 CA167552, DK58845, P30 DK046200, and U54 CA155626 from the National Institutes of Health. This research has been conducted using the UK Biobank resource.
References
1 Ng M, Fleming T, Robinson M, et al. Global, regional, and national prevalence of overweight and obesity in children and adults during 1980–2013: a systematic analysis for the Global Burden of Disease Study 2013. Lancet 2014; 384: 766–81.
2 NCD Risk Factor Collaboration (NCD-RisC). Trends in adult body-mass index in 200 countries from 1975 to 2014: a pooled analysis of 1698 population-based measurement studies with 19·2 million participants. Lancet 2016; 387: 1377–96.
3 WHO. Obesity and overweight. Fact sheet N°311. Geneva: World Health Organization, 2015.
4 WHO expert consultation. Appropriate body-mass index for Asian populations and its implications for policy and intervention strategies. Lancet 2004; 363: 157–63.
5 Asia Pacifi c Cohort Studies Collaboration. Body mass index and cardiovascular disease in the Asia-Pacifi c region: an overview of 33 cohorts involving 310 000 participants. Int J Epidemiol 2004;
33: 751–58.
6 Berrington de Gonzalez A, Hartge P, Cerhan JR, et al. Body-mass index and mortality among 1·46 million white adults. N Engl J Med
2010; 363: 2211–19.
7 Jee SH, Sull JW, Park J, et al. Body-mass index and mortality in Korean men and women. N Engl J Med 2006; 355: 779–87.
8 Patel AV, Hildebrand JS, Gapstur SM. Body mass index and all-cause mortality in a large prospective cohort of white and black US adults. PLoS One 2014; 9: e109153.
9 Pischon T, Boeing H, Hoff mann K, et al. General and abdominal adiposity and risk of death in Europe. N Engl J Med 2008; 359: 2105–20. 10 Prospective Studies Collaboration. Body-mass index and
cause-specifi c mortality in 900 000 adults: collaborative analyses of 57 prospective studies. Lancet 2009; 373: 1083–96.
11 The Emerging Risk Factors Collaboration. Separate and combined associations of body-mass index and abdominal adiposity with cardiovascular disease: collaborative analysis of 58 prospective studies. Lancet 2011; 377: 1085–95.
12 Zheng W, McLerran DF, Rolland B, et al. Association between body-mass index and risk of death in more than 1 million Asians.
N Engl J Med 2011; 364: 719–29.
13 Bamia C, Trichopoulou A, Lenas D, Trichopoulos D. Tobacco smoking in relation to body fat mass and distribution in a general population sample. Int J Obes Relat Metab Disord 2004; 28: 1091–96. 14 Manson JE, Stampfer MJ, Hennekens CH, Willett WC. Body weight
and longevity: a reassessment. JAMA 1987; 257: 353–58. 15 Singh PN, Wang X. Simulation study of the eff ect of the early
mortality exclusion on confounding of the exposure-mortality relation by preexisting disease. Am J Epidemiol 2001; 154: 963–71. 16 Willett WC, Hu FB, Thun M. Overweight, obesity, and all-cause
mortality. JAMA 2013; 309: 1681–82.
17 Stewart LA, Clarke M, Rovers M. Preferred reporting items for a systematic review and meta-analysis of individual participant data: the prisma-ipd statement. JAMA 2015; 313: 1657–65.
18 Park SY, Wilkens L, Murphy S, Monroe K, Henderson B, Kolonel L. Body mass index and mortality in an ethnically diverse population: the Multiethnic Cohort Study. Eur J Epidemiol 2012; 27: 489–97. 19 Lin WY, Tsai SL, Albu JB, et al. Body mass index and all-cause mortality
in a large Chinese cohort. Can Med Assoc J 2011; 183: E329–36. 20 NHLBI Expert Panel on the Identifi cation, Evaluation, and
Treatment of Overweight and Obesity in Adults.Clinical guidelines on the identifi cation, evaluation, and treatment of overweight and obesity in adults—the evidence report. Obes Res 1998;
6 (suppl 2): 51S–209.
21 Plummer M. Improved estimates of fl oating absolute risk. Stat Med
2004; 23: 93–104.
22 Jackson D, White IR, Thompson SG. Extending DerSimonian and Laird’s methodology to perform multivariate random eff ects meta-analyses. Stat Med 2010; 29: 1282–97.
23 Preston SH, Mehta NK, Stokes A. Modeling obesity histories in cohort analyses of health and mortality. Epidemiology 2013;
24: 158–66.
24 Thompson S, Kaptoge S, White I, Wood A, Perry P, Danesh J. Statistical methods for the time-to-event analysis of individual participant data from multiple epidemiological studies.
Int J Epidemiol 2010; 39: 1345–59.
25 Stevens G, Singh G, Lu Y, et al. National, regional, and global trends in adult overweight and obesity prevalences. Popul Health Metr
2012; 10: 22.
26 Higgins JP, Thompson SG. Quantifying heterogeneity in a meta-analysis. Stat Med 2002; 21: 1539–58.
27 Jensen MD, Ryan DH, Apovian CM, et al. 2013 AHA/ACC/TOS guideline for the management of overweight and obesity in adults: a report of the American College of Cardiology/American Heart Association Task Force on Practice Guidelines and The Obesity Society. Circulation 2014; 129 (suppl 2): S102–38.
28 Flegal KM, Kit BK, Orpana H, Graubard BI. Association of all-cause mortality with overweight and obesity using standard body mass index categories: a systematic review and meta-analysis. JAMA
2013; 309: 71–82.
29 Doehner W, Clark A, Anker SD. The obesity paradox: weighing the benefi t. Eur Heart J 2010; 31: 146–48.
30 Sattar N. Gender aspects in type 2 diabetes mellitus and cardiometabolic risk. Best Pract Res Clin Endocrinol Metab 2013;
27: 501–07.
31 Gillman MW, Ludwig DS. How early should obesity prevention start? N Engl J Med 2013; 369: 2173–75.
32 Nordestgaard BG, Palmer TM, Benn M, et al. The eff ect of elevated body mass index on ischemic heart disease risk: causal estimates from a Mendelian randomisation approach. PLoS Med 2012; 9: e1001212.
For the Global BMI Mortality
Collaboration see http://www. phpc.cam.ac.uk/ceu/research/ global-bmi-mortality-collaboration
For more on Gary Whitlock see
Perspectives Lancet 2014;
33 Hagg S, Fall T, Ploner A, et al. Adiposity as a cause of cardiovascular disease: a Mendelian randomization study. Int J Epidemiol 2015;
44: 578–86.
34 Davey Smith G, Sterne JA, Fraser A, Tynelius P, Lawlor DA, Rasmussen F. The association between BMI and mortality using off spring BMI as an indicator of own BMI: large intergenerational mortality study. BMJ 2009; 339: b5043.
35 Kritchevsky SB, Beavers KM, Miller ME, et al. Intentional weight loss and all-cause mortality: a meta-analysis of randomized clinical trials. PLoS One 2015; 10: e0121993.
36 Yi SW, Ohrr H, Shin SA, Yi JJ. Sex-age-specifi c association of body mass index with all-cause mortality among 12·8 million Korean adults: a prospective cohort study. Int J Epidemiol 2015; 44: 1696–705. 37 Aune D, Sen A, Prasad M, et al. BMI and all cause mortality:
systematic review and non-linear dose-response meta-analysis of 230 cohort studies with 3∧74 million deaths among 30·3 million participants. BMJ 2016; 353: i2156.
38 Bohm A, Heitmann BL. The use of bioelectrical impedance analysis for body composition in epidemiological studies. Eur J Clin Nutr
2013; 67: S79–85.
39 Britton KA, Massaro JM, Murabito JM, Kreger BE, Hoff mann U, Fox CS. Body fat distribution, incident cardiovascular disease, cancer, and all-cause mortality. J Am Coll Cardiol 2013; 62: 921–25. 40 Kramer CK, Zinman B, Retnakaran R. Are metabolically healthy
overweight and obesity benign conditions? A systematic review and meta-analysis. Ann Intern Med 2013; 159: 758–69.
41 Chan JN, Malik V, Jia W. Diabetes in Asia: epidemiology, risk factors, and pathophysiology. JAMA 2009; 301: 2129–40. 42 Wormser D, White IR, Thompson SG, Wood AM. Within-person
variability in calculated risk factors: comparing the aetiological association of adiposity ratios with risk of coronary heart disease.
Int J Epidemiol 2013; 42: 849–59.
43 Stewart LA, Clarke MJ. Practical methodology of meta-analyses (overviews) using updated individual patient data. Cochrane Working Group. Stat Med 1995; 14: 2057–79.