ORIGINAL RESEARCH
Voxel-Based Analysis of Quantitative T1 Maps
Demonstrates That Multiple Sclerosis Acts
throughout the Normal-Appearing White Matter
H. Vrenken S.A.R.B. Rombouts P.J.W. Pouwels F. Barkhof
BACKGROUND AND PURPOSE: Disease activity in normal-appearing white matter (NAWM) in multiple sclerosis (MS) has been demonstrated in vivo with T1 relaxation time measurements. We aimed to investigate the spatial distribution of T1 increases in MS NAWM without a priori selection of specific regions.
METHODS: Whole-brain quantitative T1 maps were measured in 67 patients with one of the 3 main clinical types of MS (13 primary progressive [PP], 36 relapsing-remitting [RR], and 18 secondary progressive [SP]) and in 23 healthy control subjects. After registration to standard space and segmen-tation of NAWM, the maps were analyzed by using voxel-based analyses with a cluster-based correctedPthreshold of .05.
RESULTS: Group mean T1 relaxation times throughout NAWM increased when going from control subjects to PP to RR to SP MS. In the RR and SP MS groups, the T1 increases compared with control subjects were significant throughout the NAWM, without apparent preference for specific brain regions. In RR MS, 16% of NAWM voxels displayed a significant increase in T1 compared with control subjects, and in SP, this fraction was 49%. The comparison between RR MS and the subsequent phase SP MS revealed that, in these patients, disease progression occurs throughout the NAWM. In patients with PP MS, the spatial extent of significant T1 increases is limited. There were no correlations with clinical disability scales or brain volume in a substantial fraction of voxels.
CONCLUSION:This study demonstrates that in patients with RR MS and SP MS, NAWM disease processes have no regional preferences but can occur throughout the brain.
M
ultiple sclerosis (MS) is characterized by lesions in the white matter (WM) of the central nervous system, which can be observed in vivo on T2-weighted MR images. Outside these MR-visible lesions, in the so-called normal-appearing white matter (NAWM), disease activity and structural damage have been demonstrated in vivo by using quantitative MR techniques. Diffusion tensor imaging has shown increases in the apparent diffusion coefficient1-3 and reductions of thefractional anisotropy1,3,4in MS NAWM, reflecting damage to axonal tracts. The magnetization transfer ratio is decreased in MS NAWM,5,6which has been related to demyelination and
axonal damage by combined MR-histopathologic studies.7-9
With respect to the longitudinal relaxation time, T1, some studies have reported limited or no significant T1 increases, but most studies found T1 to be increased in MS NAWM compared with control white matter (WM), by using both regional analyses and histogram analyses covering a large part of the brain.10-15
Do these changes in NAWM preferentially occur in specific regions in the brain, as is the case with MR-visible MS le-sions?16The results from region of interest studies14,15suggest that changes in T1 of NAWM are not restricted to specific regions but occur throughout the brain. A region of interest
approach, however, can answer this question only partially, because only a limited number of specific regions can be ex-amined. Further, the need to avoid the MR-visible lesions in the patients with MS hampers the reproducibility of the region of interest positioning between different patients.
Voxel-based analyses allow regional comparisons between groups to be made for the whole brain in a single analysis.17
This is done by coregistering data from all individual subjects to a reference brain, generally referred to as “standard space” and then comparing them on a voxel-by-voxel basis. In gen-eral, this method is used to compare structural properties, such as voxel gray matter content, or functional MR imaging data between groups.
The current study aimed to analyze whole-brain quan-titative T1 maps, not to find global changes or changes in selected regions, but specifically to investigate the spatial distribution through the brain of T1 increases in MS NAWM with respect to control WM. The 3 main clinical types of MS were investigated: primary progressive (PP) MS, which is a progressive disease without clinical exacer-bations; relapsing-remitting (RR) MS, which involves clin-ical relapses from which patients partially or fully recover; and secondary progressive (SP) MS, which is the progres-sive phase that follows RR MS in approximately 60% of patients with RR MS.18The analysis was based on
whole-brain T1 maps from which only NAWM was selected, by using a tailored approach to deal with the varying distribu-tion of MR visible lesions through the brain in patients with MS. Differences between disease types were also investi-gated, including the spatial distribution of increased NAWM damage due to disease progression in the succes-sive disease types RR and SP MS. In addition, the relation of Received April 25, 2005; accepted after revision August 31.
From the MR Center for MS Research, Departments of Radiology (H.V., F.B.) and Physics and Medical Technology (S.A.R.B.R., P.J.W.P.), VU University Medical Center, Amsterdam, the Netherlands.
The VU University Center for MS Research is supported by the Dutch MS Research Foundation (Voorschoten, the Netherlands). In addition, the Dutch MS Research Foundation (Voorschoten, the Netherlands) also supports H.V. (grant 98-371).
regional NAWM T1 changes with clinical disability and overall atrophy was investigated.
Materials and Methods
Subjects
A total of 67 patients with MS (13 PP, 36 RR, and 18 SP) and 23 healthy control subjects without neurologic disease participated in this study (Table). Inclusion criteria were age between 18 and 70 years and, for the patients with MS, no other neurologic disease and no disease activity within the last 4 weeks as assessed during neurologic examination. Of the patients with RR MS, 16 (44%) were being treated with interferon. No patients used other disease-modifying treatments. The institutional ethics review board of the university medical center approved the study. Informed consent was obtained from all subjects. Patients with MS underwent a neurologic examina-tion in which expanded disability status scale (EDSS)19and MS func-tional composite (MSFC)20scores were determined.
MR Protocol
All MR investigations were performed with a Vision scanner operat-ing at 1.5 T (Siemens, Erlangen, Germany). The MR imagoperat-ing protocol included fast spin-echo proton density (Pd)/T2-weighted images of 32 contiguous sections, acquired in 2 interleaved sets, with 4-mm section thickness and 1⫻1 mm2in-plane resolution.
T1 mapping was performed by using the flip angle array method described by Venkatesan et al.21Six sets of 3D spoiled gradient-echo (FLASH-3D) images (repetition time [TR]/echo time [TE], 20/4 ms) were acquired with a 3D slab covering the same volume as the Pd/T2-weighted images, with a slab thickness of 128 mm, 32 partitions, in-plane resolution of 1⫻1 mm2, and flip angles varying between 2° and 25°. For B1 mapping, 5 additional sets of FLASH-3D images covering the whole head were acquired at low resolution, with flip angles be-tween 140° and 220°. Total acquisition time of the images for T1 and B1 mapping was approximately 20 minutes.
Postprocessing
Reference Images and Coregistrations.The image-manipulation tools used in this study are all part of FSL (http://www.fmrib.ox.ac.uk/ fsl), which are reliable, widely used, and well-documented meth-ods.22-25In both the calculation of the T1 maps and the identification of NAWM, the same reference images were used—ie, the set of FLASH-3D images with a flip angle of 20°. These will be referred to as “20° flip angle images.”
By using a linear image registration algorithm with an affine trans-formation,22 the transformation matrices were calculated for the coregistration of the 20° flip angle images to standard space and for the coregistration of the Pd/T2-weighted images to the 20° flip angle images. For internal consistency, the transformation matrix for the
coregistration of the Pd/T2-weighted images to standard space was not derived separately, but calculated from the other 2 transformation matrices.
Lesions and Brain Volume.For the patients with MS, lesion masks were created by manually outlining both focal and diffuse le-sions on the original Pd/T2-weighted images by using a local thresh-olding technique. From the outlines, the total MR visible cerebral and infratentorial lesion volumes, referred to here as lesion loads, were calculated for each patient. From the 20° flip angle images, the nor-malized brain volume (NBV) of each subject was calculated.23
Calculation of T1 Maps.For each subject, a B1 map was con-structed by smoothing the FLASH-3D images with flip angles be-tween 140° and 220° and then performing a pixel-by-pixel calculation of the system-calibrated flip angle corresponding to a true 180° flip angle. Next, the FLASH-3D images with flip angles of 2°–25° were coregistered to the 20° flip-angle images applying a sinc interpolation and then used, together with the B1 map for that subject, as inputs for pixel-by-pixel calculation of a native-space whole-brain T1 map by using the method described and validated by Venkatesan et al.21This T1 map was then transferred to standard space by using the transfor-mation of the 20° flip angle images to standard space with a trilinear interpolation.
Preparation of Standard Space NAWM T1 Maps for Analyses. To ensure that T1 data from CSF, gray matter, and lesions was ex-cluded from the analysis, standard space NAWM T1 maps were con-structed for each individual subject by using the following procedure. First, brain tissue was extracted from the Pd/T2-weighted images and the 20° flip-angle images by using an automated procedure24followed by manual editing. The Pd/T2-weighted images were coregistered to the 20° flip-angle images, and these 3 image sets were then used as inputs of an automated segmentation algorithm25to identify gray matter, white matter, and CSF. For 12 patients with MS with extensive lesions, the multichannel segmentation was unsuccessful and a single-channel segmentation based on the 20° flip-angle images alone was used, with comparable results. The WM masks were eroded in-plane by 2 layers of 1⫻1 mm2pixels. The resulting conservative native-space WM masks were coregistered to standard native-space by using the transformation from the 20° flip-angle images to standard space, fol-lowed by a combination of thresholding and in-plane erosion.
For the control subjects, the standard space WM masks were com-bined with the standard space whole-brain T1 maps to obtain tissue-specific WM T1 maps. For each MS patient, the lesion mask defined on the Pd/T2-weighted images was coregistered to standard space by using the transformation from Pd/T2-weighted images to standard space. It was then subtracted from the standard space WM mask to obtain the standard space NAWM mask for that patient. In the lesion mask coregistration, a trilinear interpolation was used that makes the lesion masks broader and hence keeps the NAWM masks
conserva-Characteristics of subject groups
PP MS RR MS SP MS Controls
No. of subjects (M/F) 13 (7/6) 36 (11/25) 18 (7/11) 23 (12/11)
Age (y) 57.2⫾6.3 39.0⫾7.3 44.3⫾10.5 30.6⫾7.4
Supratentorial lesion load (range) (mL) 8.6⫾8.7 (0.2–27.8) 8.8⫾9.4 (0.3–41.2) 14.6⫾13.1 (2.5–54.7) Infratentorial lesion load (range) (mL) 0.2⫾0.3 (0.0–0.8) 0.2⫾0.3 (0.0–0.9) 0.5⫾1.0 (0.0–4.2)
Normalized brain volume (mL) 1417⫾48 1473⫾64 1406⫾52 1518⫾42
Median EDSS score (range) 4.5 (3.0–6.5) 2.0 (1.0–4.5) 6.0 (2.5–8.0)
MSFC score 0.32⫾0.19 0.56⫾0.31 ⫺0.27⫾0.72
Note:—PP MS, RR MS, and SP MS indicate, respectively, primary progressive, relapsing-remitting, and secondary progressive multiple sclerosis; EDSS, expanded disability status scale; MSFC, multiple sclerosis functional composite.
BRAIN
ORIGINAL
tive. By combining the standard space whole-brain T1 maps with the standard space NAWM masks, tissue-specific NAWM T1 maps were created for all patients.
To increase the signal intensity-to-noise ratio, the individual stan-dard-space NAWM T1 map of each subject was smoothed with a Gaussian smoothing kernel of 8 mm full width at half maximum, including only the voxels inside that individual NAWM mask in the smoothing procedure.
The voxel-based analyses require, in each analyzed voxel, valid data for all subjects in the analysis. In this study, however, the removal of the MS lesions from the WM masks of the patients with MS creates holes with no data in their NAWM T1 maps. Because of the variation in location of the MS lesions between patients, for any given voxel in standard space, there is a high probability that for at least one of the patients this voxel is not classified as NAWM. In fact, in this study, not a single voxel contains data for all patients and control subjects. Therefore, to perform an analysis of NAWM throughout the brain in the presence of this missing data, a tailored approach was followed. A voxel was included if in each of the 4 groups (control subjects and PP, RR, and SP MS), the fraction of subjects with data for that voxel exceeded a certain threshold. The following data illustrate how the number of voxels included in the analysis depends on this threshold (minimum fraction of subjects with valid data in each group, %/num-ber of analyzed NAWM voxels):⬎0/123,351, 25/67,726, 50/36,196, 75/6260, 100/0. To include sufficient voxels in the analysis to study whole-brain NAWM and at the same time prevent the analysis of a voxel from being based on only a small number of measurements, the threshold was set at 50%—that is, at least 7 subjects with valid data in the PP MS group, 18 in RR, 9 in SP, and 12 control subjects. Note that only voxels that fulfilled the requirement in every group were entered in the analysis. Missing data were replaced by the group mean value for that voxel, calculated from the valid data available for that voxel in that subject group. Replacing missing data with the group mean value of the valid data ensures that the only effect on the statistical compar-isons between groups is that the statistical power is increased.
Voxel-Based Analyses. First, a voxel-based analysis was per-formed to mutually compare the 4 subject groups. A one-way ANOVA model was applied, including subject age as a covariate. Sta-tistic images were thresholded by using clusters determined byZ⬎
3.1 and a corrected cluster significance threshold ofP⫽.006 (also corrected for the number of contrasts [8] in this analysis).26-28The analyzed contrasts were PP/RR/SP⬎control subjects, SP⬎RR, PP ⬍⬎SP/RR. As an indication of how much of the analyzed NAWM is involved, the fraction of voxels with a significant T1 difference was calculated for each contrast.
Three additional analyses were performed only in the subset of patients with either RR or SP MS disease. In these analyses, these RR/SP patients (ie, the patients with relapse-onset disease that form a kind of “continuum”) were treated as one group. In this group, the correlations of changes in T1 within the NAWM with the clinical
disability scales EDSS and MSFC, and with NBV were investigated. Missing values in the T1 maps were now replaced by the mean value for that voxel calculated from the combined group of RR and SP patients. Because of the sequential relation between RR and SP MS, subject age was not included as a covariate in these analyses.
Results
Subject group characteristics are provided in the Table. EDSS scores were higher and MSFC scores lower, both reflecting greater disability, and smallest NBV values were found in the progressive disease types (PP and SP MS). Also in line with expectations, lesion loads were highest in the patients with SP MS.
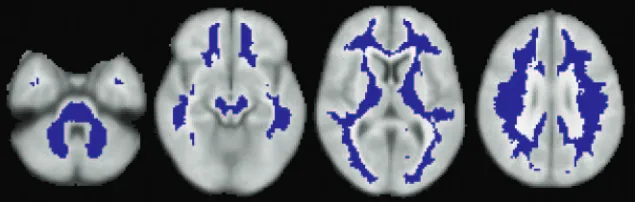
As a reference to the statistics maps that follow below, Fig 1 shows, for 4 selected sections of the reference brain, which voxels were analyzed. Note that this selection of NAWM is rather con-servative. The voxel-wise mean T1 values calculated by the statis-tical model in each of the 4 subject groups are shown in Fig 2. The mean T1 seems to increase throughout the NAWM when going from control subjects to PP to RR to SP MS, and this is confirmed by the results of the statistical comparisons between MS groups and control subjects (Fig 3). In RR and SP MS, voxels throughout the NAWM have significantly higher T1 compared with control subjects. In PP MS, the spatial extent is limited. As an indication of how much of the analyzed NAWM is involved, the following lists the percentage of voxels with a significant difference in T1 for each contrast: PP⬎CO, 1.5; RR⬎CO, 16; SP⬎CO, 49; PP⬎ RR, 0; RR⬎PP, 0.2; PP⬎SP, 0; SP⬎PP, 18; SP⬎RR, 20. Notably, there was a significant T1 increase compared with con-trol subjects in PP MS in 1.5% of the analyzed NAWM voxels, in RR MS in 16%, and in SP MS in 49% of NAWM voxels.
Figure 4 displays the results concerning the contrasts of SP MS with PP and RR MS. The mutual comparison between RR and SP MS revealed a significant T1 increase in 20% of NAWM voxels in SP MS compared with RR MS. The PP MS group did not exhibit significantly larger T1 than RR or SP MS in any voxel. The reverse contrasts revealed that compared with PP MS, T1 was significantly higher in RR and SP MS in 0.2% and 18% of NAWM voxels, respectively.
The correlation analyses in the patients with RR-SP MS with EDSS, MSFC, and NBV, revealed that there was only a very small number of NAWM voxels in which one of these measures explained a significant part of T1 variance. From these results, no anatomic regions within the NAWM can be identified in which T1 changes are specifically connected to changes in NBV, EDSS, or MSFC.
Discussion
T1 Increases Occur throughout NAWM in RR and SP MS
[image:3.585.54.373.43.144.2]sure and therefore suitable for investigating subtle NAWM changes, though it is not very specific as to the underlying pathology. This study is the first to investigate T1 in NAWM by using voxel-based analyses, thus sampling throughout the brain without a priori selection of specific regions for investi-gation. For each subject, only NAWM voxels were analyzed, ensuring that the data did not contain any unwanted contri-butions from lesions or gray matter. To deal with the missing data that result from removing the lesions, only those voxels that, for all subject groups in the analysis, contained NAWM for 50% of the subjects were analyzed. The same standard brain voxels were analyzed for all subjects, so differences in lesion load between groups or subjects did not affect the anal-ysis. The analysis was also not hindered by regional variation in T1, because data were compared on a standard space voxel basis.
The results show that at a group level there is widespread involvement of NAWM throughout the brain in RR MS and
especially in SP MS, where a significant T1 increase was found in 49% of NAWM voxels. The fractions of significantly ab-normal voxels should be interpreted with some caution, because these obviously depend strongly on the applied statistics, which were relatively stringent in this study. Qualitatively, our results show that NAWM in large parts of the brain has sig-nificantly increased average T1 in the RR MS group and especially in the SP MS group. This demonstrates that NAWM in large parts of the brain is susceptible to disease processes in RR and SP MS. The voxels with significantly increased T1 val-ues were observed throughout the brain, in both hemispheres, both caudally and rostrally and both dorsally and ventrally. There appears to be no preference for, for example, locations known to be more prone to development of MR visible le-sions, like periventricular white matter. This is in line with previous observations in region of interest studies, which have shown T1 increases,14,15but also changes in other measures, such as apparent dif-fusion coefficient,1,3,29fractional
anisot-ropy,1,3,4,29 and magnetization transfer ratio,5,6 in NAWM in many brain
re-gions.
[image:4.585.53.371.36.501.2]values. This is avoided with the current approach in which the results are based on NAWM alone.
Although the age matching of control subjects and patients in this study is not ideal, the lower mean age of the control
group is unlikely to be responsible for the observed differ-ences, because T1 remains nearly constant in the age range of the subjects who were included in the current study.30 Fur-thermore, subject age was included as an explanatory variable Fig 3.Results of pairwise contrasts between multiple sclerosis (MS) groups (primary progressive [PP], relaps-ing-remitting [RR], and secondary progressive [SP]) and control subjects (C) are displayed asZscores for PP MS⬎control subjects (top), RR MS⬎control subjects (middle), and SP MS⬎control subjects (bottom). The color range represents aZscore range of 3.1 to 8.0, as indicated by thecolor bar. Statistically significant T1 increases involve large fractions of normal-appearing white matter (NAWM) in RR and SP MS. The spatial extent of statistically significant T1 increases is small in PP MS.
[image:5.585.52.374.38.665.2]in the current study. The high mean age of the PP MS group is related to the higher age at onset of the disease in these pa-tients, and, because patients with SP MS have always previ-ously suffered from RR MS, patients with SP MS should be expected to be slightly older than patients with RR MS.
Large Parts of NAWM Are More Severely Affected in SP MS
SP MS shows the largest spatial extent of abnormal T1 values compared with control subjects, but also exhibits higher T1 values than both RR and PP MS in large parts of the NAWM. Compared with RR MS, the subsequent SP phase appears to involve, in addition to new MR visible lesions, an increase in the severity of disease effects throughout the NAWM. This could be either increased secondary damage as a result of the increase in MR visible lesion load or the accumulation of in-dependent diffuse NAWM damage. Also compared with PP MS, disease effects appear to be more severe in SP MS in a large part of the NAWM. This is compatible with observations that PP MS appears to preferentially affect the spinal cord, that patients with PP MS have fewer MR visible brain lesions than patients with SP MS, and that they exhibit significantly smaller changes of quantitative MR parameters in NAWM in most studies (review is given in Filippi et al31). The larger number of
voxels with a statistically significant T1 increase in SP MS may be indirectly related to the larger average volume of T2 visible lesions in that group. As a result of the higher lesion volume, the selected NAWM in the patients with SP MS quite likely contains a greater fraction of perilesional NAWM, and some studies have suggested greater damage or disease activity in perilesional NAWM than in NAWM further away from lesions.5,32
Regional T1 Changes Are Not Associated with Overall Atrophy or Clinical Worsening
The additional correlation analyses in the RR-SP MS group revealed hardly any voxels with significant correlations be-tween T1 values and clinical scales or NBV. For those voxels that did exhibit a correlation, the relation was as expected, with increased T1 corresponding to more severe clinical dis-ease and decrdis-eased NBV. There does not appear to be any specific anatomic region in which NAWM changes as reflected by a T1 increase have particular impact on clinical disability or overall atrophy. The comparisons between MS groups and control subjects showed that in RR and SP MS disease pro-cesses are not restricted to specific anatomic regions but can inflict (destructive) damage, contributing to overall atrophy, throughout the NAWM. It is therefore perhaps not surprising that T1 exhibits hardly any localized correlations with NBV. It is conceivable that this generally also holds for clinical disabil-ity scales, though damage to some special structures, such as the corpus callosum, may be suspected to have especially strong clinical impact33; however, because of the presence of
lesions in too many subjects, large parts of the corpus callosum did not fulfill the criterion that 50% of subjects in each group should have valid data. Therefore, these voxels were not in-cluded in our analyses, so no results are available for most of the corpus callosum. Global NAWM changes have before been
related to clinical and cognitive changes,34-40as well as to over-all atrophy.13,40,41
In conclusion, this study demonstrates that disease activity and/or tissue damage in NAWM are not limited to specific regions but occur throughout the brain in RR and SP MS. The comparison between RR and SP MS revealed that disease pro-gression in these patients also acts throughout the NAWM. In the subgroup of patients with RR-SP MS, locally elevated T1 was not correlated with increased clinical disease severity or decreased brain volume in a substantial fraction of NAWM, probably because these measures are more sensitive to general tissue damage.
Acknowledgments
We thank all patients and control subjects who participated in this study. We thank S.M. Smith of the Oxford Center for Functional Magnetic Resonance Imaging of the Brain for helpful discussions of study design and access to software be-fore release.
References
1. Cercignani M, Bozzali M, Iannucci G, et al.Intra-voxel and inter-voxel coher-ence in patients with multiple sclerosis assessed using diffusion tensor MRI. J Neurol2002;249:875– 83
2. Rovaris M, Bozzali M, Iannucci G, et al.Assessment of normal-appearing white and gray matter in patients with primary progressive multiple sclerosis: a diffusion-tensor magnetic resonance imaging study.Arch Neurol2002;59: 1406 –12
3. Werring DJ, Clark CA, Barker GJ, et al.Diffusion tensor imaging of lesions and normal-appearing white matter in multiple sclerosis.Neurology1999;52: 1626 –32
4. Ciccarelli O, Werring DJ, Wheeler-Kingshott CA, et al.Investigation of MS normal-appearing brain using diffusion tensor MRI with clinical correla-tions.Neurology2001;56:926 –33
5. Filippi M, Campi A, Dousset V, et al.A magnetization transfer imaging study of normal-appearing white matter in multiple sclerosis.Neurology1995;45: 478 – 82
6. Loevner LA, Grossman RI, Cohen JA, et al.Microscopic disease in normal-appearing white matter on conventional MR images in patients with multiple sclerosis: assessment with magnetization-transfer measurements.Radiology
1995;196:511–15
7. Mottershead JP, Schmierer K, Clemence M, et al.High field MRI correlates of myelin content and axonal density in multiple sclerosis: a post-mortem study of the spinal cord.J Neurol2003;250:1293–301
8. Schmierer K, Scaravilli F, Altmann DR, et al.Magnetization transfer ratio and myelin in postmortem multiple sclerosis brain.Ann Neurol2004;56:407–15 9. van Waesberghe JH, Kamphorst W, De Groot CJ, et al.Axonal loss in multiple
sclerosis lesions: magnetic resonance imaging insights into substrates of dis-ability.Ann Neurol1999;46:747–54
10. Ropele S, Strasser-Fuchs S, Augustin M, et al.A comparison of magnetization transfer ratio, magnetization transfer rate, and the native relaxation time of water protons related to relapsing-remitting multiple sclerosis.AJNR Am J Neuroradiol2000;21:1885–91
11. van Walderveen MA, van Schijndel RA, Pouwels PJ, et al.Multislice T1 relax-ation time measurements in the brain using IR-EPI: reproducibility, normal values, and histogram analysis in patients with multiple sclerosis.J Magn Re-son Imaging2003;18:656 – 64
12. Parry A, Clare S, Jenkinson M, et al.White matter and lesion T1 relaxation times increase in parallel and correlate with disability in multiple sclerosis. J Neurol2002;249:1279 – 86
13. Vaithianathar L, Tench CR, Morgan PS, et al.White matter T(1) relaxation time histograms and cerebral atrophy in multiple sclerosis.J Neurol Sci2002; 197:45–50
14. Griffin CM, Chard DT, Parker GJ, et al.The relationship between lesion and normal appearing brain tissue abnormalities in early relapsing remitting multiple sclerosis.J Neurol2002;249:193–99
15. Vaithianathar L, Tench CR, Morgan PS, et al.T1 relaxation time mapping of white matter tracts in multiple sclerosis defined by diffusion tensor imaging. J Neurol2002;249:1272–78
17. Ashburner J, Friston KJ.Voxel-based morphometry: the methods.Neuroimage
2000;11:805–21
18. Lublin FD, Reingold SC.Defining the clinical course of multiple sclerosis: results of an international survey: National Multiple Sclerosis Society (USA) Advisory Committee on Clinical Trials of New Agents in Multiple Sclerosis. Neurology1996;46:907–11
19. Kurtzke JF.Rating neurologic impairment in multiple sclerosis: an expanded disability status scale (EDSS).Neurology1983;33:1444 –52
20. Cutter GR, Baier ML, Rudick RA, et al.Development of a multiple sclerosis functional composite as a clinical trial outcome measure.Brain1999;122: 871– 82
21. Venkatesan R, Lin W, Haacke EM.Accurate determination of spin-density and T1 in the presence of RF-field inhomogeneities and flip-angle miscalibration. Magn Reson Med1998;40:592– 602
22. Jenkinson M, Bannister P, Brady M, et al.Improved optimization for the ro-bust and accurate linear registration and motion correction of brain images. Neuroimage2002;17:825– 41
23. Smith SM, Zhang Y, Jenkinson M, et al.Accurate, robust, and automated lon-gitudinal and cross-sectional brain change analysis.Neuroimage2002;17: 479 – 89
24. Smith SM.Fast robust automated brain extraction.Hum Brain Mapp2002;17: 143–55
25. Zhang Y, Brady M, Smith S.Segmentation of brain MR images through a hidden Markov random field model and the expectation-maximization algo-rithm.IEEE Trans Med Imaging2001;20:45–57
26. Forman SD, Cohen JD, Fitzgerald M, et al.Improved assessment of significant activation in functional magnetic resonance imaging (fMRI): use of a cluster-size threshold.Magn Reson Med1995;33:636 – 47
27. Friston KJ, Worsley KJ, Frackowiak RS, et al.Assessing the significance of focal activations using their spatial extent.Hum Brain Mapp1994;1:210 –20 28. Worsley KJ, Evans AC, Marrett S, et al.A three-dimensional statistical analysis
for CBF activation studies in human brain.J Cereb Blood Flow Metab1992;12: 900 –18
29. Filippi M, Iannucci G, Cercignani M, et al.A quantitative study of water diffu-sion in multiple sclerosis lediffu-sions and normal-appearing white matter using echo-planar imaging.Arch Neurol2000;57:1017–21
30. Steen RG, Schroeder J.Age-related changes in the pediatric brain: proton T1 in healthy children and in children with sickle cell disease.Magn Reson Imaging
2003;21:9 –15
31. Filippi M, Rovaris M, Rocca MA.Imaging primary progressive multiple sclerosis: the contribution of structural, metabolic, and functional MRI tech-niques.Mult Scler2004;10(suppl 1):S36 –S44
32. Castriota-Scanderbeg A, Fasano F, Filippi M, et al.T1 relaxation maps allow differentiation between pathologic tissue subsets in relapsing-remitting and secondary progressive multiple sclerosis.Mult Scler2004;10:556 – 61 33. Pelletier J, Suchet L, Witjas T, et al.A longitudinal study of callosal atrophy and
interhemispheric dysfunction in relapsing-remitting multiple sclerosis.Arch Neurol2001;58:105–11
34. Filippi M, Tortorella C, Rovaris M, et al.Changes in the normal appearing brain tissue and cognitive impairment in multiple sclerosis.J Neurol Neuro-surg Psychiatry2000;68:157– 61
35. Filippi M, Inglese M, Rovaris M, et al.Magnetization transfer imaging to mon-itor the evolution of MS: a 1-year follow-up study.Neurology2000;55:940 – 46 36. Kalkers NF, Hintzen RQ, van Waesberghe JH, et al.Magnetization transfer histogram parameters reflect all dimensions of MS pathology, including atro-phy.J Neurol Sci2001;184:155– 62
37. Rovaris M, Bozzali M, Santuccio G, et al.Relative contributions of brain and cervical cord pathology to multiple sclerosis disability: a study with magneti-sation transfer ratio histogram analysis.J Neurol Neurosurg Psychiatry2000;69: 723–27
38. Rovaris M, Filippi M, Minicucci L, et al.Cortical/subcortical disease burden and cognitive impairment in patients with multiple sclerosis.AJNR Am J Neu-roradiol2000;21:402– 08
39. Rovaris M, Iannucci G, Falautano M, et al.Cognitive dysfunction in patients with mildly disabling relapsing-remitting multiple sclerosis: an exploratory study with diffusion tensor MR imaging.J Neurol Sci2002;195:103– 09 40. Traboulsee A, Dehmeshki J, Peters KR, et al.Disability in multiple sclerosis is
related to normal appearing brain tissue MTR histogram abnormalities.Mult Scler2003;9:566 –73

![Fig 3. Results of pairwise contrasts between multiplesclerosis (MS) groups (primary progressive [PP], relaps-ing-remitting [RR], and secondary progressive [SP]) andcontrol subjects (C) are displayed as Z scores for PPMS � control subjects (top), RR MS � co](https://thumb-us.123doks.com/thumbv2/123dok_us/1119553.630789/5.585.52.374.38.665/contrasts-multiplesclerosis-progressive-remitting-secondary-progressive-andcontrol-displayed.webp)
