MICROFLUIDIC DEVICES FOR PERFORMING MULTIPLEXED IMMUNOASSAYS AND NUCLEIC ACID TESTS
Emily Anna Oblath
A dissertation submitted to the faculty of the University of North Carolina at Chapel Hill in partial fulfillment of the requirements for the degree of Doctor of Philosophy in the Department of Chemistry.
Chapel Hill 2012
Approved by:
J. Michael Ramsey
James W. Jorgenson
R. Mark Wightman
ABSTRACT
EMILY ANNA OBLATH: Microfluidic Devices for Performing Multiplexed Immunoassays and Nucleic Acid Tests
(Under the direction of J. Michael Ramsey)
This work describes the development of microfluidic devices to perform
multiplexed immunoassays and nucleic acid tests for point-of-care (POC) diagnostics.
Diagnostic testing is usually performed at centralized laboratories, imposing a significant
delay in treatment. In contrast, POC testing is performed by the primary healthcare
provider, and the results can be used to implement proper treatment immediately. Saliva
can be an ideal sample for POC diagnostics since it is easily collected and contains many
disease biomarkers. This work focuses on using saliva to monitor and diagnose
pulmonary diseases. Cytokine biomarkers are measured as early indicators for asthma or
cystic fibrosis, while DNA is characterized to identify bacteria that can cause respiratory
infections.
The first device described uses sandwich immunoassays to measure cytokines.
The polydimethylsiloxane (PDMS)-glass hybrid chip integrated microfluidic channels
with a 900-well microarray. The wells were loaded with antibody-functionalized
microspheres from a random mixture. An encoding strategy was used for multiplexed
assays so that microspheres functionalized with antibodies for one analyte could be
distinguished from microspheres for another analyte. Optimization of the assay for
and IL-8. The optimized assay required less than one hour, and the theoretical limits of
detection were found to be well below physiological levels reported in the literature.
A second device was developed to integrate DNA extraction and polymerase
chain reaction (PCR) amplification for the detection of bacteria found in saliva. Sample
extraction is a particularly challenging problem for POC, PCR-based diagnostics. In this
device, DNA extraction was accomplished by filtering samples through an aluminum
oxide membrane (AOM) integrated with a PDMS-glass channel structure. Parallel
reaction wells located above the AOM were used to perform multiplexed analyses.
Several designs and detection strategies were explored as the device was optimized. The
final format incorporated 7 reaction wells and real-time detection with fluorescent probes
or an intercalating dye. Detection of as little as 8-12 copies of purified template DNA
was achieved. The successful identification of bacteria and spiked genomic DNA in
ACKNOWLEDGEMENTS
I would like to thank my advisor, J. Michael Ramsey, for the opportunity to work
in his research group and for his support and guidance of my research. I also thank all
the members of the Ramsey group for their help over the past 5 years. In particular, J.P.
Alarie, Hamp Henley, and Patty Dennis were indispensable for teaching me how to use
the instruments in lab, for helpful discussions when experiments didn’t work, and for
their many contributions to my research. Finally, I would like to thank my family and
TABLE OF CONTENTS
LIST OF TABLES... xi
LIST OF FIGURES ... xii
LIST OF ABBREVIATIONS AND SYMBOLS... xvi
Chapter I. INTRODUCTION TO POINT-OF-CARE SALIVARY DIAGNOSTICS... 1
1.1 Microfluidics and Point-of-care Diagnostics... 1
1.2 Saliva... 3
1.3 Immunoassays... 7
1.4 Detection and Identification of Bacteria ... 10
1.5 Research Goals and Objectives... 13
1.6 References ... 15
II. MICROFLUIDIC BEAD-BASED IMMUNOASSAY CHIP... 21
2.1 Introduction... 21
2.2 Materials and Methods ... 24
Materials and Reagents ... 24
Chip Fabrication... 26
Image Collection and Analysis... 30
2.3 Results and Discussion... 32
Surface Passivation ... 32
Incubation Temperature ... 33
Assay Step Elimination ... 35
Incubation Time... 35
Reagent Concentration ... 37
Limit of Detection... 38
2.4 Conclusions and Future Directions... 39
2.5 Tables and Figures ... 42
2.6 References ... 50
III. MICROFLUIDIC PCR CHIP INCORPORATING DNA EXTRACTION... 55
3.1 Introduction... 55
3.2 Materials and Methods ... 59
Materials and Reagents ... 59
Tube-Mounted AOMs ... 60
PCR Chip Design and Fabrication... 62
PCR Development... 64
Microarray Hybridization Assays ... 65
3.3 Results and Discussion... 67
DNA Extraction ... 67
Primer Spotting on AOMs... 71
Initial Development of a PCR Chip ... 73
PCR Inhibition from AOMs ... 74
On-Chip DNA Extraction and PCR ... 77
Microarray Hybridization Assay... 79
3.4 Conclusions... 81
3.5 Tables and Figures ... 85
3.6 References ... 106
IV. MICROFLUIDIC CHIP FOR REAL-TIME PCR ... 111
4.1 Introduction... 111
4.2 Materials and Methods ... 113
Materials and Reagents ... 113
Chip Design and Fabrication ... 115
Instrument Set-Up and Detection... 116
PCR Development... 116
4.3 Results and Discussion... 118
Primer Testing and Sensitivity... 118
Cross-Contamination Between Wells ... 119
Simultaneous Multi-Analyte Detection... 121
Test of Cell Lysate ... 121
Detection of Bacteria in Saliva ... 122
4.4 Conclusions... 123
4.5 Tables and Figures ... 126
V. PRIMER DELIVERY, RESTRICTION ENZYMES,
AND FUTURE DIRECTIONS FOR THE PCR CHIP ... 141
5.1 Introduction... 141
5.2 Materials and Methods ... 143
Materials and Reagents ... 143
Primer Beads... 144
Primer Delivery... 145
Restriction Enzyme Digestions... 145
5.3 Results and Discussion... 146
Primer Spotting and On-Chip PCR... 146
Primer Beads and On-Chip PCR... 150
Storage of Primer Beads On-chip ... 150
Primer Dimers... 152
Template Digestion with Restriction Enzymes ... 157
5.4 Conclusions and Future Directions... 159
5.5 Tables and Figures ... 163
LIST OF TABLES
Table
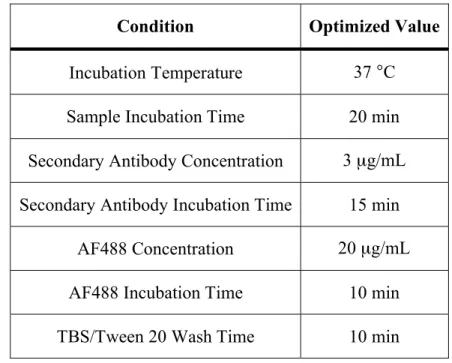
2.1. Optimized conditions for microfluidic bead-based
immunoassays ... 42 2.2. Theoretical limits of detection for individual cytokines
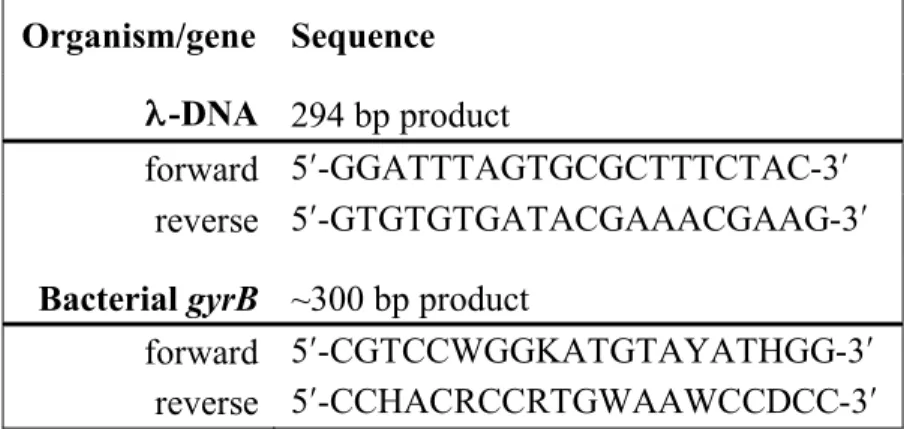
in buffer and saliva ... 42 3.1. Primer sequences for -DNA and gyrB targets ... 85
3.2. Primer and probe sequences for control organisms used
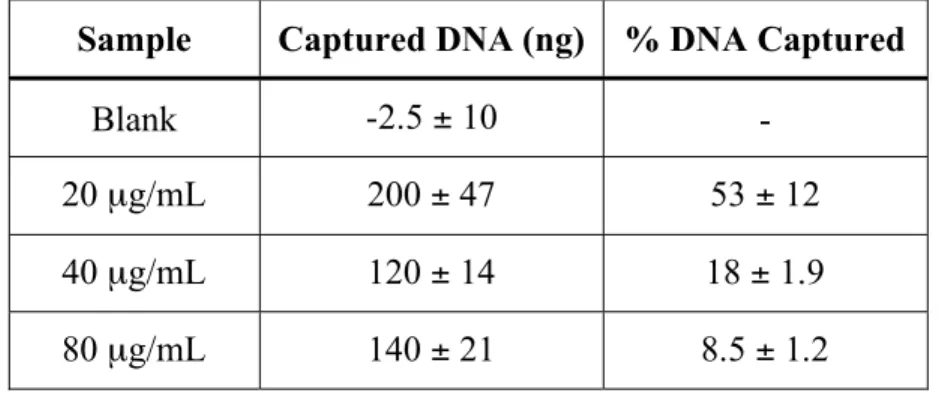
with the hybridization array ... 85 3.3. Effect of -DNA concentration on the amount of DNA
captured with a tube-mounted AOM... 86 3.4. Effect of the method used to move solutions through the
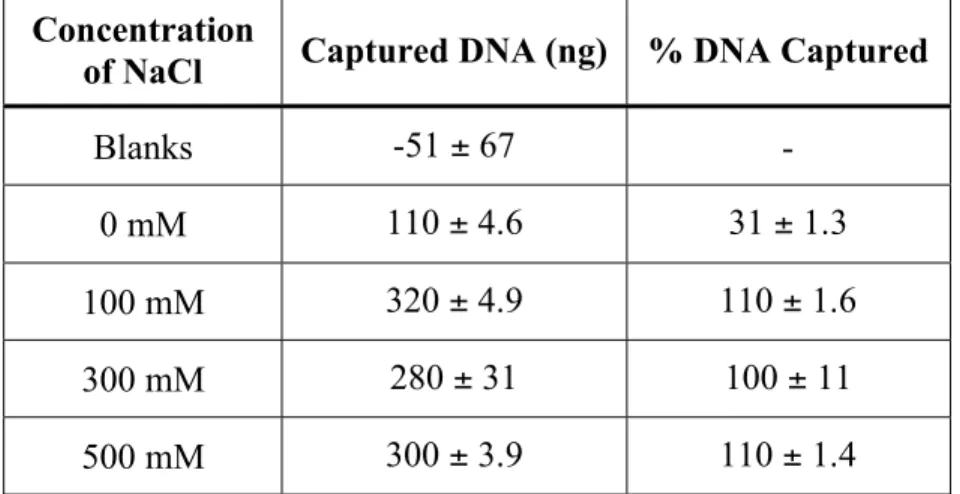
AOM on the amount of DNA captured ... 86 3.5. Effect of NaCl concentration on DNA capture with
tube-mounted AOMs ... 87 3.6. Effect of buffer concentration on DNA capture with
tube-mounted AOMs ... 87 3.7. Results of the initial test of the hybridization assay with
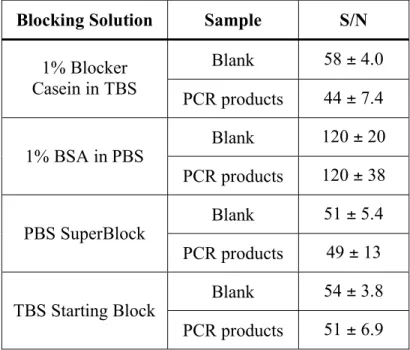
oligonucleotide functionalized microspheres... 88 3.8. Results of hybridization assays comparing four different
blocking solutions... 88 4.1. Primer and probe sequences for the target organisms and
genes ... 126 5.1. Average concentration of products from PCR with
undigested and digested template for three template and
LIST OF FIGURES
Figure
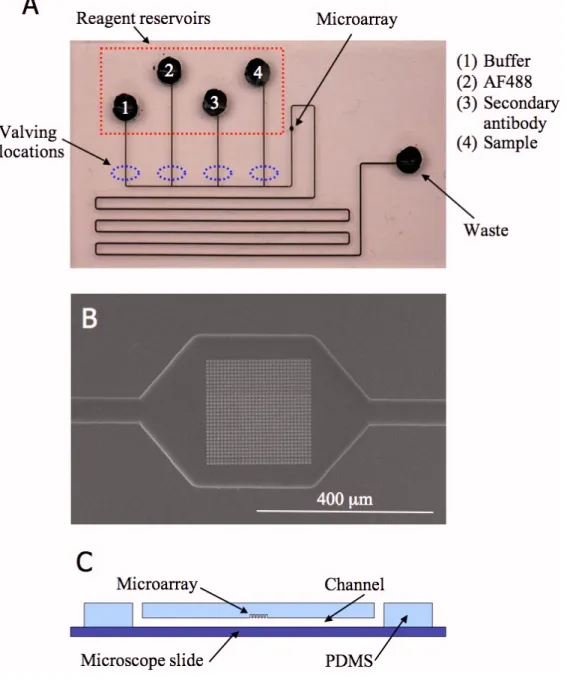
2.1. An image of the immunoassay chip (A), an SEM image of an FIB milled array (B), and a schematic of the
cross-section of a chip (C) ... 43 2.2. Schematic of the sandwich assay used with the Walt
group microspheres ... 44 2.3. Example (A) encoding and (B) assay images from a
VEGF assay ... 45 2.4. Results of assays comparing eight different dynamic
coatings and a silane coating ... 46 2.5. Results of (A) secondary antibody and (B) cytokine
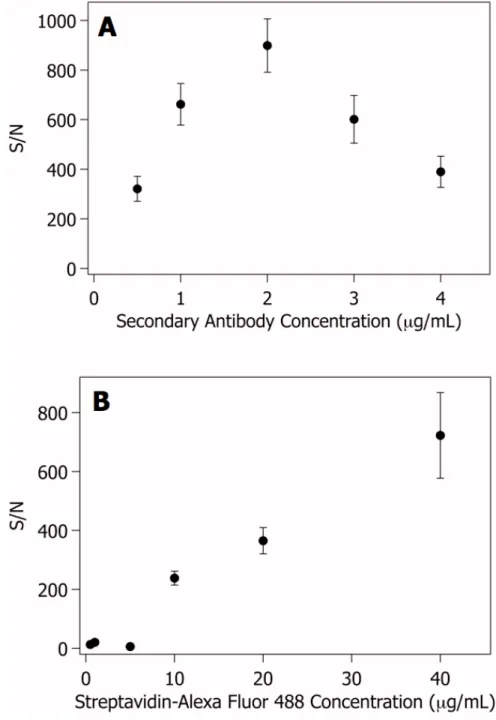
incubation time optimization for VEGF... 47 2.6. Results of (A) secondary antibody and (B) AF488
concentration optimization for VEGF... 48 2.7. Results of the limit of detection determination for VEGF
in buffer ... 49 3.1. An image of a tube-mounted AOM... 89 3.2. An image of the PCR chip (A) and a schematic of its
cross-section (B) ... 90 3.3. An image of the aluminum plate used to thermocycle
the PCR chips (A) and a plot of the temperatures measured during thermocycling in a tube and on a chip
(B) ... 91 3.4. Schematic of the hybridization assay for detecting PCR
products ... 92 3.5. Fluorescence images of an AOM before primer spotting
(A), after primer spotting (B), and after washing with
25 μL of water (C) ... 93 3.6. Results of PCR of -DNA captured on a tube-mounted
3.7. Results of PCR of -DNA captured on a tube-mounted
AOM with pre-spotted primers... 95 3.8. Images of two prototype PCR chips... 96 3.9. Plot of the concentration of PCR products vs. the mass
of AOM added to the reaction ... 97 3.10. Plot of the concentration of PCR products vs. the
concentration of Taq polymerase ... 98 3.11. Results of PCR comparing seven different blocking
agents to prevent PCR inhibition from AOMs (A) and testing three of the best blocking agents with additional
Taq polymerase (B) ... 99 3.12. Results of on-chip PCR of gDNA from S. pneumoniae
and S. aureus... 100 3.13. Results of on-chip PCR of gDNA from H. influenzae
and S. salivarius... 101 3.14. Results of on-chip PCR of gDNA from S. mutans and
S. mitis... 102 3.15. Results of on-chip nucleic acid extraction and PCR of
gDNA from S. pneumoniae and S. aureus with primers
pre-spotted into the reaction wells... 103 3.16. Results of on-chip nucleic acid extraction and PCR of
gDNA from H. influenzae and S. salivarius with
primers pre-spotted into the reaction wells... 104 3.17. Results of PCR with multiplexed primers for control
organisms ... 105 4.1. An image of the 7-well rt-PCR chip (A) and a schematic
of its cross-section (B)... 127 4.2. Images of the molds used to make the 7-well PDMS
reservoirs ... 128 4.3. Image of the rt-PCR instrument set-up... 129 4.4. Real-time amplification plots for S. mutans 16S rRNA
4.5. Real-time amplification plot for varying amounts of MSSA gDNA testing the limit of detection of the S.
aureus nuc primer set ... 131 4.6. Fluorescence Images (A) and amplification plot (B)
from testing for cross-contamination ... 132 4.7. Real-time amplification plots showing simultaneous
detection of multiple genes... 133 4.8. Real-time amplification plot for DNA extracted from
MSSA cell lysate... 134 4.9. Real-time amplification plot for DNA extracted from
whole saliva ... 135 4.10. Real-time amplification plots for DNA extracted from
whole saliva spiked with 0.33 pg (100-125 copies) of
(A) MSSA or (B) MRSA gDNA... 136 5.1. Real-time amplification plot for MSSA and MRSA
gDNA with S. aureus nuc primers and probes
pre-spotted into the wells... 164 5.2. Real-time amplification plot (A) and Bioanalyzer results
(B) for MSSA gDNA with and without a wash step after
pre-spotting S. aureus nuc primers and probes... 165 5.3. Results of PCR of MSSA gDNA with S. aureus nuc
primers pre-spotted onto tube-mounted AOMs ... 166 5.4. Real-time amplification plot of the S. aureus nuc gene
using primer beads ... 167 5.5. Real-time amplification plot with S. aureus nuc primer
beads stored on-chip for 39 days at 4 °C... 168 5.6. Real-time amplification plot with S. aureus nuc primer
beads stored on-chip for 62 days at room temperature ... 169 5.7. Real-time amplification plot (A) and Bioanalyzer results
(B) from PCR with S. aureus nuc beads showing primer
dimers ... 170 5.8. Real-time amplification plot (A) and Bioanalyzer results
(B) from PCR with S. mutans 16S rRNA primers with
5.9. Results of annealing temperature optimization for S. aureus nuc primer beads (A) and S. mutans 16S rRNA
primers with flaps (B)... 172 5.10. Real-time amplification plot (A) and Bioanalyzer
results (B) from on-chip PCR with S. aureus nuc
primer beads and an annealing temperature of 68 °C... 173 5.11. Real-time amplification plot (A) and Bioanalyzer
LIST OF ABBREVIATIONS AND SYMBOLS
AF488 Alexa Fluor 488 streptavidin conjugate
AOM Aluminum oxide membrane BOE Buffered oxide etchant
bp Base pairs
BSA Bovine serum albumin
CCD Charge-coupled device
CE Capillary electrophoresis
CNC Computer numeric controlled
Ct Cycle threshold
DI Deionized
DNA Deoxyribonucleic acid
dNTPs Deoxyribonucleotides DRIE Deep reactive-ion etching
EDTA Ethylenediaminetetraacetic acid ELISA Enzyme-linked immunosorbent assay EMCCD Electron multiplying charge-coupled device
EtBr Ethidium bromide
FAM Carboxyfluorescein FIB Focused ion beam
fM Femtomolar g Grams
hr Hour
IaBkQ Iowa Black Dark Quencher FQ
IL-8 Interleukin-8
KCl Potassium chloride
keV Kiloelectron volt
LiCl Lithium chloride
LOC Lab-on-a-chip LOD Limit of detection M Molar mg Milligrams MgCl2 Magnesium chloride min Minutes
mL Milliliters mM Millimolar mol Moles
mRNA Messenger ribonucleic acid
MRSA Methicillin-resistant Staphylococcus aureus ms Milliseconds
MSSA Methicillin-susceptible Staphylococcus aureus μg Micrograms
NaCl Sodium chloride
NCBI National Center for Biotechnology Information ng Nanograms
nm Nanometers nmol Nanomoles
PBP Penicillin-binding protein PBS Phosphate buffered saline
PCR Polymerase chain reaction PDMS Poly(dimethylsiloxane)
PEG Polyethylene glycol
pg Picograms POC Point-of-care
PVP Polyvinylpyrrolidone
RNA Ribonucleic acid
RTD Resistance temperature detector rt-PCR Real-time polymerase chain reaction rxn Reaction
s Seconds SDS Sodium dodecyl sulfate S/N Signal-to-noise ratio SSC Saline sodium citrate buffer TBS Tris-buffered saline
UV Ultraviolet
CHAPTER 1
INTRODUCTION TO POINT-OF-CARE SALIVARY DIAGNOSTICS 1.1 Microfluidics and Point-of-care Diagnostics
Microfluidics concerns the behavior and manipulation of fluids on the micro-scale. It can be used as a strategy for taking macro-scale techniques and procedures and adapting them onto a device to perform the same actions on the microscale. Ideally, microfluidics would integrate all the steps for a procedure usually performed on the bench top into a single device, a micro total analysis system (μTAS) or Lab-on-a-chip (LOC).1-4 Often that device can take the form of a small chip, something comparable to a microscope slide, that contains millimeter- to micrometer-scale fluidic channels and features for manipulating and transporting fluids from one region of the chip to another.3, 5, 6 If possible, the chip would provide sample-in answer-out capability, with little or no
interaction from the user.1, 3-5, 7-11 The detection method of the ‘answer’ could be integrated as part of the chip or could be housed in a separate instrument.11, 12
The initial motivation for miniaturization with microfluidics was to improve performance in applications requiring high resolution separations and sensitive
materials eventually moved towards polymers, such as poly(dimethysiloxane) (PDMS), that are more suitable for biological samples, require less complex fabrication procedures for components like pumps and valves, and are less expensive.3, 5, 9 Further research shifted towards integrating multiple steps, such as separation and detection, onto a single device.3, 5, 7, 9 This led to the potential for automation of analytical techniques with extremely easy to use devices, one of the biggest advantages of microfluidics.1, 5, 11
The sample-in answer-out promise of microfluidics makes it extremely well suited for point-of-care (POC) diagnostics. The goal of POC diagnostics is to perform analyses at or near where the patient is receiving care.13, 14 An ideal test would be fast enough for the patient to receive results while waiting in the doctor’s office, emergency room, or at home. Current diagnostic testing typically takes place at centralized labs.11, 13-15 Samples must be collected, sometimes at the point-of-care, sometimes at a separate
testing site such as a LabCorp or Quest Diagnostics lab, and then packaged and
transported to the testing facilities for analysis. Depending on the tests ordered and the frequency at which the results are reported, the results may not be available to the care providers for many days.14-16 It may take even longer for the results to be communicated to the patient and for any necessary treatment decisions to be made. POC testing reduces the turn-around time to get results, eliminates sample packaging and transportation costs, decreases labor costs, and lowers the chances of contaminated, mislabeled, and lost samples.15, 16 The fast turn-around time of POC testing can even improve patient
required and need for trained personnel at a centralized laboratory to obtain the information necessary to monitor or make treatment decisions.
1.2 Saliva
Whole saliva is made up of components from many sources. It contains secretions from the parotid, submandibular, sublingual, and minor salivary glands, crevicular fluid from the oral mucosa, as well as bacteria, leukocytes, and sloughed epithelial cells.17 Each salivary gland contributes different mixtures of proteins to the whole saliva.18 Saliva serves many purposes important for both oral health and overall health. The continuous flow of saliva washes bacteria and food out of the mouth, and the saliva also acts as a buffer, neutralizing acid and protecting tooth enamel.18 Saliva also begins digesting food as it is eaten, and aids in swallowing the food.18 Without saliva, teeth would quickly decay and the mouth would be vulnerable to infections. Individuals with chronically dry mouth, such as those with Sjögren’s syndrome, often develop serious problems with tooth decay and cavities.19
22-24 Levels and types of bacteria in saliva have been linked to periodontal health, bad
breath, and pancreatic cancer.25-27 If analyte levels correlate with those found in other samples and lower analyte concentration is not a critical problem, saliva offers many advantages over blood samples. Saliva is easier to obtain with painless, non-invasive collection that does not require phlebotomy. Collecting saliva is less dangerous than blood collection for the person doing the collecting, and, with fewer privacy concerns, it is easier to maintain a chain of custody for saliva samples than for urine samples.16, 20
There are many ways to collect both whole saliva and saliva from individual glands. The most basic collection method is unstimulated collection of whole saliva through draining or drooling. The patient allows saliva to drain out of their mouth into a container with minimal mouth movement.28 Evaporation during the collection time can be problematic for the draining method, so spitting can be used as an alternative although it does have a stimulating effect on the saliva flow.28 Chewing on paraffin wax or
unflavored chewing gum, and introducing citric acid to the mouth have also been used to stimulate saliva flow for collection.28, 29 Swabs and commercially available absorbent pads can also be used for whole saliva collection.28, 29 Suction methods can be used to collect either whole saliva or secretions from the individual glands, but require more training and specialized equipment, and are more invasive for the patient.28
and under the same environmental conditions, and limiting eating and drinking for a period of time, usually 1-2 hours, prior to sample collection.17, 30, 31 Flow rates and composition of saliva can vary greatly between samples, even for the same individual, so saliva may sometimes be better suited for qualitative tests than for quantitative tests.18, 20, 29
If the target analytes include protein or enzyme biomarkers, care must be taken to preserve them until the analysis is performed. The bacteria and digestive enzymes found in saliva have proteolytic activity and will alter the concentrations of proteins in the sample if not stopped.17, 29 Collecting saliva on ice can slow or stop the degradation of proteins in the sample.17, 29 The addition of protease inhibitors such as EDTA,
biomarkers.17, 29 Alpha amylase is another highly prevalent protein in saliva, and it can be selectively removed to allow detection of lower abundance proteins.32 As with the removal of mucins, this is only useful if the biomarker proteins are not also removed.
If the purpose of the saliva sample is for bacterial culture, the collection
conditions will not affect the results as much as for proteins.17 Because saliva is constantly flowing, bacteria will be constantly shed from the surfaces in the mouth.33 The biggest effect on saliva samples for culture is the behavior of the patient. Diet,
tooth-cleaning habits, and whether the patient has taken antibiotics recently will all affect the
levels and types of bacteria found in the mouth.33 Some patients use more effective toothbrushing that is different from their usual habits prior to visiting the dentist.33 This can temporarily lower the amounts of bacteria in the mouth but, since the behavior
usually does not continue after the visit to the dentist, levels will quickly return to
normal.33 A final consideration in collecting saliva for bacterial culture is that culture media appropriate for the target organisms should be used during any storage or transport
steps to keep the bacteria viable.17
If the target analytes are nucleic acids, care must be taken to avoid their
breakdown before analysis. Salivary RNA biomarkers have been identified, and if those
are to be measured special care must be taken to stabilize the RNA.29 Ambient
temperature RNA stabilizers are available commercially and can be added to the samples
after collection, but storage at or below -20 °C is still recommended.29, 31 DNA degrades more slowly, so stabilization is not as critical.31 If the target analytes include DNA or RNA from the bacteria or other microorganisms found in saliva, the same considerations
apply. Many biomarkers, including proteins and some salivary RNA, are primarily found in saliva supernatant, and a centrifugation step is often incorporated before storage and analysis of the sample.29 This is not the case for genomic DNA (gDNA) from human cells and other microorganisms that is instead found in the solid components of saliva.31
Saliva is an attractive sample for use with POC testing and LOC since it is easy to collect.16, 21 However, because of its mucin aggregates and viscous nature, saliva can be incompatible with microfluidic devices.30 Sample processing must be performed after collection to prevent the sample from clogging or fouling the microfluidic device. Freeze-thaw cycles and centrifugation can greatly decrease viscosity, but are not very practical in a POC setting.29 Filters have been used instead to remove large proteins and any particles from the sample.30 As with any other processing step, it must be verified that the filter doesn’t also remove the analyte from the sample.
1.3 Immunoassays
For protein analytes, an immunoassay is often the analytical method of choice.34 Immunoassays are tests that use antibody-antigen interactions to detect analytes in the sample such as hormones, cytokines, and other antibodies.34-36 The immunoassay principle was first described by Yalow and Berson in 1959 with an assay for insulin that used radioactive labels for detection.37 Their assay was a competitive immunoassay, in which a labeled antigen competes with unlabeled antigen in the sample for a limited number of antibody binding sites. The proportion of labeled antigen bound to the antibodies is measured and the concentration of sample antigen determined.35 For a competitive immunoassay, the signal is inversely proportional to the analyte
Another type of immunoassay is the reagent excess or sandwich immunoassay, which uses two antibodies. The first antibody is immobilized onto a surface and captures the antigen from the sample. A wash step removes unbound sample, and a labeled secondary antibody is brought in that will bind to the antigen-antibody complex on the surface. Unbound secondary antibody is then washed away and the signal from the surface measured to determine the concentration.35 Because they rely on two antibodies specific to the antigen, sandwich immunoassays are less likely than some other types of immunoassays to return false positive results.38 The low background, due to signal increasing with analyte concentration, also tends to make sandwich assays more
sensitive.38 One drawback to sandwich immunoassays is that finding two antibodies with different binding sites is difficult for some antigens.38 Radioactive labels were originally used for immunoassays, but fluorescent labels have become much more common.34, 36, 38, 39 If an enzyme is used as the label for a sandwich immunoassay, it is known as an
ELISA.35, 40 ELISAs add an additional step by bringing in the substrate to react with the enzyme and then detecting the product of that reaction. The amplification resulting from the enzyme reaction makes ELISAs even more sensitive than standard sandwich
assays.35, 40
devices like home pregnancy tests. The advantages of immunoassays make it an
attractive technique to use in a LOC device for protein biomarkers in saliva. All types of immunoassays have been adapted onto microfluidic devices, with sandwich assays and ELISAs being very common.41 Multiplexed immunoassays for more than one analyte have been performed on microfluidic devices. One strategy for multiplexing is to use microarrays. With microarray devices the capture antibodies are immobilized in an array on a surface within the microfluidic device and the assays for all analytes are performed simultaneously.22, 42-46
Adapting immunoassays onto microfluidic devices for POC diagnostics combines the advantages of immunoassays with those of microfluidics, but it requires some special considerations compared to immunoassays performed under standard conditions in microtiter plates. The surface area-to-volume ratios in microfluidic devices are very high, so the characteristics of the surface and its compatibility with immunoassays are a concern. Surface modification with a coating or the addition of blocking buffers to reagent solutions is often necessary to prevent adsorption of antigen or other reagents to the channel walls.44, 47-49 Another consideration is that at the small scale of microfluidic channels, fluid flow is laminar. If diffusion is not sufficient enough to transport antigens or secondary antibodies to the immobilized capture antibody (for a sandwich assay), mixers may need to be designed into the device.48 Many types of mixers have been developed for microfluidic devices that can be used if necessary.8-10 A final
with microtiter plates, it can be difficult to generate a calibration curve on a microfluidic device.
1.4 Detection and Identification of Bacteria
In addition to targeting protein analytes, diagnostic tests are also performed to detect bacteria and other microorganisms that cause infectious diseases. Currently,
collected samples are usually sent to a centralized laboratory for cell culture.14, 50-52 After culture, the bacteria are identified by their phenotypic characteristics. Morphologic features, growth variables, gram staining, and the growth media are just a few of the characteristics that can be used to identify the species.53, 54 To identify the particular strain of bacteria, susceptibility to antibiotics, protein profiles, and bacteriophage analysis can be used.53, 54 Culture-based tests are adequate for some situations, but there are many drawbacks.55 Culture methods are slow and labor intensive, often taking several days for results to be returned.50, 51, 53-55 If antibiotic susceptibility must be determined, additional testing time is needed.56 Many organisms also have similar characteristics, making correct identification difficult.53 Another problem with culture-based identification is that not all organisms can be cultured.14, 56-58 The culture methods used with diagnostic samples tend to be biased towards well known, well characterized species.57
specific DNA sequence from a template strand using oligonucleotide primers and
deoxynucleotide triphosphates (dNTPs). The reaction cycles through three temperature
steps and with each cycle the amount of DNA is theoretically doubled. The first step is
denaturation, at a temperature from 90-95 °C, to melt the double-stranded DNA into single-stranded DNA. The second step is annealing, usually at a temperature near 55 °C for about 30 s, to allow the primers to hybridize to the template strands. The final step is
extension, at a temperature near 72 °C for 0.5-3 min, where the DNA polymerase extends the primers and replicates the DNA sequence. The 3-step cycle is repeated 30 or more
times with a longer denaturation step before the first cycle and a longer extension step
after the final cycle. The exponential amplification from thermocycling makes PCR a
very sensitive technique – it can be used to detect as little as one copy of template DNA
in a sample.
For PCR-based diagnostic testing, samples are still sent to a centralized laboratory
for processing. A typical PCR test requires sample preparation steps, expensive
equipment and reagents, and trained technicians.1, 16, 58, 62 Sample preparation steps are necessary because template DNA often needs to be released from the nucleus of the cells
and because PCR inhibitors are often present that, if not removed, may cause false
negatives.59, 63 These labor-intensive steps mean that at centralized labs the tests are usually performed once a day in large batches, so the minimum time for obtaining results
is about 24 hours.56, 58 Adapting PCR onto a microfluidic device can make it amenable to POC diagnostics. Some advantages of microfluidic PCR tests over tube-based
procedures include lower consumption of expensive reagents, faster cycling times, lower
LOC incorporating PCR for diagnostic testing could be portable, with disposable chips to eliminate contamination between samples. Devices could also incorporate parallel processing units to increase throughput and identify multiple strains or species of bacteria simultaneously.50, 62, 66, 67
As with any microfluidic device, the exact design and materials used in a PCR chip will vary depending on the application. Regardless of the application, for PCR microfluidics there are two main design strategies. The first strategy is stationary chamber PCR. The PCR solution is kept stationary inside a reaction chamber and the temperature of the chamber is cycled. This design is similar to tube-based PCR testing, and has the advantages of simple chip configuration and great flexibility in the length of the thermocycling steps and in the number of cycles.1, 14, 66, 67 The second strategy is flow through PCR. The PCR solution continuously flows through different zones of the chip that are held at constant temperatures. This design can achieve extremely fast
thermocycling times since only the thermal mass of the sample must be heated and cooled rather than the entire chip. A major drawback of this design is that the number of cycles is usually fixed by the channel layout so it is not as flexible as the chamber
design.1, 14, 66, 67 Either chip design can be integrated with different types of sample processing, heating strategies, and post-PCR analysis and detection of products.67
channel surfaces will inhibit PCR, so various passivation strategies are used to reduce or prevent the adsorption. Bovine serum albumin (BSA) and polyvinylpyrrolidone (PVP) are two common PCR additives used for dynamic surface passivation.67, 68 Static surface passivation by coating the channels with a PCR friendly substance is another way to reduce adsorption.63, 67 Inhibition can also be caused by materials used in the fabrication of chips, so the fabrication choices may be restricted if a reaction is particularly
sensitive.63, 67 Sample components other than the target DNA are another source of
inhibition that can be addressed by integrating sample preparation onto the microchip.69-73 The extraction technique used will depend on the application.
1.5 Research Goals and Objectives
techniques, easy to fabricate devices and prototype potential chip designs, and it is generally compatible with biological systems.74, 75
This project is part of a collaboration with the Walt group at Tufts University (biomarker screening and immunoassay development), Ahura Scientific (control
1.6 References
1. Kricka, L. J.; Wilding, P., Microchip PCR. Analytical and Bioanalytical Chemistry 2003, 377, (5), 820-825.
2. Manz, A.; Graber, N.; Widmer, H. M., Miniaturized Total Chemical Analysis Systems: a Novel Concept for Chemical Sensing. Sensors and Actuators B-Chemical 1990, 1, (1-6), 244-248.
3. Reyes, D. R.; Iossifidis, D.; Auroux, P.-A.; Manz, A., Micro Total Analysis Systems. 1. Introduction, Theory, and Technology. Analytical Chemistry 2002, 74, (12), 2623-2636.
4. West, J.; Becker, M.; Tombrink, S.; Manz, A., Micro Total Analysis Systems: Latest Achievements. Analytical Chemistry 2008, 80, (12), 4403-4419.
5. Whitesides, G. M., The origins and the future of microfluidics. Nature 2006, 442, (7101), 368-373.
6. Walt, D. R., Miniature Analytical Methods for Medical Diagnostics. Science 2005, 308, (5719), 217-219.
7. Arora, A.; Simone, G.; Salieb-Beugelaar, G. B.; Kim, J. T.; Manz, A., Latest Developments in Micro Total Analysis Systems. Analytical Chemistry 2010, 82, (12), 4830-4847.
8. Auroux, P.-A.; Iossifidis, D.; Reyes, D. R.; Manz, A., Micro Total Analysis Systems. 2. Analytical Standard Operations and Applications. Analytical Chemistry 2002, 74, (12), 2637-2652.
9. Dittrich, P. S.; Tachikawa, K.; Manz, A., Micro Total Analysis Systems. Latest Advancements and Trends. Analytical Chemistry 2006, 78, (12), 3887-3907. 10. Vilkner, T.; Janasek, D.; Manz, A., Micro Total Analysis Systems. Recent
Developments. Analytical Chemistry 2004, 76, (12), 3373-3386.
11. Weigl, B.; Domingo, G.; LaBarre, P.; Gerlach, J., Towards non- and minimally instrumented, microfluidics-based diagnostic devices. Lab on a Chip 2008, 8, (12), 1999-2014.
12. Janasek, D.; Franzke, J.; Manz, A., Scaling and the design of miniaturized chemical-analysis systems. Nature 2006, 442, (7101), 374-380.
14. Park, S.; Zhang, Y.; Lin, S.; Wang, T.-H.; Yang, S., Advances in microfluidic PCR for point-of-care infectious disease diagnostics. Biotechnology Advances 2011, 29, (6), 830-839.
15. Lee-Lewandrowski, E.; Lewandrowski, K., Perspectives on Cost and Outcomes for Point-of-Care Testing. Clinics in Laboratory Medicine 2009, 29, (3), 479-489. 16. Hart, R. W.; Mauk, M. G.; Liu, C.; Qiu, X.; Thompson, J. A.; Chen, D.;
Malamud, D.; Abrams, W. R.; Bau, H. H., Point-of-care oral-based diagnostics. Oral Diseases 2011, 17, (8), 745-752.
17. Söderling, E., Practical Aspects of Salivary Analyses. In Human Saliva: Clincal Chemistry and Microbiology, Tenovuo, J. O., Ed. CRC Press, Inc.: Baco Raton, FL, 1989; Vol. I, pp 1-24.
18. Amerongen, A. v. N.; Veerman, E. C. I.; Vissink, A., Saliva: Properties and functions. In Salivary Diagnostics, Wong, D. T., Ed. Wiley-Blackwell: Ames, Iowa, 2008; pp 27-36.
19. Fox, P. C., Sjögren's syndrome. In Salivary Diagnostics, Wong, D. T., Ed. Wiley-Blackwell: Ames, Iowa, 2008; pp 189-197.
20. Hofman, L. F., Human saliva as a diagnostic specimen. Journal of Nutrition 2001, 131, (5), 1621S-1625S.
21. Malamud, D., Saliva as a Diagnostic Fluid. Dental Clinics of North America 2011, 55, (1), 159-178.
22. Blicharz, T. M.; Siqueira, W. L.; Helmerhorst, E. J.; Oppenheim, F. G.; Wexler, P. J.; Little, F. F.; Walt, D. R., Fiber-Optic Microsphere-Based Antibody Array for the Analysis of Inflammatory Cytokines in Saliva. Analytical Chemistry 2009, 81, (6), 2106-2114.
23. Liu, C.; Qiu, X.; Ongagna, S.; Chen, D.; Chen, Z.; Abrams, W. R.; Malamud, D.; Corstjens, P. L. A. M.; Bau, H. H., A timer-actuated immunoassay cassette for detecting molecular markers in oral fluids. Lab on a Chip 2009, 9, (6), 768-776. 24. Tan, W.; Sabet, L.; Li, Y.; Yu, T.; Klokkevold, P. R.; Wong, D. T.; Ho, C.-M.,
Optical protein sensor for detecting cancer markers in saliva. Biosensors & Bioelectronics 2008, 24, (2), 266-271.
25. Farrell, J. J.; Zhang, L.; Zhou, H.; Chia, D.; Elashoff, D.; Akin, D.; Paster, B. J.; Joshipura, K.; Wong, D. T. W., Variations of oral microbiota are associated with pancreatic diseases including pancreatic cancer. Gut 2012, 61, (4), 582-588. 26. Kurata, H.; Awano, S.; Yoshida, A.; Ansai, T.; Takehara, T., The prevalence of
27. Petti, S.; Pezzi, R.; Cattaruzza, M. S.; Osborn, J. F.; Darca, A. S., Restoration related salivary Streptococcus mutans level: A dental caries risk factor? Journal of Dentistry 1997, 25, (3-4), 257-262.
28. Vissink, A.; Wolff, A.; Veerman, E. C. I., Saliva Collectors. In Salivary Diagnostics, Wong, D. T., Ed. Wiley-Blackwell: Ames, Iowa, 2008; pp 37-59. 29. Veerman, E. C. I.; Vissink, A.; Wong, D. T.; Amerongen, A. v. N., Processing and storage of saliva samples. In Salivary Diagnostics, Wong, D. T., Ed. Wiley-Blackwell: Ames, Iowa, 2008; pp 69-76.
30. Helton, K. L.; Nelson, K. E.; Fu, E.; Yager, P., Conditioning saliva for use in a microfluidic biosensor. Lab on a Chip 2008, 8, (11), 1847-1851.
31. Jiang, J.; Park, N. J.; Hu, S.; Wong, D. T., A universal pre-analytic solution for concurrent stabilization of salivary proteins, RNA and DNA at ambient
temperature. Archives of Oral Biology 2009, 54, (3), 268-273.
32. Deutsch, O.; Fleissig, Y.; Zaks, B.; Krief, G.; Aframian, D. J.; Palmon, A., An approach to remove alpha amylase for proteomic analysis of low abundance biomarkers in human saliva. Electrophoresis 2008, 29, (20), 4150-4157. 33. Bratthall, D.; Carlsson, P., Clinical Microbiology of Saliva. In Human Saliva:
Clincal Chemistry and Microbiology, Tenovuo, J. O., Ed. CRC Press, Inc.: Boca Raton, FL, 1989; Vol. II, pp 203-241.
34. Gosling, J. P., A Decade of Development in Immunoassay Methodology. Clinical Chemistry 1990, 36, (8), 1408-1427.
35. Davies, C., Introduction to Immunoassay Principles. In The Immunoassay Handbook, 2nd ed.; Wild, D., Ed. Nature Publishing Group: New York, NY, 2001; pp 3-40.
36. Luppa, P. B.; Sokoll, L. J.; Chan, D. W., Immunosensors - principles and applications to clinical chemistry. Clinica Chimica Acta 2001, 314, (1-2), 1-26. 37. Yalow, R. S.; Berson, S. A., Assay of Plasma Insulin in Human Subjects by
Immunological Methods. Nature 1959, 184, (4699), 1648-1649.
38. Bilitewski, U., Protein-sensing assay formats and devices. Analytica Chimica Acta 2006, 568, (1-2), 232-247.
39. Hage, D. S., Immunoassays. Analytical Chemistry 1999, 71, (12), 294R-304R. 40. Ngo, T. T., Developments in Immunoassay Technology. Methods 2000, 22, (1),
41. Kricka, L. J.; Wild, D., Lab-on-a-chip, Micro-, and Nanoscale Immunoassay Systems. In The Immunoassay Handbook, 3rd ed.; Wild, D., Ed. Elsevier: New York, NY, 2005; pp 294-309.
42. Barbee, K. D.; Hsiao, A. P.; Roller, E. E.; Huang, X., Multiplexed protein detection using antibody-conjugated microbead arrays in a microfabricated electrophoretic device. Lab on a Chip 2010, 10, (22), 3084-3093.
43. Derveaux, S.; Stubbe, B. G.; Roelant, C.; Leblans, M.; De Geest, B. G.; Demeester, J.; De Smedt, S. C., Layer-by-Layer Coated Digitally Encoded Microcarriers for Quantification of Proteins in Serum and Plasma. Analytical Chemistry 2008, 80, (1), 85-94.
44. Diercks, A. H.; Ozinsky, A.; Hansen, C. L.; Spotts, J. M.; Rodriguez, D. J.; Aderem, A., A microfluidic device for multiplexed protein detection in nano-liter volumes. Analytical Biochemistry 2009, 386, (1), 30-35.
45. Rissin, D. M.; Walt, D. R., Duplexed sandwich immunoassays on a fiber-optic microarray. Analytica Chimica Acta 2006, 564, (1), 34-39.
46. Urbanowska, T.; Mangialaio, S.; Zickler, C.; Cheevapruk, S.; Hasler, P.;
Regenass, S.; Legay, F., Protein microarray platform for the multiplex analysis of biomarkers in human sera. Journal of Immunological Methods 2006, 316, (1-2), 1-7.
47. Bange, A.; Halsall, H. B.; Heineman, W. R., Microfluidic immunosensor systems. Biosensors & Bioelectronics 2005, 20, (12), 2488-2503.
48. Henares, T. G.; Mizutani, F.; Hisamoto, H., Current development in microfluidic immunosensing chip. Analytica Chimica Acta 2008, 611, (1), 17-30.
49. Lillehoj, P. B.; Wei, F.; Ho, C. M., A self-pumping lab-on-a-chip for rapid detection of botulinum toxin. Lab on a Chip 2010, 10, (17), 2265-2270. 50. Heo, J.; Hua, S. Z., An Overview of Recent Strategies in Pathogen Sensing.
Sensors 2009, 9, (6), 4483-4502.
51. Mairhofer, J.; Roppert, K.; Ertl, P., Microfluidic Systems for Pathogen Sensing: A Review. Sensors 2009, 9, (6), 4804-4823.
52. McPherson, R. A.; Pincus, M. R., ed., Henry's Clinical Diagnosis and
Management by Laboratory Methods. 21 ed.; Saunders Elsevier: Philadelphia, 2007.
54. Tang, Y. W.; Procop, G. W.; Persing, D. H., Molecular diagnostics of infectious diseases. Clinical chemistry 1997, 43, (11), 2021-2038.
55. Jackowski, M.; Szeliga, J.; Kodziska, E.; Buszewski, B., Application of capillary zone electrophoresis (CZE) to the determination of pathogenic bacteria for medical diagnosis. Analytical and Bioanalytical Chemistry 2008, 391, (6), 2153-2160.
56. Doring, G.; Unertl, K.; Heininger, A., Validation criteria for nucleic acid amplification techniques for bacterial infections. Clinical Chemistry and Laboratory Medicine 2008, 46, (7), 909-918.
57. Rogers, G. B.; Daniels, T. W. V.; Tuck, A.; Carroll, M. P.; Connett, G. J.; David, G. J. P.; Bruce, K. D., Studying Bacteria in Respiratory Specimens by Using Conventional and Molecular Microbiological Approaches. BMC Pulmonary Medicine 2009, 9, (14).
58. Sauer-Budge, A. F.; Mirer, P.; Chatterjee, A.; Klapperich, C. M.; Chargin, D.; Sharon, A., Low cost and manufacturable complete microTAS for detecting bacteria. Lab on a Chip 2009, 9, (19), 2803-2810.
59. Mothershed, E. A.; Whitney, A. M., Nucleic acid-based methods for the detection of bacterial pathogens: Present and future considerations for the clinical
laboratory. Clinica Chimica Acta 2006, 363, (1-2), 206-220.
60. Saiki, R. K.; Scharf, S.; Faloona, F.; Mullis, K. B.; Horn, G. T.; Erlich, H. A.; Arnheim, N., Enzymatic Amplification of -Globin Genomic Sequences and Restriction Site Analysis for Diagnosis of Sickle Cell Anemia. Science 1985, 230, (4732), 1350-1354.
61. Bartlett, J. M. S.; Stirling, D., A Short History of the Polymerase Chain Reaction. In PCR Protocols, 2nd ed.; Bartlett, J. M. S.; Stirlins, D., Eds. Humana Press: Totowa, NJ, 2003; pp 3-6.
62. Lien, K.-Y.; Liu, C.-J.; Kuo, P.-L.; Lee, G.-B., Microfluidic System for Detection of -Thalassemia-1 Deletion Using Saliva Samples. Analytical Chemistry 2009, 81, (11), 4502-4509.
63. Wilson, I. G., Inhibition and Facilitation of Nucleic Acid Amplification. Applied and Environmental Microbiology 1997, 63, (10), 3741-3751.
64. Lee, C.-Y.; Lee, G.-B.; Lin, J.-L.; Huang, F.-C.; Liao, C.-S., Integrated microfluidic systems for cell lysis, mixing/pumping and DNA amplification. Journal of Micromechanics and Microengineering 2005, 15, (6), 1215-1223. 65. Yeung, S.-W.; Lee, T. M.-H.; Cai, H.; Hsing, I.-M., A DNA biochip for
66. Zhang, C. S.; Xing, D., Miniaturized PCR chips for nucleic acid amplification and analysis: latest advances and future trends. Nucleic Acids Research 2007, 35, (13), 4223-4237.
67. Zhang, C. S.; Xu, J. L.; Ma, W. L.; Zheng, W. L., PCR microfluidic devices for DNA amplification. Biotechnology Advances 2006, 24, (3), 243-284.
68. Kolari, K.; Satokari, R.; Kataja, K.; Stenman, J.; Hokkanen, A., Real-time analysis of PCR inhibition on microfluidic materials. Sensors and Actuators B-Chemical 2008, 128, (2), 442-449.
69. Chen, L.; Manz, A.; Day, P. J. R., Total nucleic acid analysis integrated on microfluidic devices. Lab on a Chip 2007, 7, (11), 1413-1423.
70. Kim, J.; Johnson, M.; Hill, P.; Gale, B. K., Microfluidic sample preparation: cell lysis and nucleic acid purification. Integrative Biology 2009, 1, (10), 574-586. 71. Liu, P.; Mathies, R. A., Integrated microfluidic systems for high-performance
genetic analysis. Trends in Biotechnology 2009, 27, (10), 572-581. 72. Mariella, R., Sample preparation: the weak link in microfluidics-based
biodetection. Biomedical Microdevices 2008, 10, (6), 777-784.
73. Price, C. W.; Leslie, D. C.; Landers, J. P., Nucleic acid extraction techniques and application to the microchip. Lab on a Chip 2009, 9, (17), 2484-2494.
74. McDonald, J. C.; Duffy, D. C.; Anderson, J. R.; Chiu, D. T.; Wu, H. K.; Schueller, O. J. A.; Whitesides, G. M., Fabrication of microfluidic systems in poly(dimethylsiloxane). Electrophoresis 2000, 21, (1), 27-40.
75. Sia, S. K.; Whitesides, G. M., Microfluidic devices fabricated in
CHAPTER 2
MICROFLUIDIC BEAD-BASED IMMUNOASSAY CHIP 2.1 Introduction
Microfluidic immunoassays for POC diagnostics have been developed with many different strategies. Chips have been fabricated using silicon, glass, and polymers as the base material, although some materials are better suited for POC immunoassays than others.1, 2 Silicon does not make a very good substrate since proteins tend to bind to the surface and it is not optically transparent in the UV/visible region of the spectrum often used for optical detection of immunoassay results.1 Glass is optically transparent and has better surface chemistry for immunoassays than silicon, but polymers, such as PDMS, are also optically transparent and are especially well-suited for mass production.3 Polymer chips also tend to have reduced manufacturing costs compared with silicon or glass devices with the more expensive fabrication processes only used for the development of the mold. The mold can then be used to make many highly reproducible castings for chips.1-3
the antibody to the surface.1, 2, 5 With any immobilization method used, the antibodies need to be oriented properly on the surface to capture antigen from the sample.1, 2, 5
The type of signal generated for the detection of antigen varies as well.
Fluorescence, surface plasmon resonance, and electrochemical detection methods are the most common.1, 2, 4 Fluorescence detection is easy to integrate into an immunoassay and it has high sensitivity which makes it the most common form of detection.1, 2, 5 ELISAs can be performed with a substrate and enzyme that generate a fluorescent product for even greater sensitivity than standard fluorescence detection.6 One device described was made from a glass slide, used a streptavidin-biotin linkage to immobilize antibodies on a surface, and then used fluorescently labeled reporter probes to detect cancer markers from saliva samples.7 Another device was made from polymers and incorporated a lateral flow strip with immobilized synthetic HIV envelope peptides to capture antibodies to HIV from saliva samples that were then detected with fluorescently labeled reporters.8 These are just two examples of the many applications and sample types that microfluidic immunoassays can be designed for.
Since antibody-antigen interactions are very specific, most immunoassays can detect only one analyte. If multiplexed detection from the same sample is desired, antibodies for multiple antigens can be immobilized to a surface in a microarray. Microarrays allow many analytes to be evaluated simultaneously, saving time and
high-precision, and the antibody-spotting technology makes customizing the selection of antibodies used in each chip difficult.11, 15-17
An alternative to immobilizing capture antibodies directly onto a surface is to couple antibodies to microspheres. Microsphere-based immunoassays have a number of advantages over planar assays including better reproducibility in the attachment of capture antibodies to the surface, more flexibility in surface chemistry, and shorter analysis times.11, 18, 19 Microspheres also have a high surface-to-volume ratio leading to a greater number of capture antibodies available and therefore higher sensitivity compared to planar immunoassays.15, 16, 20 Microspheres can also be used to form microarrays for multiplexing, and having a prepared library of microspheres with capture antibodies for different analytes means an array can be easily customized for a particular set of targets. Microarrays of antibody-coupled microspheres can be formed by loading microspheres into known locations, or by randomly loading a mixture of microsphere types and decoding the type of microsphere in each location afterwards.16, 18-22 Decoding of random arrays can be done by doping the microspheres with varying levels of one or more fluorescent dyes or even by photobleaching a barcode onto each microsphere if they are large enough.11, 16, 23
The Walt group at Tufts University has developed microsphere-based immunoassays that use fiber optic bundles to form microarrays.16, 24, 25 Sets of
intensity after they are loaded into an array.24-27 Multiple encoding dyes can be used if the multiplexed assay calls for more bead types than can be distinguished using a single dye.23, 28 The end of the fiber optic bundle containing the array is exposed to reagent solutions over the course of a sandwich assay and the fiber is finally imaged, both for decoding and signal detection, using a custom-built epi-fluorescence microscope with a charge-coupled device (CCD) camera.23 The Walt group used conventional ELISA methods to identify ten salivary cytokines and chemokines that are potential biomarkers for pulmonary diseases, such as asthma and cystic fibrosis, and developed antibody-functionalized microspheres that were used in fiber optic microarrays to simultaneously measure all ten analytes in saliva supernatant samples from patients with pulmonary diseases.23, 29
In this chapter the adaptation of the Walt group’s microsphere-based immunoassay onto a microfluidic chip is described. The PDMS/glass hybrid chip contains an 896-well microarray fabricated into a single PDMS layer that also includes all the fluidic channels needed to deliver reagents for the sandwich assay to the array. The optimization of the assay is described and limits of detection in buffer and saliva supernatant were determined for two cytokines.
2.2 Materials and Methods Materials and Reagents
polyvinylpyrrolidone (PVP) with an average molecular weight of 10,000 g/mol, 10x phosphate buffered saline solution (PBS), tris buffered saline with 0.05% Tween 20 (TBS/Tween 20), and DNase/RNase free polyurethane amplification tape (PCR tape) were purchased from Sigma-Aldrich (St. Louis, MO). Fisherbrand plain glass
microscope slides (75 mm x 25 mm, 990 μm thick) and isopropyl alcohol were purchased from Thermo Fisher Scientific (Waltham, MA). SEA Block blocking buffer, SuperBlock blocking buffer, Protein Free blocking buffer, Blocker BSA (10% BSA) in PBS, PBS Starting Block blocking buffer, and TBS Starting Block blocking buffer were purchased from Pierce Biotechnology, Inc. (Rockford, IL). PEG with an average molecular weight of 10,000 g/mol (PEG 10k) was purchased from Alfa Aesar (Ward Hill, MA). Buffered oxide etchant (BOE), 10:1, was purchased from Transene (Danvers, MA).
2-[methoxy(polyethyleneoxy)propyl]trimethoxysilane, 90% (PEG-silane) was purchased from Gelest (Morrisville, PA). Streptavidin-Alexa Fluor 488 (AF488) conjugate was
purchased from Invitrogen (Carlsbad, CA). Purified recombinant human vascular endothelial growth factor (VEGF), interleukin-8 (IL-8), and biotin-labeled polyclonal detection antibodies for each cytokine were purchased from R&D Systems, Inc. (Minneapolis, MN). Cytokines and antibodies were reconstituted according to the manufacturer’s instructions. Buffer solutions of 1x PBS containing 0.1% PEG 10k (PBS/PEG10k) were prepared from a 10x stock solution diluted with deionized (DI) water filtered with a NANOpure Diamond water purification system (Barnstead International, Dubuque, IA).
diameter amine-functionalized microspheres are encoded with Europium (III)
thenoyltrifluoroacetonate trihydrate at concentrations of either 1.0, 0.5, 0.125, or 0.025 M. These four concentrations can be differentiated based on fluorescence emission intensity upon UV excitation. After encoding, four different cytokine capture antibodies are attached to the different sets of microspheres after which they are stored in TBS Starting Block blocking buffer with 0.05% sodium azide at 4 °C, protected from light. Chip Fabrication
The chips were fabricated by first making a master mold of the chip design in glass followed by making a complementary mold of the master in PDMS. The final PDMS chips were prepared from the complementary PDMS mold. This has recently been described in detail.30 Glass master molds were fabricated using a combination of wet chemical etching and focused ion beam (FIB) milling. Channels were patterned onto a glass substrate using standard photolithography techniques and etched to a depth of 30 m using 10:1 BOE. A 50 nm thick layer of chromium was sputtered onto the glass substrate using an Ion Deposition/Sputter System (South Bay Technology, Inc., San Clemente, CA). Microarrays were milled using a Helios 600 Nanolab Dual Focused Ion Beam System (FEI, Hillsboro, Oregon). Galium ions at an energy of 30 keV and current of 21 nA were used to mill individual microwells to a depth of 2.95 m and diameter of 2.75 m with a well center-to-center spacing of 8 m. Array patterns from 100 wells (10x10) up to 896 wells (28x32) were milled. Assay optimization and limit of detection determination were performed on chips with 896 well arrays.
perfluorooctyl silane. Vacuum was applied for approximately 5 min to allow silane vapor to fill the desiccator and then it was sealed for 20-30 min. This treatment reduced PDMS adhesion to the master. A secondary mold of the master was cast in PDMS by placing the master channel-side up in a larger mold form and covering it with PDMS to a 5-10 mm depth. The PDMS-filled mold form was placed in a vacuum desiccator with vacuum applied for 15-20 min to degas the PDMS. The mold was then cured for 30 min at 60 °C followed by 15 min at 95 °C. After cooling, the PDMS mold was removed from the mold form and separated from the master, and the edges were trimmed with a razor blade.
The PDMS secondary mold was silanized in the same manner as the glass master, but with a shorter 5 s plasma treatment step. The PDMS layer of the microfluidic chip was made by pouring ~4 mL of PDMS into the mold, degassing under vacuum, placing a glass slide over the top of the mold to push out excess PDMS and to give the chip a reproducible thickness, and then curing at 95 °C for 15 min. The PDMS chip layer was then separated from the mold and trimmed with a razor blade. The silanization prevented the PDMS chip layer from adhering to the PDMS mold.
side of the PDMS layer onto the glass slide. Bonded chips were allowed to stabilize at room temperature for at least 1 day before use.
An image of a chip, an SEM image of an FIB milled array, and a schematic of the cross section of a chip are shown in figure 2.1. The chip has 4 reagent reservoirs to introduce sample, secondary antibody, AF488, and wash buffer. Vacuum is applied to a fifth waste reservoir to effect fluid flow. The reagent reservoirs individually connect to the main channel that includes the microwell array followed by a serpentine path to the waste reservoir. The serpentine path has a large enough volume such that delivered reagents used during an assay will remain on-chip. This will prevent the chip reader (control instrument) from becoming contaminated with sample or other reagents. The reader instrument will use pinch valves to automate fluid handling on-chip. When actuated, the valves press on the PDMS above a channel, pinching it closed. Valving locations are shown in figure 2.1A. The assay development and limit of detection determination described in this chapter were performed without valves.
Chip Preparation
finger on the PDMS over the array and pressing down against the glass. The extent of array loading was monitored with a fluorescence microscope and pressure was applied repeatedly until the array was sufficiently loaded (usually to a 90% efficiency or better). Unloaded microspheres were washed away with buffer. The channels were then filled with fresh buffer (PBS/PEG10k unless otherwise noted), the reservoirs were sealed with PCR tape to prevent evaporation, and the chips were stored in the dark at 4°C for at least
1 hour before using for an assay. Assay Procedure
The assay procedure was adapted from the fiber optic immunoassays developed at Tufts University.23 Protein assays were performed with the following procedure unless otherwise noted. Reagent solutions were introduced onto the chip through all four reagent reservoirs because these assays were performed without valves. Each solution was added to the reservoirs just before it was delivered, and excess reagent was removed from the reservoirs (with vacuum) just before the next reagent was added. Sample solution (20 μL) containing cytokines diluted in PBS/PEG10k buffer was added to the
A schematic of the sandwich assay is shown in figure 2.2. During the sample
incubation, the cytokines are captured by the antibodies attached to the beads. The
biotinylated secondary antibodies then attach to the antigen-antibody complex on the
beads during the secondary antibody incubation. During the AF488 incubation, the
streptavidin in the AF488 forms a linkage with the biotin on the secondary antibodies and
labels the antigen-antibody sandwich with a fluorescent tag. The final wash removes the
excess AF488 and the AF488 bound to the antigen-antibody complex can be detected
with fluorescence microscopy.
For experiments using saliva supernatant as samples, whole saliva was collected
from healthy volunteers by having them drool into a clean centrifuge tube. The samples
were centrifuged at 4000 rpm for 30 min. Aliquots of saliva supernatant were spiked
with cytokine standards for limit of detection determinations.
Image Collection and Analysis
Arrays were imaged with a Nikon Eclipse Ti-U inverted microscope with a Nikon
Intensilight C-HGFIE mercury light source (Melville, NY) and collected with a Cascade
II 512 electron multiplying CCD (EMCCD) camera (Photometrics, Tucson, AZ). A
custom optical filter cube (Chroma Technology Corp., Rockingham, VT) was used for
fluorescence imaging of the europium encoding dye (ex=365 nm, em=605 nm) and a
Nikon filter cube B-2E/C was used for collection of the AF488 signal (ex=488 nm,
em=520 nm). Two images were acquired for each array: an encoding image (ex=365 nm, 100 ms exposure), and an assay image (ex=488 nm, 8 s exposure). Encoding and
(National Institutes of Health, USA), IgorPro (WaveMetrics, Inc., Lake Oswego, OR),
and OriginPro (OriginLab Corp., Northampton, MA).
ImageJ was used to decode images and determine signal intensities. For both
encoding and assay images, microsphere intensities are spread over ~4 pixels but only the
intensity of the brightest pixel is used. Encoding images were used to identify
microsphere types so that individual cytokine signal intensities could be determined from
the assay images. For each array, signal intensities from microspheres of the same type
were averaged to obtain the raw signal. Values not within 2.5 standard deviations from
the mean were discarded and the remaining values were averaged to obtain the corrected
signal. This is a technique commonly used with clinical chemistry data to eliminate false
positives and negatives and other outliers, although outliers can easily inflate the standard
deviation to the point that they are not discarded.33 A microsphere type for which no analyte was present was used as a control to determine non-specific binding. The net
signal for a given cytokine was calculated by subtracting the corrected control bead
signal from the corrected target analyte bead signal. Noise values were calculated in
IgorPro by finding the standard deviation of the pixel intensities in an area of the
background outside the array. The net signal is divided by the noise to calculate the
signal to noise ratio (S/N). A set of encoding and assay images from a VEGF assay is
shown in figure 2.3, with selected VEGF and control (IL-8) beads circled in both images.
Limit of detection data were fit to a 4-parameter logistics equation using OriginPro.
2.3 Results and Discussion
Surface Passivation
The surface of PDMS is hydrophobic, making it prone to nonspecific adsorption
of biomolecules such as proteins.3, 34-38 Surface passivation of both the PDMS and glass surfaces is essential to ensure compatibility with the biological sample matrix and assay
reagents. Many strategies to prevent protein adsorption and increase biocompatibility of
these surfaces have been described.36-41 Both static and dynamic surface coatings were investigated to reduce non-specific adsorption to the channel walls during assays, but
dynamic coatings were favored due to their simplicity and faster chip preparation times.
Dynamic coatings are buffer additives that are thought to reduce non-specific adsorption
by preferentially adsorbing to the surface instead of the protein.42
Eight different dynamic coatings and a static silane coating were evaluated: four
commercial blocking buffers (10% Blocker BSA, SuperBlock, Protein Free, and SEA
Block), PBS with 0.1% BSA, PBS with 0.1% PVP, PBS with 0.1% PEG 200,
PBS/PEG10k, and a PEG-silane coating. One chip was used to test each coating. For
these experiments, the buffer used for chip preparation and during the assay was the
buffer containing the dynamic coating listed above instead of the PBS/PEG10k described
in section 2.2. The PEG-silane coated chip was prepared following the procedure
described by Sui, et. al.38 Briefly, after the chip was bonded, a 5:1:1 mixture of H2O/H2O2/HCl was continuously washed through the channels for 5 min, the channels
were rinsed with DI water and dried with air, the channels were filled with neat
PEG-silane and incubated for 30 min at room temperature, and then the channels were rinsed
the PEG-silane coated chip. After bead loading, all channels were filled with the
appropriate buffer and incubated for at least 1 h at 4 °C. Reagent solutions were prepared with each of the buffers using VEGF as a model analyte. 500 pg/mL VEGF, 3 μg/mL
anti-VEGF, and 20 μg/mL AF488 were used. The assay was performed at room
temperature with a 1 h sample incubation, 30 min secondary antibody incubation, 10 min AF488 incubation, 10 min wash with assay buffer, and a 10 min wash with TBS/Tween 20.
The results of these assays are shown in figure 2.4. PBS/PEG10k buffer was found to be the best of all the coatings tested, and therefore was used for all future
experiments. The S/N was 2.1 times higher than that for the SEA block dynamic coating, which had the second highest S/N, and 5.9 times higher than that for the static PEG-silane coating. The PBS with PEG 200 and PEG 10k buffers were found to result in the lowest noise values and were among the assays with the lowest control signals. The chips using other blocking buffers had higher control bead signal intensities and higher noise values. This combination led to lower S/N ratios compared to that from the PBS/PEG10k blocking buffer.
Incubation Temperature
stirring into the assay design, to decrease the size of the microspots, and to change the reaction conditions in order to increase the diffusion coefficients of the sample and reagents.45 Since the size of the microspots for our assay is the size of the microspheres, decreasing their size is not an optimal solution. Many mixer designs have been
developed for microfluidic chips, but incorporating a mixer would add complexity to the device in both design and operation.46, 47 Changing the reaction conditions to affect the diffusion coefficient is much more easily done. The diffusion coefficient is directly proportional to temperature.48 Performing the incubations at an elevated temperature should increase the diffusion coefficients and may produce increased signals if the immunoassay is diffusion limited.
Two different incubation temperatures were evaluated: room temperature (~25 °C) and 37 °C. 37 °C was evaluated because it is the normal human body temperature. Four chips were used to test each incubation temperature. For incubations at 37 °C, the
chips were placed in a 37 °C oven. Wash steps were performed at room temperature for
all of the chips. Reagent solutions were prepared in PBS/PEG10k buffer using VEGF as a model analyte. 500 pg/mL VEGF, 3 μg/mL anti-VEGF, and 20 μg/mL AF488 were
used for this assay. The assay was performed with a 1 h sample incubation, 30 min secondary antibody incubation, 10 min AF488 incubation, 10 min wash with PBS/PEG10k buffer, and a 10 min wash with TBS/Tween 20. The average S/N for VEGF assays with incubations at 37 °C was ~33% higher than that for assays with
Assay Step Elimination
Assay time is an important consideration for a POC device. If results are acquired while the patient is still at the doctor’s office and treatment decisions based on those results can be made without the need for a follow-up visit, patient outcomes will improve for population groups that often do not return for their test results.49-51 In order to
decrease the total assay time and the complexity of the chip design, eliminating the first buffer wash with PBS/PEG10k was tested. VEGF was again used as the model analyte with all reagent concentrations and assay steps the same as above.
Eliminating the first buffer wash resulted in an ~98% increase in S/N over the original procedure. The increase may be due to less time for the antibody-antigen interactions to dissociate. The reactions between antibodies and antigens are in
equilibrium, so if a complex dissociates during a wash step, it will not remain nearby and be recaptured by the antibody. Due to the increase in S/N from the elimination of the first wash step, it was eliminated from all future assays.
Incubation Time
Secondary antibody, sample, and AF488 incubation times were optimized individually with VEGF as the model analyte. Ideally, assay conditions would be
optimized for each individual analyte. However, for the multiplexed bead array format, it is necessary to have a single incubation time for all analytes. It would not be possible to use a 30 min sample incubation for one analyte and a 60 min sample incubation for another analyte if the analytes are simultaneously measured with the same microarray. In this instance, VEGF was chosen as the cytokine for optimizing these parameters.
AF488, and an incubation temperature of 37 °C were used for all incubation time optimization experiments. One chip was used to test each incubation time.
For secondary antibody incubation time optimization, the secondary antibody incubation time was varied from 1 to 60 min. A 1 h sample incubation, 10 min AF488 incubation, and 10 min wash with TBS/Tween 20 were used. The results are shown in figure 2.5A. As expected, an increase in S/N was observed with increasing incubation times, but without much improvement beyond 20 min. In addition to improving the overall results, the goal for the incubation time optimizations was to limit the total assay time to less than 1 h. In the interest of balancing sensitivity with total assay time, a 15 min secondary antibody incubation was used for all future assays. Although an assay was not performed with a 15 min incubation time, this was expected to deliver results nearly as high as the 20 min incubation time while allowing more time for the sample and AF488 incubations.