Prediction of Body Mass Index Using
Concurrently Self-Reported or Previously
Measured Height and Weight
Zhaohui Cui1*, June Stevens1,2, Kimberly P. Truesdale1, Donglin Zeng3, Simone French4, Penny Gordon-Larsen1
1 Department of Nutrition, Gillings School of Global Public Health, University of North Carolina at Chapel Hill,
Chapel Hill, North Carolina, United States of America, 2 Department of Epidemiology, Gillings School of Global Public Health, University of North Carolina at Chapel Hill, Chapel Hill, North Carolina, United States of America, 3 Department of Biostatistics, Gillings School of Global Public Health, University of North Carolina at Chapel Hill, Chapel Hill, North Carolina, United States of America, 4 Division of Epidemiology and Community Health, School of Public Health, University of Minnesota, Minneapolis, Minnesota, United States of America
Abstract
Objective
To compare alternative models for the imputation of BMIM(measured weight in kilograms/
measured height in meters squared) in a longitudinal study.
Methods
We used data from 11,008 adults examined at wave III (2001–2002) and wave IV (2007– 2008) in the National Longitudinal Study of Adolescent to Adult Health. Participants were asked their height and weight before being measured. Equations to predict wave IV BMIM
were developed in an 80% random subsample and evaluated in the remaining participants. The validity of models that included BMI constructed from previously measured height and weight (BMIPM) was compared to the validity of models that used BMI calculated from
con-currently self-reported height and weight (BMISR). The usefulness of including
demograph-ics and perceived weight category in those models was also examined.
Results
The model that used BMISR, compared to BMIPM, as the only variable produced a larger R2
(0.913 vs. 0.693), a smaller root mean square error (2.07 vs. 3.90 kg/m2) and a lower bias between normal-weight participants and those with obesity (0.98 vs. 4.24 kg/m2). The per-formance of the model containing BMISRalone was not substantially improved by the
addi-tion of demographics, perceived weight category or BMIPM.
Conclusions
Our work is the first to show that concurrent self-reports of height and weight may be more useful than previously measured height and weight for imputation of missing BMIMwhen the
a11111
OPEN ACCESS
Citation: Cui Z, Stevens J, Truesdale KP, Zeng D,
French S, Gordon-Larsen P (2016) Prediction of Body Mass Index Using Concurrently Self-Reported or Previously Measured Height and Weight. PLoS ONE 11(11): e0167288. doi:10.1371/ journal.pone.0167288
Editor: Rebecca A Krukowski, University of
Tennessee Health Science Center, UNITED STATES
Received: September 11, 2016
Accepted: November 11, 2016
Published: November 29, 2016
Copyright:©2016 Cui et al. This is an open access article distributed under the terms of theCreative Commons Attribution License, which permits unrestricted use, distribution, and reproduction in any medium, provided the original author and source are credited.
Data Availability Statement: The data were from
a third party. The authors are not allowed to release the data according to the Data Use Agreement. To obtain the data, please contact [email protected].
Funding: This work was supported by Award
time interval between measures is relatively long. Other time frames and alternatives to in-person collection of self-reported data need to be examined.
Introduction
Longitudinal studies of body weight in humans almost always have missing values due to loss to follow-up or incomplete examinations. These missing values can bias estimates and reduce statistical power. A recent review of pharmaceutical randomized trials with weight as the pri-mary outcome indicated that in most studies missing data for body mass index (BMI) was imputed by carrying forward BMI calculated from previously measured height and weight
(referred as BMIPM) or by predicting the missing values using a model that included BMIPM
[1]. However, BMI can change importantly over time, and in some cases those changes are the
primary interest of the study. It is well established that BMI calculated from self-reported
height and weight (BMISR) is highly correlated with concurrently assessed BMI calculated
from measured height and weight (BMIM) with r values of approximately 0.90 [2].
Neverthe-less, BMISRtends to underestimate BMIM, and this bias is exaggerated in individuals who are
female, white, older and heavier [3–6]. Thus both BMIPMand BMISRhave potential to the
imputation of BMIM, but both have limitations.
The use of modeling to predict missing data is currently recommended for data missing at
random [7]. The use of BMISRin regression models that impute BMIMhas been explored in
cross-sectional data [3,8–11]. However, to our knowledge, modeling of missing BMIMvalues
using BMISRhas not been extended to longitudinal data. We know of no study that has
com-pared equations that include BMIPMto equations that include BMISRfor the prediction of
BMIM. We hypothesized that in longitudinal studies in which the most recently measured
weight is several years in the past, a regression model to predict BMIMthat includes both
BMIPMand BMISRwould perform better (i.e. with greater accuracy) than a model that used
only BMIPM. In addition, we anticipated that BMIPMwould produce stronger predictions than
BMISR. Since studies have shown that demographics and perception of weight status are
asso-ciated with BMIMand misreport of BMIM[4,12], we also tested including demographic and
perceived weight status variables in the regression models for prediction of BMIM.
Materials and Methods
Study population
The National Longitudinal Study of Adolescent to Adult Health (Add Health) [13] was
selected to provide data for this analysis because both measured and self-reported height and weight were assessed in the same participants on two occasions. The Add Health study was designed to examine the relationship between social, behavioral and biological factors and
health from adolescence to adulthood [13]. Samples of youth were drawn from 80 high schools
and 52 middle schools selected to ensure representation of US schools in regard to region of country, urbanicity, school size, school type, and school ethnicity. The core sample is nation-ally representative of American students in grades 7–12 in the 1994–95 school year. Additional special samples provide enlarged subsamples for studies of ethnicity, disability and sibling and twin relations. We combined the data from the core sample and special samples at each wave in the present study. We chose to construct the sample in this way to include a more diverse participants. The first examination (called Wave I) included 20,745 students aged 11–21 years. Follow-up examinations were conducted in 1996–1997 (wave II), 2001–2002 (wave III) and
content is solely the responsibility of the authors and does not necessarily represent the official views of the National Heart, Lung, and Blood Institute or the National Institutes of Health.
Competing Interests: The authors have declared
2007–2008 (wave IV), respectively. We focused the current work on adults and therefore used data from waves III (n = 15,197, age = 18–26 years) and IV (n = 15,701, age = 24–32 years).
Survey procedures have been described elsewhere [14] and were approved by the institutional
review board at the University of North Carolina at Chapel Hill. Written informed consent was obtained from all participants.
Measures
At each wave, participants were asked their height and weight in a home-based interview and were measured after the interview by a trained technician. Height was measured to the nearest 0.5 cm without shoes using a measure tape with a standard triangular headboard attached to a wall. Weight was measured to the nearest 0.1 kg without shoes and in clothing using a Health-o-meter 844KL High Capacity Digital Bathroom Scale (Jarden Corporation; Rye, NY). BMI is
calculated as weight in kg divided by the square of height in meters. BMIPMwas constructed
from measured height and weight from wave III, while BMIMand BMISRwere calculated from
data collected at wave IV. In wave IV perceived weight status was obtained by asking the par-ticipant “how do you think of yourself in terms of weight?”: 1) very underweight; 2) slightly underweight; 3) about the right weight; 4) slightly overweight; 5) very overweight. Because only a few participants answered very underweight (0.7%), this category was combined with slightly underweight.
Participants reported their date of birth and age was calculated. Time intervals were calcu-lated between examination dates. Race/ethnicity was self-reported by parents and adolescents at wave I and was classified as non-Hispanic white, non-Hispanic black, Hispanic, Asian
American or Native American [15].
Analytic sample
Among the 15,701 participants at wave IV, we excluded those who reported pregnancy at wave III or IV (n = 967); had a part of their body amputated (n = 16); were missing race/ethnicity (n = 32), perceived weight status at wave IV (n = 7), or height or weight at either wave
(n = 3,631); reported a weight less than 30 pounds (n = 11); or had either a BMIM, BMISRor
BMIPMthat was<12 kg/m2or>60 kg/m2(n = 29). Our final analytic sample included 11,008
participants with weight and height data from both waves.
Statistical analysis
We constructed a training data sets by random selection of 80% of observations without replacement. The remaining participants formed the test dataset. We developed equations to
predict BMIMusing general linear models and different combinations of variables. The
equa-tions developed in the training dataset were applied to the participants in the test dataset to
create a predicted BMIM. These predicted values were regressed against BMIMin the test
dataset and R2and root mean square error (RMSE) were calculated. To evaluate whether the
accuracy of the predicted values differed by BMI category [16] we calculated mean signed
dif-ference (MSD) as the mean of the difdif-ference between predicted values and BMIM. To examine
whether the results from the above analyses were by chance, we repeated the above analyses in four different sets of training and test datasets generated by randomly allocating the 11,008
participants and found all results were similar [11]. All analyses were conducted with SAS 9.4
Results
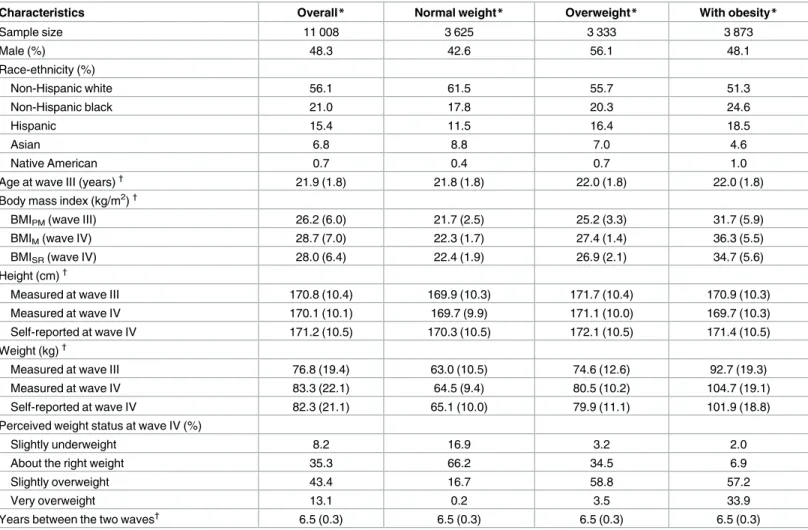
In the analytic sample a little over half of the participants were non-Hispanic whites (Table 1).
Mean BMI increased from wave III to wave IV in groups with normal weight, overweight and obesity. On average, participants over-reported their measured height. Normal weight partici-pants over-reported, while participartici-pants with overweight or obesity under-reported, their
mea-sured weight. This resulted in a relatively accurate estimation of BMIMin the normal weight
group but underestimation of BMIMby 0.5 kg/m2in the group with overweight and 1.6 kg/m2
in the group with obesity.
Using BMIMas the dependent variable, nine models with different combinations of
inde-pendent variables were developed in the training data set. The resulting 9 equations (intercepts
and coefficients) were applied to the test dataset to generate predicted estimates of BMIM.
These estimates were then compared to BMIMin the test data using univariate regression.
Table 1. Characteristics of the analytic sample.
Characteristics Overall* Normal weight* Overweight* With obesity*
Sample size 11 008 3 625 3 333 3 873
Male (%) 48.3 42.6 56.1 48.1
Race-ethnicity (%)
Non-Hispanic white 56.1 61.5 55.7 51.3
Non-Hispanic black 21.0 17.8 20.3 24.6
Hispanic 15.4 11.5 16.4 18.5
Asian 6.8 8.8 7.0 4.6
Native American 0.7 0.4 0.7 1.0
Age at wave III (years)† 21.9 (1.8) 21.8 (1.8) 22.0 (1.8) 22.0 (1.8)
Body mass index (kg/m2)†
BMIPM(wave III) 26.2 (6.0) 21.7 (2.5) 25.2 (3.3) 31.7 (5.9)
BMIM(wave IV) 28.7 (7.0) 22.3 (1.7) 27.4 (1.4) 36.3 (5.5)
BMISR(wave IV) 28.0 (6.4) 22.4 (1.9) 26.9 (2.1) 34.7 (5.6)
Height (cm)†
Measured at wave III 170.8 (10.4) 169.9 (10.3) 171.7 (10.4) 170.9 (10.3)
Measured at wave IV 170.1 (10.1) 169.7 (9.9) 171.1 (10.0) 169.7 (10.3)
Self-reported at wave IV 171.2 (10.5) 170.3 (10.5) 172.1 (10.5) 171.4 (10.5)
Weight (kg)†
Measured at wave III 76.8 (19.4) 63.0 (10.5) 74.6 (12.6) 92.7 (19.3)
Measured at wave IV 83.3 (22.1) 64.5 (9.4) 80.5 (10.2) 104.7 (19.1)
Self-reported at wave IV 82.3 (21.1) 65.1 (10.0) 79.9 (11.1) 101.9 (18.8)
Perceived weight status at wave IV (%)
Slightly underweight 8.2 16.9 3.2 2.0
About the right weight 35.3 66.2 34.5 6.9
Slightly overweight 43.4 16.7 58.8 57.2
Very overweight 13.1 0.2 3.5 33.9
Years between the two waves† 6.5 (0.3) 6.5 (0.3) 6.5 (0.3) 6.5 (0.3)
BMIPM, body mass index constructed from measured height and weight at wave III; BMIM, body mass index calculated from measured height and weight at
wave IV; BMISR, body mass index constructed from self-reported height and weight at wave IV.
*Obesity status was determined using BMIM. Overall included participants who are underweight (n = 177), normal weight (n = 3 625), overweight (n = 3
333) and those with obesity (n = 3 873).
†
Values were expressed as mean and standard deviation.
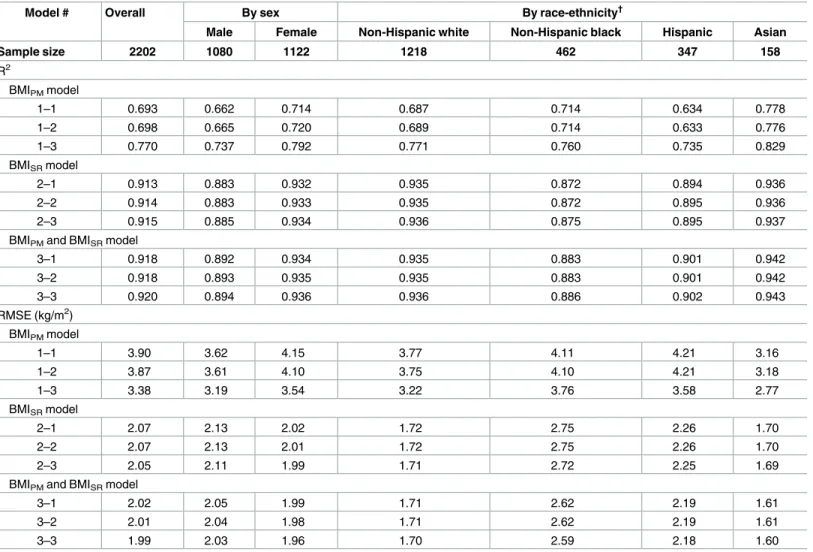
Table 2shows the R2and RMSE produced from this analysis. Model 1–1 with BMIPMas the
only independent variable produced an R2of 0.693 and an RMSE of 3.90 kg/m2. Model 2–1
with BMISRas the only independent variable produced a larger R2(0.913) and a smaller RMSE
(2.07 kg/m2) compared to the models 1–1. Performance was not substantially improved by
adding BMIPMto the model with BMISR. Addition of demographics and perceived weight
sta-tus also had little impact. Further, the addition of non-linear forms of BMI and age (i.e., inverse, square and cubic), and the interactions of gender or race/ethnicity with BMI did not
increase the adjusted R2by more than 0.01 or reduce bias between normal weight group and
Table 2. R2and RMSE from regression*of predicted BMI
Magainst actual BMIMin the test dataset.
Model # Overall By sex By race-ethnicity†
Male Female Non-Hispanic white Non-Hispanic black Hispanic Asian
Sample size 2202 1080 1122 1218 462 347 158
R2
BMIPMmodel
1–1 0.693 0.662 0.714 0.687 0.714 0.634 0.778
1–2 0.698 0.665 0.720 0.689 0.714 0.633 0.776
1–3 0.770 0.737 0.792 0.771 0.760 0.735 0.829
BMISRmodel
2–1 0.913 0.883 0.932 0.935 0.872 0.894 0.936
2–2 0.914 0.883 0.933 0.935 0.872 0.895 0.936
2–3 0.915 0.885 0.934 0.936 0.875 0.895 0.937
BMIPMand BMISRmodel
3–1 0.918 0.892 0.934 0.935 0.883 0.901 0.942
3–2 0.918 0.893 0.935 0.935 0.883 0.901 0.942
3–3 0.920 0.894 0.936 0.936 0.886 0.902 0.943
RMSE (kg/m2) BMIPMmodel
1–1 3.90 3.62 4.15 3.77 4.11 4.21 3.16
1–2 3.87 3.61 4.10 3.75 4.10 4.21 3.18
1–3 3.38 3.19 3.54 3.22 3.76 3.58 2.77
BMISRmodel
2–1 2.07 2.13 2.02 1.72 2.75 2.26 1.70
2–2 2.07 2.13 2.01 1.72 2.75 2.26 1.70
2–3 2.05 2.11 1.99 1.71 2.72 2.25 1.69
BMIPMand BMISRmodel
3–1 2.02 2.05 1.99 1.71 2.62 2.19 1.61
3–2 2.01 2.04 1.98 1.71 2.62 2.19 1.61
3–3 1.99 2.03 1.96 1.70 2.59 2.18 1.60
RMSE, Root mean square error; BMIPM, body mass index constructed from measured height and weight at wave III; BMIM, body mass index constructed
from measured height and weight at wave IV; BMISR, body mass index constructed from self-reported height and weight at wave IV.
*Independent variable(s) in each model developed in the training dataset to predict BMIM: Model 1–1: BMIPM; (adjusted R 2
: 0.673; RMSE: 3.98). Model 1–2: BMIPM+ age at wave III + time interval + sex + race; (adjusted R
2
: 0.676; RMSE: 3.96). Model 1–3: BMIPM+ age at wave III + time interval + sex + race
+ perceived weight status at wave IV; (adjusted R2: 0.754; RMSE: 3.45). Model 2–1: BMISR; (adjusted R 2
: 0.893; RMSE: 2.28). Model 2–2: BMISR+ age at
wave IV + sex + race; (adjusted R2: 0.893; RMSE: 2.28). Model 2–3: BMISR+ age at wave IV + sex + race + perceived weight status at wave IV; (adjusted
R2: 0895; RMSE: 2.26). Model 3–1: BMIPM+ BMISR; (adjusted R 2
: 0.898; RMSE: 2.23). Model 3–2: BMIPM+ BMISR+ age at wave IV + sex + race; (adjusted
R2: 0.898; RMSE: 2.22). Model 3–3: BMIPM+ BMISR+ age at wave IV + sex + race + perceived weight status at wave IV; (adjusted R 2
: 0.900; RMSE: 2.20).
†
Results for Native Americans were not shown because of small sample size (n = 17).
the group with obesity by as much 0.1 kg/m2. The intercepts and coefficients of the models
developed in the whole analytic sample are shown in theS1 Table.
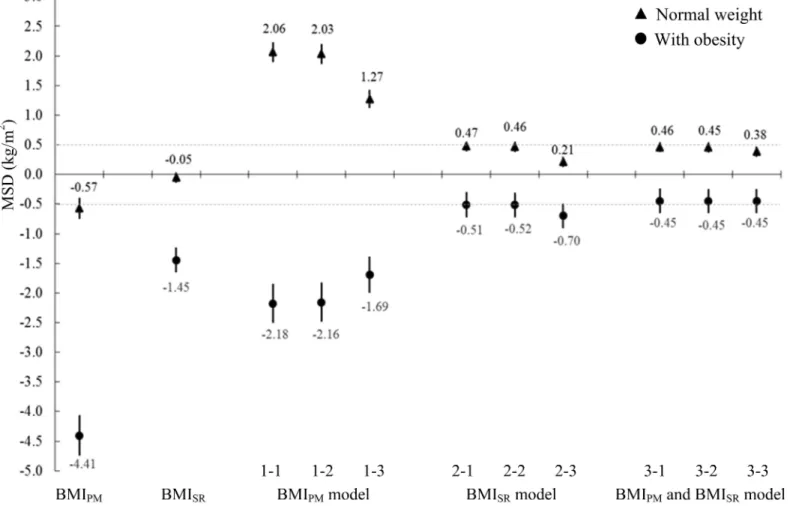
The MSD in overweight adults was -2.52 kg/m2for BMIPM, -0.54 kg/m2for BMISRand
close to zero for all nine models (0.03–0.17 kg/m2). Those values were intermediate between
those seen in the normal weight group and the group with obesity.Fig 1shows MSD’s
calcu-lated using the test dataset that contrast estimates of BMI obtained in normal weight
partici-pants and participartici-pants with obesity (categories assigned using BMIM). The MSD estimates in
normal weight participants and participants with obesity were over triple as far from the null
for BMIPMcompared to BMISR. Model predicted values overestimated BMIMin normal weight
participants and underestimated BMIMin participants with obesity with the magnitudes of
bias consistently smaller for models that included BMISR(i.e., models 2–1 to 3–3) compared to
models that used BMIPM(i.e., models 1–1, 1–2 and 1–3). As a result, the amount of differential
bias (discrepancy between the MSD in normal weight participants and the MSD in
partici-pants with obesity for a given model) was lower in models that included BMISR(i.e., models
2–1 to 3–3). In those models, the range of the discrepancies was relatively narrow ranging
from 0.83 to 0.98 kg/m2. Analyses conducted by gender and race-ethnicity subgroups also
Fig 1. MSD between predicted BMIMand actual BMIMby weight status in the test dataset (n = 2202). (A) Abbreviations: MSD for mean signed difference; BMI for body mass index, BMIPMis derived from measured height and weight at wave III, BMIMis derived from measured height and weight at
wave IV, BMISRis constructed from self-reported height and weight at wave IV. (B) MSD was calculated as the mean of predicted BMIMminus actual
BMIM. The dashed lines in the Fig are at±0.5 kg/m2. (C) Weight status was based on BMIM. n = 719 for normal weight group (18.5BMIM<25 kg/m2) and
n = 776 for the group with obesity (BMIM30kg/m 2
). Results for underweight group (n = 45) and for overweight group (n = 662) were not shown.
showed smaller discrepancies in the systematic error of estimates produced from models that
included BMISRcompared to those that included BMIPM.
Discussion
Our analyses found that equations produced from regression models that included BMISR
per-formed better than equations that used BMIPM. This is consistent with the stronger correlation
of BMIMwith BMISRcompared to BMIPMin this study with an average of 6.5 years of interval
between the two examinations. We found that BMISR(r = 0.95) was more strongly correlated
with BMIMthan BMIPM(r = 0.82). Over 100 studies have compared self-reported height and
weight with measured values [4–6,17]. Generally these studies have found that adults
over-report their height and under-over-report their weight, resulting in an underestimation of BMI.
Despite this bias, BMISRis very strongly correlated (r>0.90) with concurrent BMIMin most
studies [18,19]. BMIPMwould be highly correlated with BMIMif weight changes were
propor-tionately similar across individuals over time. However, as shown in the Coronary Artery Risk Development in Young Adults (CARDIA) study weight changes are heterogeneous over a
5-year interval [20].
Only a handful of studies have developed equations to predict BMIMusing BMISRand
reported model fit statistics [6,9,21,22]. All those studies used cross-sectional data and
there-fore did not examine models that used BMIPMas in our present work. Most of those studies
stratified their analyses by sex and reported R2ranging from 0.85–0.92 for men and 0.83–0.96
for women [9,21,22], which is consistent with our sex-specific findings. Stommel and
Schoen-born [6] developed prediction equations in men and women combined using the 2001–2006
National Health and Nutrition Examination Survey (NHANES) and found an R2of 0.922,
which is consistent with our sex-combined results.
We emphasized bias between normal weight participants and participants with obesity in
imputation of BMIMbecause this bias could result in an overestimation of disease risk
associ-ated with BMI when predicted values are used in study of BMI-disease relationship [21]. Using
data from the NHANES II, Plankey et al. [11] found that predicted values from a model that
used BMISRto predict BMIMtended to increase bias in normal weight adults and reduce bias
in adults with overweight or obesity, resulting in an overestimate of BMIMin the normal
weight and an underestimate in participants with obesity. In addition to this study, another study is consistent with our work. Using data from the 2001–2006 NHANES, Stommel and
Schoenborn [6] also found the predicted values systematically overestimate BMI in leaner
indi-viduals and underestimate BMI in heavier indiindi-viduals. The BMIMat which the predicted BMI
is unbiased is 28.3 kg/m2.
Although demographics and perceived weight status are associated with misestimation of
BMIM[3,4,6,21], we found that addition of those variables and their more complex forms only
minimally improved prediction over models that included BMISRas the only variable. Age was
not statistically significant in models that used BMISR, perhaps because of the narrow age
range in our sample. However, despite a wider age of participants (30–64 years), Plankey et al.
[11] found that addition of age and nonlinear forms of BMISR(i.e., quadratic and cubic) to a
model containing BMISRalone only slightly improved prediction of BMIM(R2: 0.94 vs. 0.94 in
women and 0.90 vs. 0.90 in men; RMSE: 1.37 vs. 1.36 in women and 1.22 vs. 1.22 in men). The authors concluded that the bias differed little between the simple and more complex models.
Connor Gorber et al. [21] analyzed data from individuals aged18 years who participated in
the 2005 Canadian Community Health Survey. They developed a simple model and a full
model in the training dataset. The simple model contained BMISRonly and the full model
education, dissatisfied with life and perceived weight status). The R2from the full model is
only 0.01 larger than the R2from the simple model. Application of those equations to the test
dataset found that the MSDs between BMI predicted by the models and BMIMare close to
zero. The full model produced little advantage in the sensitivity and specificity over the simple
model in determination of obesity. Similar results were also found in studies from Sweden [9]
and Australia [22]. Again, those studies did not use longitudinal data as in our work presented
here.
It is important that in our work, measurements of height and weight were collected over a relatively long time interval (6.5 years). Our results are likely not applicable to longitudinal studies with short time intervals between examinations. In addition, participants in our study could have anticipated that they would be measured after reporting their height and weight
and this could have reduced bias in the reported data [23]. If investigators collect self-reported
height and weight from participants separately from other study variables it could also impact
accuracy [23]. Finally, bias would likely have been different if self-reported weight and height
had been collected in telephone interviews [10] or mailed survey [24] rather than in-person
interviews.
Despite all these issues, our study does provide new information that is relevant to research-ers who study participants over relatively long time intervals. In those instances collection of self-reported height and weight could be considered and used with an appropriate approach
(e.g., multiple imputation) to improve the imputation of missing BMIM. Our work also
indi-cates that investigators should be cautious about relying on previously measured height and
weight to indicate current BMIM. Since almost all obesity-related longitudinal studies collect
demographic variables, those variables could be included in the imputation model, but it appears they improve prediction only very slightly. Perceived weight status was not helpful for imputation of BMI derived from anthropometric measures. Further study is needed to under-stand time intervals and circumstances in which self-report of height and weight is superior to the other.
Supporting Information
S1 Table. Final models developed to predict BMIMin the whole dataset (n = 11,008). (DOCX)
Acknowledgments
This research uses data from Add Health, a program project directed by Kathleen Mullan Har-ris and designed by J. Richard Udry, Peter S. Bearman, and Kathleen Mullan HarHar-ris at the Uni-versity of North Carolina at Chapel Hill, and funded by grant P01-HD31921 from the Eunice Kennedy Shriver National Institute of Child Health and Human Development, with coopera-tive funding from 23 other federal agencies and foundations. Special acknowledgment is due Ronald R. Rindfuss and Barbara Entwisle for assistance in the original design. Information on
how to obtain the Add Health data files is available on the Add Health website (http://www.
cpc.unc.edu/addhealth). No direct support was received from grant P01-HD31921 for this analysis.
Author Contributions
Conceptualization: ZC JS KPT DZ.
Funding acquisition: JS.
Methodology: ZC JS KPT DZ.
Resources: JS PG.
Software: ZC.
Supervision: JS.
Validation: ZC.
Visualization: ZC JS KPT.
Writing – original draft: ZC.
Writing – review & editing: ZC JS KPT DZ SF PG.
References
1. Elobeid MA, Padilla MA, McVie T, Thomas O, Brock DW, Musser B, et al. Missing data in randomized clinical trials for weight loss: scope of the problem, state of the field, and performance of statistical meth-ods. PLoS One 2009; 4(8):e6624. doi:10.1371/journal.pone.0006624PMID:19675667
2. Niedhammer I, Bugel I, Bonenfant S, Goldberg M, Leclerc A. Validity of self-reported weight and height in the French GAZEL cohort. Int J Obes Relat Metab Disord 2000; 24(9):1111–1118. PMID:11033979 3. Jain RB. Regression models to predict corrected weight, height and obesity prevalence from
self-reported data: data from BRFSS 1999–2007. Int J Obes (Lond) 2010; 34(11):1655–1664.
4. Wen M, Kowaleski-Jones L. Sex and ethnic differences in validity of self-reported adult height, weight and body mass index. Ethn Dis; 22(1):72–78. PMID:22774312
5. Connor Gorber S, Tremblay M, Moher D, Gorber B. A comparison of direct vs. self-report measures for assessing height, weight and body mass index: a systematic review. Obes Rev 2007; 8(4):307–326. doi:10.1111/j.1467-789X.2007.00347.xPMID:17578381
6. Stommel M, Schoenborn CA. Accuracy and usefulness of BMI measures based on self-reported weight and height: findings from the NHANES & NHIS 2001–2006. BMC Public Health 2009; 9:421-2458-9-421. doi:10.1186/1471-2458-9-421PMID:19922675
7. Schafer JL, Graham JW. Missing data: our view of the state of the art. Psychol Methods; 7(2):147–177. PMID:12090408
8. Schenker N, Raghunathan TE, Bondarenko I. Improving on analyses of self-reported data in a large-scale health survey by using information from an examination-based survey. Stat Med 2010; 29 (5):533–545. doi:10.1002/sim.3809PMID:20029804
9. Nyholm M, Gullberg B, Merlo J, Lundqvist-Persson C, Rastam L, Lindblad U. The validity of obesity based on self-reported weight and height: Implications for population studies. Obesity (Silver Spring) 2007; 15(1):197–208.
10. Ezzati M, Martin H, Skjold S, Vander Hoorn S, Murray CJ. Trends in national and state-level obesity in the USA after correction for self-report bias: analysis of health surveys. J R Soc Med 2006; 99(5):250– 257. doi:10.1258/jrsm.99.5.250PMID:16672759
11. Plankey MW, Stevens J, Flegal KM, Rust PF. Prediction equations do not eliminate systematic error in self-reported body mass index. Obes Res 1997; 5(4):308–314. PMID:9285836
12. Paeratakul S, White MA, Williamson DA, Ryan DH, Bray GA. Sex, race/ethnicity, socioeconomic status, and BMI in relation to self-perception of overweight. Obes Res 2002; 10(5):345–350. doi:10.1038/oby. 2002.48PMID:12006633
13. Harris KM, Halpern CT, Whitsel E, Hussey J, Tabor J, Entzel P, et al. The National Longitudinal Study of Adolescent Health: Research Design.http://www.cpc.unc.edu/projects/addhealth/design.
14. Popkin BM, Udry JR. Adolescent obesity increases significantly in second and third generation U.S. immigrants: the National Longitudinal Study of Adolescent Health. J Nutr 1998; 128(4):701–706. PMID:
9521631
15. The NS, Suchindran C, North KE, Popkin BM, Gordon-Larsen P. Association of adolescent obesity with risk of severe obesity in adulthood. JAMA 2010; 304(18):2042–2047. doi:10.1001/jama.2010.1635
16. World Health Organization. Obesity: preventing and managing the global epidemic. Report on a WHO Consultation on Obesity. Technical Report 894. 2000:9.
17. Pursey K, Burrows TL, Stanwell P, Collins CE. How accurate is web-based self-reported height, weight, and body mass index in young adults? J Med Internet Res 2014; 16(1):e4. doi:10.2196/jmir.2909
PMID:24398335
18. Spencer EA, Appleby PN, Davey GK, Key TJ. Validity of self-reported height and weight in 4808 EPIC-Oxford participants. Public Health Nutr 2002; 5(4):561–565. doi:10.1079/PHN2001322PMID:
12186665
19. Keith SW, Fontaine KR, Pajewski NM, Mehta T, Allison DB. Use of self-reported height and weight biases the body mass index-mortality association. Int J Obes (Lond) 2011; 35(3):401–408.
20. Burke GL, Bild DE, Hilner JE, Folsom AR, Wagenknecht LE, Sidney S. Differences in weight gain in relation to race, gender, age and education in young adults: the CARDIA Study. Coronary Artery Risk Development in Young Adults. Ethn Health 1996; 1(4):327–335. doi:10.1080/13557858.1996.9961802
PMID:9395577
21. Connor Gorber S, Shields M, Tremblay MS, McDowell I. The feasibility of establishing correction factors to adjust self-reported estimates of obesity. Health Rep 2008; 19(3):71–82. PMID:18847148
22. Hayes AJ, Kortt MA, Clarke PM, Brandrup JD. Estimating equations to correct self-reported height and weight: implications for prevalence of overweight and obesity in Australia. Aust N Z J Public Health 2008; 32(6):542–545. doi:10.1111/j.1753-6405.2008.00306.xPMID:19076745
23. Shields M, Connor Gorber S, Janssen I, Tremblay MS. Bias in self-reported estimates of obesity in Canadian health surveys: an update on correction equations for adults. Health Rep 2011; 22(3):35–45. PMID:22106788