Open Access
Research
Effects of a popular exercise and weight loss program on weight
loss, body composition, energy expenditure and health in obese
women
Chad Kerksick
1,2, Ashli Thomas
3, Bill Campbell
4, Lem Taylor
5,
Colin Wilborn
5, Brandon Marcello
6, Mike Roberts
1, Emily Pfau
3,
Megan Grimstvedt
3, Jasmine Opusunju
3, Teresa Magrans-Courtney
3,
Christopher Rasmussen
7, Ron Wilson
3and Richard B Kreider*
7Address: 1Health and Exercise Science Department, University of Oklahoma, Norman, Oklahoma 73019-6081, USA, 2Endocrinology and Diabetes
Section, Department of Pediatrics, University of Oklahoma Health Sciences Center, Oklahoma City, Oklahoma 73104, USA, 3Department of
Health, Human Performance and Recreation, Baylor University, One Bear Place, Box 97313, Waco, Texas 76798-7313, USA, 4School of Physical
Education & Exercise Science, University of South Florida, Tampa, Florida 33620, USA, 5Exercise & Sport Science Department, University of
Mary-Hardin Baylor, Belton, Texas 76513, USA, 6Department of Athletics, Stanford University, Palo Alto, California 94305, USA and 7Department of
Health & Kinesiology, Texas A & M University, College Station, Texas 77843, USA
Email: Chad Kerksick - [email protected]; Ashli Thomas - [email protected]; Bill Campbell - [email protected]; Lem Taylor - [email protected]; Colin Wilborn - [email protected]; Brandon Marcello - [email protected];
Mike Roberts - [email protected]; Emily Pfau - [email protected]; Megan Grimstvedt - [email protected]; Jasmine Opusunju - [email protected]; Teresa Magrans-Courtney - [email protected];
Christopher Rasmussen - [email protected]; Ron Wilson - [email protected]; Richard B Kreider* - [email protected] * Corresponding author
Abstract
Objective: To determine the safety and efficacy of altering the ratio of carbohydrate and protein in low-energy diets in conjunction with a popular exercise program in obese women.
Design: Matched, prospective clinical intervention study to assess efficacy of varying ratios of carbohydrate and protein intake in conjunction with a regular exercise program.
Participants: One-hundred sixty one sedentary, obese, pre-menopausal women (38.5 ± 8.5 yrs, 164.2 ± 6.7 cm, 94.2 ± 18.8 kg, 34.9 ± 6.4 kg·m-2, 43.8 ± 4.2%) participated in this study. Participants were weight stable and not participating in additional weight loss programs.
Methods: Participants were assigned to either a no exercise + no diet control (CON), a no diet + exercise group (ND), or one of four diet + exercise groups (presented as kcals; % carbohydrate: protein: fat): 1) a high energy, high carbohydrate, low protein diet (HED) [2,600; 55:15:30%], 2) a very low carbohydrate, high protein diet (VLCHP) [1,200 kcals; 63:7:30%], 3) a low carbohydrate, moderate protein diet (LCMP) [1,200 kcals; 50:20:30%] and 4) a high carbohydrate, low protein diet (HCLP) [1,200 kcals; 55:15:30%]. Participants in exercise groups (all but CON) performed a pneumatic resistance-based, circuit training program under supervision three times per week.
Measurements: Anthropometric, body composition, resting energy expenditure (REE), fasting blood samples and muscular fitness assessments were examined at baseline and weeks 2, 10 and 14. Published: 14 May 2009
Nutrition & Metabolism 2009, 6:23 doi:10.1186/1743-7075-6-23
Received: 18 July 2008 Accepted: 14 May 2009
This article is available from: http://www.nutritionandmetabolism.com/content/6/1/23
© 2009 Kerksick et al; licensee BioMed Central Ltd.
Results: All groups except CON experienced significant reductions (P < 0.05 – 0.001) in waist circumference over 14 weeks. VLCHP, LCHP and LPHC participants experienced similar but significant (P < 0.05 – 0.001) reductions in body mass when compared to other groups. Delta responses indicated that fat loss after 14 weeks was significantly greatest in VLCHP (95% CI: -5.2, -3.2 kg), LCMP (-4.0, -1.9 kg) and HCLP (-3.8, -2.1 kg) when compared to other groups. Subsequent reductions in % body fat were significantly greater in VLCHP, LCMP and HCLP participants. Initial dieting decreased (P < 0.05) relative REE similarly in all groups. All exercise groups significantly (P
< 0.05) improved in muscular fitness, but these improvements were not different among groups. Favorable but non-significant mean changes occurred in lipid panels, glucose and HOMA-IR. Leptin levels decreased (P < 0.05) in all groups, except for CON, after two weeks of dieting and remained lower throughout the 14 week program. Exercise participation resulted in significant improvements in quality of life and body image.
Conclusion: Exercise alone (ND) appears to have minimal impact on measured outcomes with positive outcomes apparent when exercise is combined with a hypoenergetic diet. Greater improvements in waist circumference and body composition occurred when carbohydrate is replaced in the diet with protein. Weight loss in all diet groups (VLCHP, LCMP and HCLP) was primarily fat and stimulated improvements in markers of cardiovascular disease risk, body composition, energy expenditure and psychosocial parameters.
Introduction
The prevalence of obesity in the United States and throughout the world continues to increase. An estimated 1.2 billion people in the world are overweight with 300 million of them being obese [1,2]. Research over the last several decades indicates that regular activity and appro-priate energy intake can play critical roles in preventing and managing the negative health consequences of diabe-tes, obesity and other cardiovascular diseases [3-7]. Ini-tially, weight loss programs focused on restricting energy intake, but sharp reductions in energy intake have been shown to result in fat-free mass reductions and negatively impact metabolic rate [8]. Replacing dietary carbohydrate with protein without changing fat intake continues to be researched as a potential strategy to improve health and promote weight loss. While replacing dietary protein with fat in isocaloric amounts doesn't appear to improve the loss of body mass [9-11], studies in the last several years have shown that following diets which replace carbohy-drate with protein may stimulate greater weight loss [12,13] and improve body composition changes [12,14-16]. Interestingly, findings have also reported that replac-ing dietary carbohydrate with protein may also improve serum-based markers of diabetes and cardiovascular dis-ease (e.g. fasting insulin, glycemic responses, triglycerides and total cholesterol) [12,14-16]. While many of these studies examined a dietary intervention, several did not include any form of exercise component [14-16]. For those studies that did investigate a combination of dietary intake with and without exercise, some have lacked addi-tional control measures to fully elucidate the impact of these dietary approaches when combined with a pro-longed exercise intervention [12,13]. Furthermore, the mode of exercise is an important consideration, and the
incorporation of some aspect of resistance-based exercise during a weight loss program may help to maintain fat free mass, sustain resting energy expenditure levels and promote higher levels of function [8]. Currently, the number of investigations that have combined a resistance-based exercise program with a dietary intervention that focuses on replacing carbohydrate with protein is limited [8], making it difficult to adequately determine which form of exercise and dietary intervention has the greatest potential to help people achieve their weight loss and other health-related goals.
car-bohydrate, high protein, low fat diet (1,000 – 1,200 kcals: 20:50:30%) or a low calorie, high carbohydrate, low pro-tein, low fat diet (1,000 – 1,200 kcals: 55:15:30%) is rec-ommended depending on carbohydrate tolerance for an initial diet period of 2 – 4 weeks before increasing caloric intake to 1,600 kcals while maintaining a similar (but not identical) macronutrient distribution until weight loss goals are achieved. Once achieved, weight maintenance is promoted by adhering to a 2,200 – 2,600 kcals·d-1 diet
based on American Dietetic Association guidelines (% car-bohydrate:protein:fat = 55:15:30) with intermittent peri-ods of reduced caloric intake (e.g. 1,200 kcals·d-1) for
period of 2 to 3 days. This program was designed as a means to promote and sustain weight loss in women while preserving fat free mass and resting energy expendi-ture [19].
While previous research provides general conceptual sup-port for this program, the safety and efficacy of the Curves program has yet to be investigated. Therefore, the objec-tives of this study were two-fold: 1) to examine the effi-cacy of replacing dietary carbohydrate with protein while completing a weekly resistance-based circuit exercise pro-gram and 2) to determine the safety and efficacy of follow-ing the Curves fitness and weight loss program [19] over a prolonged period. It was hypothesized that all groups par-ticipating in the exercise program, irrespective of dietary assignment, would experience significant improvements in anthropometric measures, body composition, and improve their fitness and risk for cardiovascular disease. Further hypotheses were made that those participants fol-lowing diets that replaced dietary carbohydrate with pro-tein would experience greater improvements in anthropometrics and body composition in addition to greater improvements in cardiovascular disease markers.
Methods
Experimental Approach
Two primary objectives were studied in this investigation, first to examine the impact of replacing dietary carbohy-drate with dietary protein to varying degrees and second to assess the effectiveness of following the exercise and diet recommendations of the Curves program that were published at the time this study was initiated [19]. Partic-ipants were placed into one of six groups: no diet + no exercise control (CON), no diet + exercise (ND), high car-bohydrate, high energy diet (HED) + exercise (2,600; 55:15:30%); very low carbohydrate, high protein (VLCHP) + exercise (1,200; 63:7:30%), low carbohydrate, moderate protein (LCMP) + exercise (1,200: 50:20:30%), high carbohydrate, low protein (HCLP) + exercise group (1,200: 55:15:30%). All participants were tested over the course of a 14 week period for changes in anthropomet-rics, body composition, cardiovascular and muscular fit-ness, serum and whole clinical and hormonal changes
and psychosocial parameters after 0, 2, 10, and 14 weeks of following their assigned diet and exercise program. Pri-mary outcomes in this study were identified as waist cir-cumference while all secondary outcomes were body mass and DXA body composition parameters. Finally, tertiary outcomes were associated with changes in resting energy expenditure, cardiovascular and muscular fitness and all serum and whole blood safety and hormonal markers. Testing after 2 weeks was completed to assess the acute changes in energy expenditure and hormonal status after the most energy-restrictive phase of the diets (1,200 kcals·d-1) while testing at 10 and 14 weeks provide for
fol-low-up assessments after less-restrictive phases of the diet-ing program. Participation in the exercise program was hypothesized to promote greater improvements in all pri-mary and secondary outcomes measures when compared to the non-exercise controls (CON). A standard consort diagram is available which outlines the number of partic-ipants who were screened (n = 290), assigned to a group (n = 242), including how many to each intervention group and those that completed the entire 14 week proto-col (n = 161) (see Figure 1).
Participants
One-hundred sixty one sedentary, obese, female partici-pants (38.5 ± 8.5 yrs, 164.2 ± 6.7 cm, 94.2 ± 18.8 kg, 34.9 ± 6.4 kg·m-2, 43.8 ± 4.2%) participated in this study
(Table 1). Participants were not allowed to participate in this study if at baseline they reported: 1.) being currently diagnosed with any metabolic or cardiovascular disorder including known electrolyte abnormalities; heart disease, arrhythmias, diabetes, thyroid disease, hypogonadism; or a history of hypertension, hepatorenal, musculoskeletal, autoimmune, or neurologic disease; 2.) any current pre-scriptions for thyroid, hyperlipidemic, hypoglycemic, anti-hypertensive, or androgenic medications; 3.) taking any ergogenic levels of nutritional supplements that may affect muscle mass (e.g. creatine, β-hydroxy-β -methylbu-tyrate [HMB]), dehydroepiandrosterone [DHEA], or weight loss (e.g. ephedra, thermogenics, etc) within one year prior to the starting the study; 4.) any condition which classified them as high risk for cardiovascular dis-ease according to American College of Sports Medicine criteria [21]; 5) participating in any other form of a diet or exercise program during the 12 months prior to starting the study. Participants meeting eligibility criteria were informed of the requirements of the study and signed informed consent statements in compliance with the Human Subjects Guidelines of Baylor University and the American College of Sports Medicine.
Testing Sessions
pre-screening before completing a familiarization session where they were additionally screened and provided detailed information about the exercise program, diet and testing protocols. All participants completed informed consent documents during this familiarizations session. Prior to all testing sessions including baseline, partici-pants completed a 4 d dietary record, observed an 8 h fast and refrained from vigorous physical activity for 24 h prior to each testing session. All testing sessions were scheduled at similar times in the morning to control for diurnal variations. All baseline, 10 week and 14 week test-ing sessions, respectively, were identical in nature and consisted of blood collection (blood lipids, metabolic panels), anthropometric assessments (body mass, body mass index, waist circumference), resting energy expendi-ture, muscular fitness and cardiorespiratory assessments, body composition analysis (DXA) and psychosocial assessments (e.g. short-form-36 (SF-36) quality of life, social physique anxiety scale (SPA), Rosenberg self-esteem scale (RSE), Cash Body Image questionnaire). An additional testing session occurred after 2 weeks of dieting and consisted of all baseline measures with the exception of cardiorespiratory and muscular fitness assessments. Upon completion of baseline testing, all participants, with the exception of the no exercise control group (CON), began a thrice weekly 30 min pneumatic circuit-style resistance-based circuit exercise program inter-spersed with callisthenic activities. During each workout, fitness supervisors provided exercise instruction and assisted with self-monitoring of heart rate to maintain an exercise heart rate between 60–80% target heart rate using
age-predicted maximal heart rate (220 – age) and the Kar-vonen method.
Diet Assignments
Upon completion of baseline testing, participants were matched according to body mass and age into either a no diet + no exercise control (CON), a no diet + exercise group (ND), or one of four dietary regimens. The diets fol-lowed the Curves diet recommendations at the time this study was conducted [19] and consisted of replacing tary carbohydrate with dietary protein while keeping die-tary fat intake standardized at 30% of total daily caloric intake [14]. Participant's whose measured REE was less than 90% of predicted REE (no activity factor was incor-porated) using the Harris-Benedict prediction equation [22] were categorized as hypo-metabolic [23]. They were assigned to follow a 2,600 kcals·d1 at a macronutrient
ratio of 55:15:30% (carbohydrate:protein:fat), high-energy, high carbohydrate diet (HED) for 14 weeks to assess anthropometric and weight loss changes. A brief questionnaire was administered to all participants at familiarization to provide a qualitative indication of car-bohydrate/glycemic tolerance, which is used by the Curves program to assist with dietary assignment and thus was adopted as part of this investigation [19]. Recent stud-ies by our group have illustrated that in a large group of overweight and obese women this questionnaire effec-tively associates responses with indicators of metabolic syndrome [24,25]. Those participants responding in a positive fashion (e.g. provided answers indicative of car-bohydrate intolerance) were assigned to either the VLCHP or LCMP groups. Participants responding negatively were assigned to the HCLP diet [19]. In each of these diets, par-ticipants ingested 1,200 kcals·d-1 for 2-weeks (phase 1).
Over the next 8-weeks, energy intake was increased to 1,600 kcals·d-1 (phase 2) providing for a weight loss
period of 10 weeks consisting of caloric intakes ranging from 1,200 – 1,600 kcals·d-1. The remaining 4 weeks
(phase 3) utilized a weight maintenance approach in which participants followed a 2,600 kcals·d-1 using the
recommend macronutrient breakdown (55:15:30%; car-bohydrate: protein: fat) by the American Dietetic Associa-tion with intermittent 2 – 3 day periods of phase 1 dieting. Similar weight maintenance models have been previously investigated [14] for their effectiveness and this approach is utilized as a weight maintenance approach during this program. To facilitate adherence and comprehension of each dietary assignment, a team of reregistered dieticians performed an additional diet familiarization session with each participant and developed customized menu book-lets, providing sample diets and food substitutions for each diet phase. The booklets were used as checklists upon which all study participants were required to return after completing the study. Food logs were maintained for 4 days prior to each testing session. Registered dietitians
Standard consort diagram illustrating people who provided interest in participating, those that were screened, how group assignments were made, who completed program and reasons for termination of participation
Figure 1
Standard consort diagram illustrating people who provided interest in participating, those that were screened, how group assignments were made, who completed program and reasons for termination of participation.
Completed 14 week testing Baseline
7 Withdrew 5 Noncompliance 2 Not enough time
ND (n=23) VLCHP (n=74) HCLP (n=59) LCMP (n=58) CON (n=10) HCD (n=11) ND (n=17) VLCHP (n=48) HCLP (n=41) LCMP (n=37) CON (n=7) HCD (n=18)
290 Screened for eligibility
242 Assigned to a group
Reasons for Withdrawal
6 Withdrew 4 Not enough time 1 Change of jobs 1 Relocated
26 Withdrew 7 Not enough time 18 Noncompliance
1 Relocated 21 Withdrew
18 Noncompliance 1 Change of jobs 2 Relocated
18 Withdrew 13 Noncompliance
1 Change of jobs 4 Not enough time
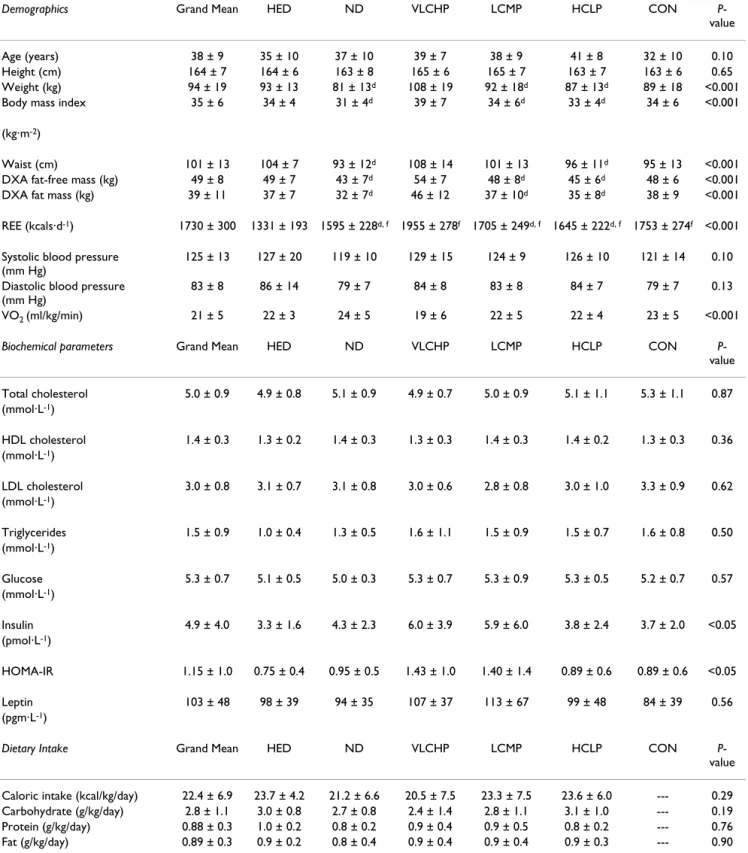
Table 1: Baseline anthropometric, dietary analysis, body composition and biochemical parameters for the high energy, high carbohydrate diet + exercise (HED; 2,600: 55:15:30), no diet + exercise (ND), very low carbohydrate, high protein diet + exercise (VLCHP: 1,200; 63:7:30), low carbohydrate, moderate protein diet + exercise (LCMP: 1,200; 50:20:30), high carbohydrate, low protein diet + exercise (HCLP: 1,200; 55:15:30) and no diet + no exercise control (CON).
Demographics Grand Mean HED ND VLCHP LCMP HCLP CON P -value
Age (years) 38 ± 9 35 ± 10 37 ± 10 39 ± 7 38 ± 9 41 ± 8 32 ± 10 0.10 Height (cm) 164 ± 7 164 ± 6 163 ± 8 165 ± 6 165 ± 7 163 ± 7 163 ± 6 0.65 Weight (kg) 94 ± 19 93 ± 13 81 ± 13d 108 ± 19 92 ± 18d 87 ± 13d 89 ± 18 <0.001
Body mass index 35 ± 6 34 ± 4 31 ± 4d 39 ± 7 34 ± 6d 33 ± 4d 34 ± 6 <0.001
(kg·m-2)
Waist (cm) 101 ± 13 104 ± 7 93 ± 12d 108 ± 14 101 ± 13 96 ± 11d 95 ± 13 <0.001
DXA fat-free mass (kg) 49 ± 8 49 ± 7 43 ± 7d 54 ± 7 48 ± 8d 45 ± 6d 48 ± 6 <0.001
DXA fat mass (kg) 39 ± 11 37 ± 7 32 ± 7d 46 ± 12 37 ± 10d 35 ± 8d 38 ± 9 <0.001
REE (kcals·d-1) 1730 ± 300 1331 ± 193 1595 ± 228d, f 1955 ± 278f 1705 ± 249d, f 1645 ± 222d, f 1753 ± 274f <0.001
Systolic blood pressure (mm Hg)
125 ± 13 127 ± 20 119 ± 10 129 ± 15 124 ± 9 126 ± 10 121 ± 14 0.10
Diastolic blood pressure (mm Hg)
83 ± 8 86 ± 14 79 ± 7 84 ± 8 83 ± 8 84 ± 7 79 ± 7 0.13
VO2 (ml/kg/min) 21 ± 5 22 ± 3 24 ± 5 19 ± 6 22 ± 5 22 ± 4 23 ± 5 <0.001
Biochemical parameters Grand Mean HED ND VLCHP LCMP HCLP CON P -value
Total cholesterol 5.0 ± 0.9 4.9 ± 0.8 5.1 ± 0.9 4.9 ± 0.7 5.0 ± 0.9 5.1 ± 1.1 5.3 ± 1.1 0.87 (mmol·L-1)
HDL cholesterol 1.4 ± 0.3 1.3 ± 0.2 1.4 ± 0.3 1.3 ± 0.3 1.4 ± 0.3 1.4 ± 0.2 1.3 ± 0.3 0.36 (mmol·L-1)
LDL cholesterol 3.0 ± 0.8 3.1 ± 0.7 3.1 ± 0.8 3.0 ± 0.6 2.8 ± 0.8 3.0 ± 1.0 3.3 ± 0.9 0.62 (mmol·L-1)
Triglycerides 1.5 ± 0.9 1.0 ± 0.4 1.3 ± 0.5 1.6 ± 1.1 1.5 ± 0.9 1.5 ± 0.7 1.6 ± 0.8 0.50 (mmol·L-1)
Glucose 5.3 ± 0.7 5.1 ± 0.5 5.0 ± 0.3 5.3 ± 0.7 5.3 ± 0.9 5.3 ± 0.5 5.2 ± 0.7 0.57 (mmol·L-1)
Insulin 4.9 ± 4.0 3.3 ± 1.6 4.3 ± 2.3 6.0 ± 3.9 5.9 ± 6.0 3.8 ± 2.4 3.7 ± 2.0 <0.05 (pmol·L-1)
HOMA-IR 1.15 ± 1.0 0.75 ± 0.4 0.95 ± 0.5 1.43 ± 1.0 1.40 ± 1.4 0.89 ± 0.6 0.89 ± 0.6 <0.05
Leptin 103 ± 48 98 ± 39 94 ± 35 107 ± 37 113 ± 67 99 ± 48 84 ± 39 0.56 (pgm·L-1)
Dietary Intake Grand Mean HED ND VLCHP LCMP HCLP CON P -value
Caloric intake (kcal/kg/day) 22.4 ± 6.9 23.7 ± 4.2 21.2 ± 6.6 20.5 ± 7.5 23.3 ± 7.5 23.6 ± 6.0 --- 0.29 Carbohydrate (g/kg/day) 2.8 ± 1.1 3.0 ± 0.8 2.7 ± 0.8 2.4 ± 1.4 2.8 ± 1.1 3.1 ± 1.0 --- 0.19 Protein (g/kg/day) 0.88 ± 0.3 1.0 ± 0.2 0.8 ± 0.2 0.9 ± 0.4 0.9 ± 0.5 0.8 ± 0.2 --- 0.76 Fat (g/kg/day) 0.89 ± 0.3 0.9 ± 0.2 0.8 ± 0.4 0.9 ± 0.4 0.9 ± 0.4 0.9 ± 0.3 --- 0.90
All data is presented as means ± SD at baseline. Significance level was set at 0.05.
reviewed the dietary records with the participant to pro-mote compliance to the diet programs.
Procedures
Dietary Inventories
Prior to each testing session, participants recorded all food and fluid intake over a 4-d period (including one weekend day), which was reflective of their normal dietary intake. Dietary inventories were then reviewed by a registered die-tician and analyzed for average caloric and macronutrient intake using ESHA Food Processor (Version 8.6) Nutri-tional Analysis software (Salem, OR).
Anthropometrics
Each testing session, height and body mass were deter-mined according to standard procedures using a Heal-thometer (Bridgeview, IL) self-calibrating digital scale with an accuracy of ± 0.02 kg. Waist circumference was measured using a Golnick tensiometer using standard ACSM criteria [21]. Resting heart rate was measured via palpation of the radial artery and resting blood pressure was determined using a mercury sphygomometer (Ameri-can Diagnostic Corporation, model # AD-720, Haup-puage, NY) according to previously accepted procedures [21].
Body Composition and Energy Expenditure Assessments
Resting energy expenditure (REE) assessments were made using a Parvo Medics TrueMax 2400 Metabolic Measure-ment System (Sandy, UT). This test was a non-exertional test performed in a fasted state with the participants lying supine on an exam table. A clear, hard plastic hood and soft, clear plastic drape was placed over the participants' neck and head in order to determine resting oxygen uptake and energy expenditure. All participants remained motionless without falling asleep for approximately 20 minutes. Data were recorded after the first ten minutes of testing during a five minute period of time in which crite-rion variables (e.g. VO2 [Lmin-1]) changed less than 5%
[26]. Using a sub-sample of 14 participants from this investigation, test-retest correlations (r) of collected VO2
in L·min1 ranged from 0.315 – 0.901 ( : 0.638) and
coefficient of variation ranged from 8.2% – 12.0% ( : 9.9%) with a mean intra-class coefficient of 0.942, p < 0.001. Participants then had their bone density and body composition assessed with a whole-body scan using a Hologic QDR-4500W DXA using software version 9.8 (Waltham, MA). Mean coefficients of variation in bone mineral content and bone mineral density measurements on the spine phantom ranged between 0.41 – 0.55%. Test-retest reliability studies performed on male athletes with this DXA machine have previously yielded mean
coefficients of variation for total bone mineral content and total fat free/soft tissue mass of 0.31 – 0.45% with a mean intra-class correlation of 0.985 [27].
Cardiopulmonary Exercise Tests
At baseline and after 10 and 14 weeks, participants com-pleted a peak cardiopulmonary exercise test according to the Bruce protocol [28]. Using standard electrode place-ment and a Quinton 710 ECG unit (Bothell, Washington, USA), 12-lead electrocardiogram tests were also made to assess heart function according to previously established criteria [21]. An exercise heart rate of 85% of predicted maximal heart rate was criteria used to standardized exer-tion during each test. Standard ACSM test terminaexer-tion cri-teria were monitored and followed throughout each test [21]. Resting and exercise expired gases were collected using a Parvo Medics TrueMax 2400 Metabolic Measure-ment System (Sandy, Utah, USA). Calibration of gas and flow sensors was completed every morning prior to testing and was found to be within 3% of the previous calibration point.
Maximal Strength and Endurance Assessments
At baseline and after 10 and 14 weeks, participants had their one-repetition maximum (1 RM) determined using the bench press and leg press exercises for changes in max-imal strength. Muscular endurance was assessed by having participants perform as many repetitions as possible with 80% of their pre-determined 1 RM. Standard lifting tech-niques and criteria according to National Strength and Conditioning Association (NSCA) were followed throughout all testing [29]. Test to test reliability of per-forming these strength tests in our lab on resistance-trained participants have yielded low mean coefficients of variation and high reliability for the bench press (1.9%, class r = 0.94) and hip sled/leg press (0.7%, intra-class r = 0.91).
Blood Collection Procedures
Fasted whole blood and serum samples were collected using standard phlebotomy techniques. Whole blood samples were analyzed for complete blood counts with platelet differentials using an Abbott Cell Dyn 3500 (Abbott Laboratories, Abbott Park, Illinois, USA) auto-mated hematology analyzer. Serum samples were ana-lyzed for a complete metabolic and thyroid panel including ketone assessment of beta-hydroxybutyrate using a calibrated Dade Behring Dimension RXL (Deer-field, Illinois, USA) automated clinical chemistry ana-lyzer. Coefficient of variation for the tests using this analyzer was similar to previously published data for these tests (range: 1.0 to 9.6%) [30]. Remaining serum was assayed using standard commercially available (DS Laboratories, Webster, Texas, USA) enzyme-linked immu-noabsorbent assays (ELISAs) for leptin and insulin. Serum X
concentrations were assessed in duplicate using a Wallac-Victor IV (Perkin-Elmer Life Sciences, Boston, Massachu-setts, USA) micro plate reader at an optical density of 450 nm against a known standard curve using standard ELISA procedures. Intra- and inter-assay CVs of 5.4 – 6.9 and 3.8 – 7.3% at ~5.0 – 21.1 ng·mL-1 existed for leptin and 1.3 –
2.6 and 5.2 – 6.2% at ~7.84 – 44.23 μIU·ml-1 for insulin,
respectively.
Psychosocial Assessments
Prior to any testing, participants completed the SF-36 Health-Related Quality of life (QOL) inventory [31], social physique anxiety scale (SPA) [32], Rosenburg self-esteem scale (RSE) [33], and a Cash body image question-naire [34].
Exercise Program
With the exception of the CON group, all participants par-ticipated in a supervised Curves exercise program three days per week throughout the fourteen week protocol (a total of 42 workouts). Each circuit-style workout consisted of 14 exercises (e.g. elbow flexion/extension, knee flex-ion/extension, shoulder press/lat pull, hip abductor/ adductor, chest press/seated row, horizontal leg press, squat, abdominal crunch/back extension, pec deck, oblique, shoulder shrug/dip, hip extension, side bends and stepping) constructed with pneumatic or hydraulic resistance that targeted opposing muscle groups in a con-centric-only fashion. Participants were informed of proper use of all equipment and were instructed to complete as many repetitions in a 30 s time period. In a continuous, interval fashion, participants performed floor-based cal-listhenic (e.g. running/skipping in place, arm circles, etc.) exercises for a 30 s time period after each resistance exer-cise in an effort to maintain a consistent exerexer-cise heart rate that corresponded to 60% to 80% of their maximum heart rate [21]. All workouts were supervised by trained fitness instructors who assisted with proper exercise technique and maintenance of adequate exercise intensity. Partici-pants were required to complete two complete circuits which corresponded to exercising for approximately 28 minutes followed by a standardized whole-body stretch-ing routine. Compliance to the exercise program was set a priori at a minimum of 70% compliance (30/42 exercise sessions). Participants were allowed to add an additional workout on a non-consecutive day to assist with main-taining appropriate exercise compliance and in rare instances (n<5), an additional week was added to the intervention.
Statistical Analysis
All data are presented as means and 95% CI for all varia-bles for the CON, ND, HED, VLCHP, LCMP and HCLP groups, respectively. All nutritional intake data was
nor-malized to kilograms of body mass and analyzed using 5 × 4 (without ND group) repeated measures ANOVA. Eleven participants completed all training and testing, but did not turn in accurate food records. Consequently, all statistical analysis of nutritional intake was made on the remaining 143 participants from the original dataset as individuals in the CON group (n = 7) completed dietary analysis at weeks 0 and 14 and were not included in the statistical analysis. Resting energy expenditure was ana-lyzed using a 6 × 4 (group × test [0, 2, 10 and 14 weeks]) ANCOVA for baseline body mass. All remaining data were analyzed using 6 × 3 (group × test [0, 10 and 14 weeks]) repeated measures ANOVA. 14-week change from base-line (delta) values were calculated and a mean with 95% confidence interval was instructed to assess changes over time. When significant group × time interaction effects were found, factor analysis of the main effects was deter-mined using pairwise comparisons and one-way ANOVA when appropriate. Select Pearson correlations were calcu-lated between the psychosocial and body composition variables to identify any relationships between these groups of data. Percent change from baseline was calcu-lated and reported to evaluate any changes in this data. Post-hoc power analysis all primary and secondary out-comes (e.g., waist circumference, body mass, body com-position via DXA) revealed observed powers values ranging from 0.821 – 0.998 with partial eta-squared val-ues ranging from 0.062 – 0.115. All statistical decisions were made using an alpha level of 0.05. Individual responses are plotted for waist circumference, body mass, DEXA fat mass and triglyceride changes while groups mean are graphed for changes in absolute REE with the mean and 95% confidence interval offset next to each fig-ure.
Results
Nutritional Intake
Anthropometrics and Body Mass
Waist circumference decreased in the HED, VLCHP and LCMP after 14 weeks (P < 0.001 for all groups, respec-tively). After 14 weeks, significant time effects for waist cir-cumference were found in all groups except CON (Table 2). As expected, when comparing all groups who exercised against those who did not exercise (CON), a significant group × time interaction was found for changes in waist circumference (Figure 2; P < 0.05). After 10 weeks, those participants who restricted caloric intake and exercised experienced a significantly greater loss of body mass than HED, ND and CON (P < 0.01; Figure 3). Participants fol-lowing the VLCHP diet experienced significantly greater body mass loss in comparison to the ND (P < 0.005) and CON (P < 0.005) diets. Similar findings were found for those individuals following the LCMP diet when com-pared to the ND (P < 0.005) and CON (P < 0.05) groups. Loss of body mass for the HCLP approached significance when compared to the ND (P = 0.077) and CON (P = 0.095) groups, but were subsequently not significant. Fur-thermore, all participants maintained their body mass over the last four weeks of the investigation (Table 2; P = 0.63).
Body Composition
Body composition was assessed at 0, 10 and 14 weeks to determine changes in fat-free and fat mass (Table 2). All groups that restricted caloric intake and exercised (VLCHP, LCMP, HCLP) experienced significant but simi-lar within group reductions over time in DXA fat-free mass. Similar changes in DXA fat mass (Figure 4) were found in VLCHP, LCMP and HCLP after both 10 weeks and 14 weeks which resulted in an overall reduction of DXA % body fat in the VLCHP, LCMP and HCLP groups at both 10 weeks and 14 weeks (Table 2). DXA fat reduc-tions in the VLCHP group were significantly greater after 14 weeks when compared to HED, ND and CON (P < 0.05).
Energy Expenditure
Fasting resting energy expenditure (REE) measurements were obtained at 0, 2, 10 and 14 weeks (not all data is shown) to determine changes in resting energy expendi-ture (Figure 5 and Table 2). To control for the influence of baseline body mass on REE, analysis of the absolute rest-ing energy expenditure data was performed usrest-ing an ANCOVA and revealed no overall significant group × time interaction effect (P = 0.45) although significant within-group increases occurred over time for the HED, ND and HCLP groups. As expected due to the relationship between energy intake and expenditure, oneway ANOVA revealed significantly greater increases from baseline after 2, 10 and 14 weeks (P < 0.001 at all three time points) in absolute REE for the HED group when compared to all other groups (Figure 5 and Table 2).
Cardiovascular and Muscular Fitness Changes
At baseline and after 14 weeks of following the diet and exercise programs, all participants completed maximal strength and muscular endurance assessments (Table 3). As expected, exercise training significantly increased rela-tive peak oxygen uptake in VLCHP (P < 0.001), LCMP (P < 0.01) and HCLP (P < 0.001) while mean reductions in resting heart rate (-3.3 ± 16.5%; P = 0.01), systolic blood pressure (-2.8 ± 12.5%; P = 0.02), mean arterial pressure (-3.4 ± 10%) and rate pressure product (-5.8 ± 20%) occurred in these groups (data not shown). No significant group × time interaction effect was found for bench press (P = 0.44) or leg press 1 RM (P = 0.38), although those groups that participated in the exercise program did achieve significant increases (P < 0.05–0.001) in relative bench press and leg press 1 RM while CON did not expe-rience changes in either bench press (P = 0.59) or leg press 1 RM (P = 0.54), respectively. No significant differences were observed among those groups that exercised for 14 weeks suggesting that all dietary regimens equally impacted adaptations to exercise training.
Lipid Panels
Lipid panels (e.g. triglycerides, total cholesterol, LDL and HDL cholesterol) were completed at weeks 0 and 14 (Table 4). No significant interactive effects for total cho-lesterol (P = 0.90), triglycerides (P = 0.31), HDL choles-terol (P = 0.78), and LDL cholesterol (P = 0.54) values were found in any group. Significant reductions in total cholesterol were found after 14 weeks for found for the VLCHP and HCLP groups. Furthermore, significant but similar within group increases in HDL cholesterol were seen for VLCHP, LCMP and HCLP, but not the HED, ND or CON groups.
Markers of Fuel Utilization and Energy Regulation
Clinical Safety Markers
Serum and whole blood safety panels were analyzed from fasting blood after 0 and 14 weeks. While some hemato-logical variables did report main effects over time with no significant interaction effects, none of these changes occurred outside of the clinically accepted normative
val-ues for these variables [36] and thus are not being reported. No significant main or interaction effects (P > 0.05) were found for found kidney/liver enzymes (e.g. AST, ALT, GGT, Alk Phos) and markers of protein break-down (e.g. Uric Acid, BUN, creatinine, BUN:creatinine ratio, creatine kinase).
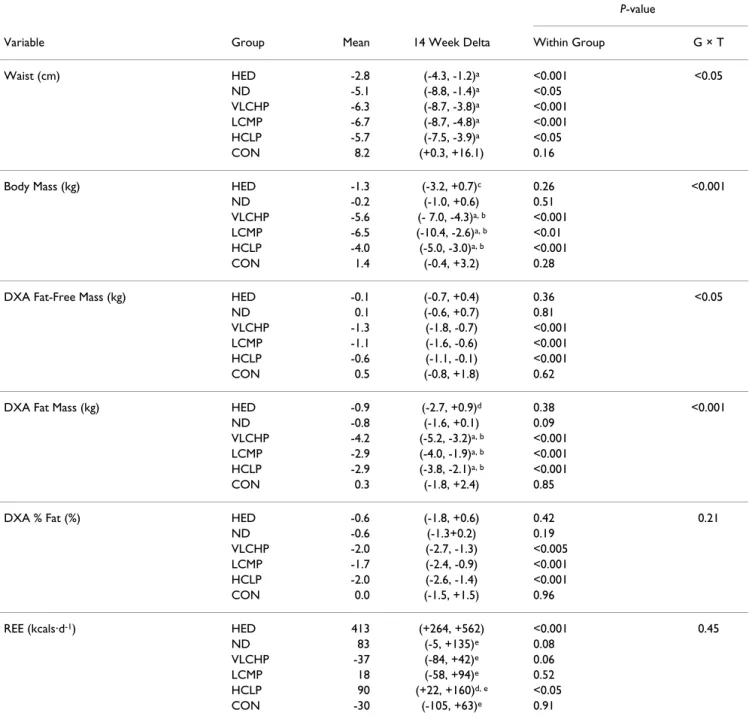
Table 2: Anthropometric, body mass, body composition and energy expenditure changes for the high energy, high carbohydrate diet + exercise (HED; 2,600: 55:15:30), no diet + exercise (ND), very low carbohydrate, high protein diet + exercise (VLCHP: 1,200; 63:7:30), low carbohydrate, moderate protein diet + exercise (LCMP: 1,200; 50:20:30), high carbohydrate, low protein diet + exercise (HCLP: 1,200; 55:15:30).
P-value
Variable Group Mean 14 Week Delta Within Group G × T
Waist (cm) HED -2.8 (-4.3, -1.2)a <0.001 <0.05
ND -5.1 (-8.8, -1.4)a <0.05
VLCHP -6.3 (-8.7, -3.8)a <0.001
LCMP -6.7 (-8.7, -4.8)a <0.001
HCLP -5.7 (-7.5, -3.9)a <0.05
CON 8.2 (+0.3, +16.1) 0.16
Body Mass (kg) HED -1.3 (-3.2, +0.7)c 0.26 <0.001
ND -0.2 (-1.0, +0.6) 0.51
VLCHP -5.6 (- 7.0, -4.3)a, b <0.001
LCMP -6.5 (-10.4, -2.6)a, b <0.01
HCLP -4.0 (-5.0, -3.0)a, b <0.001
CON 1.4 (-0.4, +3.2) 0.28
DXA Fat-Free Mass (kg) HED -0.1 (-0.7, +0.4) 0.36 <0.05
ND 0.1 (-0.6, +0.7) 0.81
VLCHP -1.3 (-1.8, -0.7) <0.001 LCMP -1.1 (-1.6, -0.6) <0.001 HCLP -0.6 (-1.1, -0.1) <0.001
CON 0.5 (-0.8, +1.8) 0.62
DXA Fat Mass (kg) HED -0.9 (-2.7, +0.9)d 0.38 <0.001
ND -0.8 (-1.6, +0.1) 0.09
VLCHP -4.2 (-5.2, -3.2)a, b <0.001
LCMP -2.9 (-4.0, -1.9)a, b <0.001
HCLP -2.9 (-3.8, -2.1)a, b <0.001
CON 0.3 (-1.8, +2.4) 0.85
DXA % Fat (%) HED -0.6 (-1.8, +0.6) 0.42 0.21
ND -0.6 (-1.3+0.2) 0.19
VLCHP -2.0 (-2.7, -1.3) <0.005 LCMP -1.7 (-2.4, -0.9) <0.001 HCLP -2.0 (-2.6, -1.4) <0.001
CON 0.0 (-1.5, +1.5) 0.96
REE (kcals·d-1) HED 413 (+264, +562) <0.001 0.45
ND 83 (-5, +135)e 0.08
VLCHP -37 (-84, +42)e 0.06
LCMP 18 (-58, +94)e 0.52
HCLP 90 (+22, +160)d, e <0.05
CON -30 (-105, +63)e 0.91
Dietary intake is presented as energy (i.e. calories) intake: % carbohydrate: protein: fat. All data is presented as the mean plus the 95% confidence intervals for the delta response at week 14. Main effects for time are provided as within-group P-values. Group × time interaction effects are provided as GxT P-values. Significance level was set at 0.05.
aDifferent than CON, P < 0.05, bDifferent from ND, P < 0.05, cDifferent from LCMP, P < 0.05, dDifferent than VLCHP, P < 0.05, eDifferent from
Psychosocial Results
Individual QOL subscales were completed at baseline and after 10 and 14 weeks and are presented as delta values for 0 and 14 weeks, respectively. Physical functioning (W0: 6.7 ± 22; W14: 9.3 ± 19), bodily pain (W0: 6.1 ± 30; W14: 4.9 ± 25), general health (W0: 8.3 ± 14; W14: 8.4 ± 15), vitality (W0: 11.2 ± 15; W14: 11.9 ± 14), and mental health (W0: 6.3 ± 13; W14: 7.3 ± 14) scores significantly increased (all P < 0.05) in exercising individuals (all groups except CON and ND) independent of dietary assignment. Similarly, role emotional scores (W0: -13.2 ± 43; W14: -16.5 ± 44) were significantly (P < 0.05) decreased while social functioning scores were unchanged (P > 0.05). No significant (P > 0.05) correlations were found between the changes in the QOL subscales and anthropometric (e.g. waist circumference) and body com-position (e.g. body mass and DXA parameters) variables. Body image assessment revealed significant (P < 0.05) percent increases from baseline in exercising individuals irrespective of dietary assignment after 10 and 14 weeks, respectively, for appearance evaluation (W10: 50.5 ± 20; W14: 50.0 ± 20%), appearance orientation (W10: 6.6 ± 32; W14: 6.1 ± 32%), body area satisfaction scale (W10: 23.7 ± 19; W14: 14.7 ± 29%), and overweight preoccupa-tion (W10: 20.1 ± 31; W14: 17.8 ± 34%) while self-classi-fied weight (SCW) did not change. No changes (P > 0.05) occurred for any diet or exercise group for the Rosenberg self-esteem scale and the social physique anxiety scale.
Changes in DXA fat mass were (P < 0.05) correlated with body area satisfaction and self-classified weight scores while changes in percent body fat correlated (P < 0.05) with appearance evaluation, appearance orientation, body area satisfaction, self-classified weight and social physique anxiety values.
Discussion
The purpose of this study was two-fold: 1) to determine the impact of replacing dietary carbohydrate with dietary protein and 2) to determine the impact of the Curves fit-ness and weight loss program on weight loss, body com-position, energy expenditure, psychosocial outcomes, and markers of health in sedentary, obese females. This study represents the first of a series of studies by our research group to examine the effectiveness of the Curves fitness and weight loss program which is currently being fol-lowed by millions of women worldwide. Although our study contains many strengths such as our overall sample size, supervised exercise, dietary control measures and inclusion of exercise-only and no exercise/no diet con-trols, the marked difference in sample size among groups presents some challenges with interpreting our findings. While the authors acknowledge increasing the sample size in these groups would have been helpful, the primary objective was to assess the impact of altering the macronu-trient ratio of the dietary regimens while also examining the overall impact of the exercise and diet programs used by the Curves system. Furthermore, statistical power anal-ysis of our primary (e.g. waist circumference) and second-ary outcomes (e.g. body mass and DXA body composition variables) ranged from 0.821 – 0.998 with partial eta squared values of 0.062 – 0.115 suggesting that our statis-tical analysis were adequately powered for our a priori determined end points. Our initial hypothesis was that participation in the exercise program would promote weight loss, improve body composition and fitness along with reducing markers of cardiovascular disease and that following a diet which restricted caloric intake while replacing dietary carbohydrate with protein at controlled fat intake levels would result in greater weight loss and improvements in health. Results from this study show that the greatest changes did occur in those groups that restricted their caloric intake in combination with the exercise program while participation in just the exercise program appears to have little to no effect over weight loss and body composition changes, a finding previously reported [8].
Results from the dietary analysis revealed significant dif-ferences in energy intake and carbohydrate and protein intake between dietary phases (e.g. Phase I, Phase II, etc.) and dietary groups (e.g. VLCHP and LCMP vs. HCLP). Overall dietary compliance during the 14 week program was deemed successful in all diet groups with the
excep-Delta change in waist circumference (cm) at 14 weeks
Figure 2
tion of the HED group, where it appears this group strug-gled to consume their prescribed level of calories (actual mean intake of 1846.6 ± 366.6 kcals·d1 vs. prescribed
intake of 2,600 kcals·d-1). Caloric intake in this group,
however, was higher by an average of 193 kcals·d-1, when
compared to VLCHP, LCMP and HCLP. This allowed for comparison to lower and caloric intakes while exercising, which was the main premise for this higher dietary pre-scription, albeit not to the degree we originally hoped. This is likely due to either under-reporting or the inherent error associated with using dietary food records as recent studies from our laboratory have suggested that the mag-nitude of error associated with self-reporting of food intake is greater when higher caloric intakes are being pre-scribed [37,38]. An additional important note is that although women in the moderate and high protein diet groups consumed a high percentage of calories in the form of protein, the relative intakes of this macronutrient ranged from 0.9 to 1.1 grams PRO·kg-1·d-1, respectively,
suggesting that overall protein intake was increased above RDA guidelines.
Waist circumference is a key predictor of diabetes and car-diovascular disease [39]. Findings from the present study suggest that participation in a resistance-based circuit
exercise program can significantly reduce waist circumfer-ence irrespective of what dietary regimen is being fol-lowed. Further when dietary carbohydrate is replaced with protein, greater decreases in waist circumference may result (VLCHP: = -6.3: [-8.7, -3.8]; LCMP: = -6.7:
[-8.7, -4.8]; HCLP: = -5.7: [-7.5, -3.9]), but these between-group differences were not significant (Figure 2 and Table 2). Regarding weight loss, significant reductions in body mass were found in all groups that followed a diet and participated in the exercise program in amounts sim-ilar to recently published investigations [40,41]. As expected, the greatest reductions in body mass occurred in those groups that restricted their calories to the greatest extent and for the longest period of time (VLCHP, LCMP and HCLP), but there were no differences between the amount of lost in the HCLP when compared to VLCHP and LCMP. These findings are consistent with other inves-tigations that investigated the impact of macronutrient content on weight loss in diabetic and non-diabetic pop-ulations with no exercise intervention [14,41-43]. Further, findings from Layman [12] suggested that a higher intake of protein with or without exercise was responsible for greater total weight loss [12]. In the present study, partic-ipants following the VLCHP and LCMP programs experi-enced greater but non-significant levels of body mass and fat mass loss when compared to the HCLP group. Similar reductions (all P < 0.001) occurred in fat-free mass for VLCHP, LCMP and HCLP, while significant reductions in percent body fat were still found in all three groups. These findings contrast with other studies that have suggested higher protein diets may preferentially help to preserve lean tissue [12,15] in those individuals who have replaced dietary carbohydrate intake with protein. Many reasons exist as to why differences in these findings exist, most notably subtle differences in the diet and exercise inter-ventions. Nevertheless, present findings demonstrate the ability to lose a large percentage of weight as fat while maintaining a large amount of fat free mass while dieting and exercising [7,16] and to a greater extent than other control conditions.
Reductions in energy expenditure have been reported in conjunction with restriction of caloric intake [42,44]. This down-regulation has subsequently been linked to difficul-ties with weight maintenance as well as regaining the lost body mass over time [8]. Consistent with many prior reports, significant reductions in REE occurred after con-suming 1,200 kcal·d-1 for the first two weeks of the
present study, even in conjunction with exercise. Caloric intake was increased by 400 kcals·d1 for the next 8 weeks
X X
X
Delta change in body mass (kg) at 14 weeks
Figure 3
which increased REE back to baseline levels in all groups except HED as this group experienced further increases in REE (Figure 5). A slight increase in energy intake during the following 8 weeks to 1,600 kcals·d1 (which was close
to mean daily REE) stimulated increases in REE despite participants losing a significant amount of weight and fat mass. In these groups, REE was further increased when participant's began ingesting a 2,600 kcal: 55:15:30 diet with intermittent dieting (6 days out of 31) at their previ-ously followed energy and macronutrient levels similar to previous energy balance approaches used in the literature [14]. Collectively, these findings suggest that relative lev-els of energy expenditure can be maintained while com-pleting a weekly resistance-based circuit training program in conjunction with modest caloric restriction (phase II) or potentially even intermittent dieting (Phase III).
As hypothesized, all groups except CON experienced improvements in peak oxygen uptake and maximal strength levels (Table 3) in accordance with other studies which have employed a regular exercise program to over-weight/obese and/or sedentary populations [7,40]. Mini-mal studies have incorporated a circuit-style resistance mode of exercise to this population, thus providing
evi-dence that this type of training promotes general improve-ments in fitness in this population. Additionally, the serum reductions in glucose (2.6%), total cholesterol (2.5%) and LDL cholesterol (2.8%) were significant and similar to other studies which have employed dietary reg-imens that replace dietary carbohydrate in favor of greater dietary protein (Table 4) [45]. While no significant group × time effect was found for insulin (P = 0.08), individuals in the VLCHP and LCMP groups experienced significant reductions, providing continued support that higher intakes of protein may help to promote such changes [14]. A weakness of our study design is the inherent nature of pneumatic resistance. Such exercise modes make it impossible to determine how much resistance is actually being applied and subsequently creates challenges for documenting changes in total work throughout the exer-cise program in all groups. In this regard, it is possible that the total work completed from workout to workout and week to week didn't change or even decreased, although the physiological adaptations which did occur make this unlikely. For this reason, heart rate and ratings of per-ceived exertion were monitored throughout every exercise session in an attempt to promote consistency from work-out to workwork-out, while the number of completed repeti-tions were recorded to promote adequate progression. It was suggested that as fitness parameters increased each individual's ability to complete work would also be sub-sequently increased. Although each workout was intermit-tent in nature, heart rate monitoring did successfully keep individual workouts in the same relative range of exercise intensity
The relationship of leptin to weight loss, energy expendi-ture and insulin sensitivity has been characterized [3,46,47]. In this regard, circulating levels of leptin have been shown to decrease in response to decreases in energy availability [46], however, the influence of exercise and alterations in the macronutrient ratio is still undeter-mined. Volek and colleagues [3] suggested that significant decreases in leptin occur as part of an 8-week weight loss program, which similarly occurred in the present study. Further, Sartorio et al. [46] used a combination of energy-restricted diets with a 5 d·wk-1 aerobic and anaerobic
exercise program and reported an acute, significant reduc-tion in leptin levels which closely mimicked changes in body mass. As observed in the Sartorio study, serum leptin changes in the present study mimicked body mass changes and significantly decreased in all groups (except CON) after 2 weeks (Table 4). No significant changes occurred in any diet or exercise groups for markers of kid-ney and liver function (e.g. AST, ALT, GGT, creatinine, etc.) and fat or protein breakdown (e.g. ketones, total pro-tein, BUN, etc.). Present findings support contentions that
Delta change in DXA fat mass (kg) at 14 weeks
Figure 4
higher proteins do not invoke negative alterations in any of these serum variables after 14 weeks in obese, but oth-erwise health populations [1,3,43,45].
An additional area of importance relative to public health and exercise adherence were the psychosocial assess-ments. In this regard, individual subscales of the SF-36 (e.g. physical functioning, bodily pain, general health, vitality, and mental health) significantly improved throughout exercise. While it could be stated that the sig-nificant increase in the bodily pain subscale was a nega-tive response, it is an expected response considering the participants were sedentary for an extended period of time prior to the start of the study and placed in a resistance-training program, likely invoking some stiffness and delayed-onset muscle soreness. Additionally, significant increases in several subscales (e.g. appearance evaluation, appearance orientation, body area satisfaction and over-weight preoccupation) of body image evaluation also improved in those individuals who were following the exercise program. In addition to improvement in several of the psychosocial variables, changes in these variables were significantly (P < 0.05) correlated to changes in body composition (e.g. fat mass and body fat %). Considering statistical probability that one of every twenty correlations run will result in a significant finding, it is possible that significance was found merely due to chance. While not
intended to be causal, these findings suggest that changes in body composition may operate in conjunction with changes in body image as a result of exercise participation.
As such our investigation has many strengths and weak-nesses to consider when evaluating this data against other data in this research area. Our study design could have been more complete by including a diet only control group with restricted caloric intake as this would have allowed us to more closely evaluate the impact of the exer-cise program in each dietary group. In this respect, a recent study has illustrated a similar weight-loss effect when a dieting only approach or a combination of exercise and diet is used if the net shift in energy expenditure is the same, however, a greater fitness benefit was reported which could have implications for cardiovascular health [40]. Additionally, while the sample size across groups varied widely, our primary interest was in evaluating the changes in different dietary regimens with the exercise program. Strengths in our study involve the use of a rather large sample over several weeks of the intervention in comparison to other related studies. Also, a strength in the present study is our examination of a commercial pro-gram that is available to women all over the world and is currently the program of choice for millions of women at over 10,000 locations across the globe.
Conclusion
In summary, results of this study indicate that combining a diet that restricts caloric intake in combination with a resistance-based circuit exercise program stimulates the greatest amount of weight loss and improvements in measures of body composition (e.g. waist circumference, DXA, etc.). When carbohydrate is replaced with protein while keeping fat intake at recommended levels (VLCHP and LCMP), larger decreases in waist circumference, body mass, fat mass and fat-free mass when compared to a diet that has a higher proportion of carbohydrate (HCLP) in addition to greater decreases in fasting insulin levels. As expected, regular participation in a resistance-based cir-cuit exercise program resulted in marked losses of body mass, improvements in body composition and overall improvements in cardiovascular and musculoskeletal fit-ness. Participation in the exercise program allowed for weight loss without concomitant reductions in resting energy expenditure. Additionally, those participants who were identified to have a low resting energy expenditure at baseline also experienced weight loss while exercising, but being prescribed a diet higher in calories. Significant reductions in leptin levels as well as improvements in fit-ness, markers of health, health-related quality of life, and body image were found for all individuals who followed the exercise program. These findings suggest that replacing carbohydrate with protein can be an effective strategy to improve body composition and reduce cardiovascular
Delta change in absolute resting energy expenditure (kcald-1)
at 14 weeks
Figure 5
Delta change in absolute resting energy expenditure (kcal·d-1) at 14 weeks. Each respective individual group mean and 95% confidence interval are placed immediately to the right of each data group. HED = high-energy, high carbo-hydrate diet + exercise (n = 11); ND = no diet + exercise (n = 17); VLCHP = very low carbohydrate, high protein diet + exercise (n = 48); LCMP = Low carbohydrate, moderate pro-tein + exercise (n = 37); HCLP = High carbohydrate, low protein + exercise (n = 41); CON = no diet + no exercise (n = 7). dDifferent from VLCHP, P < 0.05. eDifferent from all other groups, P < 0.05.
Delta Absolute REE (kcals/day)
disease markers while participating in a resistance-based circuit exercise program in sedentary overweight women.
Abbreviations
HED: High-energy diet + exercise group; VLCHP: Very low carbohydrate, high protein diet + exercise group; LCMP: Low calorie, moderate protein diet + exercise group; HCLP: High carbohydrate, low protein diet + exercise group; CON: Control group; ND: No diet + exercise group; U·L-1: units per liter; mmol·L-1: millimoles per
liter; μmol·L-1: micromoles per liter; pmol·L-1: picomoles
per liter; mM: millimoles; DXA: dual energy x-ray
absorp-tiometry; HOMA-IR: homeostatic model assessment of insulin resistance.
Competing interests
Curves International (Waco, Texas, USA) provided fund-ing for this project through an unrestricted grant to Rich-ard Kreider, PhD while at Baylor University. All researchers involved independently collected, analyzed, and interpreted the results from this study and have no financial interests concerning the outcome of this investi-gation. Publication of these findings should not be viewed as endorsement by the investigators, their institutions, or the editorial board of Nutrition and Metabolism.
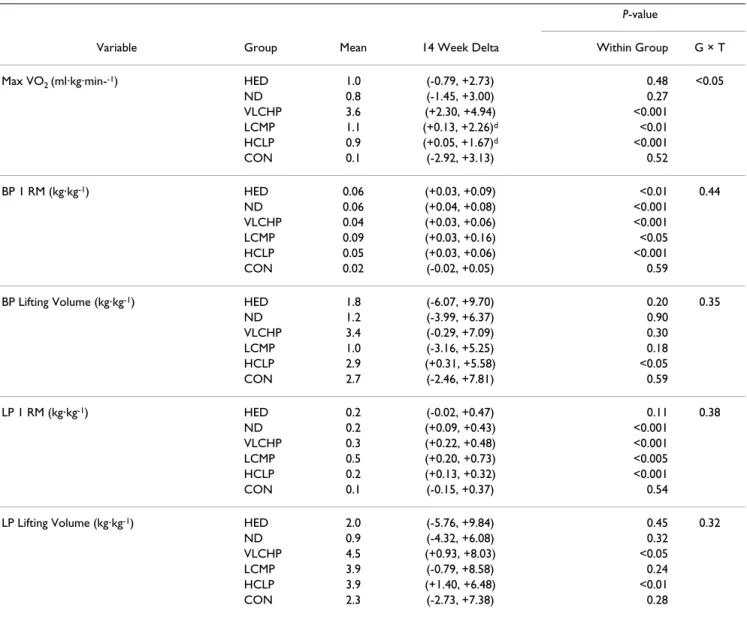
Table 3: Cardiorespiratory and muscular fitness changes for the high energy, high carbohydrate diet + exercise (HED; 2,600: 55:15:30), no diet + exercise (ND), very low carbohydrate, high protein diet + exercise (VLCHP: 1,200; 63:7:30), low carbohydrate, moderate protein diet + exercise (LCMP: 1,200; 50:20:30), high carbohydrate, low protein diet + exercise (HCLP: 1,200; 55:15:30).
P-value
Variable Group Mean 14 Week Delta Within Group G × T
Max VO2 (ml·kg·min--1) HED 1.0 (-0.79, +2.73) 0.48 <0.05
ND 0.8 (-1.45, +3.00) 0.27
VLCHP 3.6 (+2.30, +4.94) <0.001
LCMP 1.1 (+0.13, +2.26)d <0.01
HCLP 0.9 (+0.05, +1.67)d <0.001
CON 0.1 (-2.92, +3.13) 0.52
BP 1 RM (kg·kg-1) HED 0.06 (+0.03, +0.09) <0.01 0.44
ND 0.06 (+0.04, +0.08) <0.001
VLCHP 0.04 (+0.03, +0.06) <0.001
LCMP 0.09 (+0.03, +0.16) <0.05
HCLP 0.05 (+0.03, +0.06) <0.001
CON 0.02 (-0.02, +0.05) 0.59
BP Lifting Volume (kg·kg-1) HED 1.8 (-6.07, +9.70) 0.20 0.35
ND 1.2 (-3.99, +6.37) 0.90
VLCHP 3.4 (-0.29, +7.09) 0.30
LCMP 1.0 (-3.16, +5.25) 0.18
HCLP 2.9 (+0.31, +5.58) <0.05
CON 2.7 (-2.46, +7.81) 0.59
LP 1 RM (kg·kg-1) HED 0.2 (-0.02, +0.47) 0.11 0.38
ND 0.2 (+0.09, +0.43) <0.001
VLCHP 0.3 (+0.22, +0.48) <0.001
LCMP 0.5 (+0.20, +0.73) <0.005
HCLP 0.2 (+0.13, +0.32) <0.001
CON 0.1 (-0.15, +0.37) 0.54
LP Lifting Volume (kg·kg-1) HED 2.0 (-5.76, +9.84) 0.45 0.32
ND 0.9 (-4.32, +6.08) 0.32
VLCHP 4.5 (+0.93, +8.03) <0.05
LCMP 3.9 (-0.79, +8.58) 0.24
HCLP 3.9 (+1.40, +6.48) <0.01
CON 2.3 (-2.73, +7.38) 0.28
Dietary intake is presented as energy (i.e., calories) intake: % carbohydrate: protein: fat. All data is presented as the mean plus the 95% confidence intervals for the delta response at week 14. Main effects for time are provided as within-group P-values. Group × time interaction effects are provided as GxT P-values.Significance level was set at 0.05.
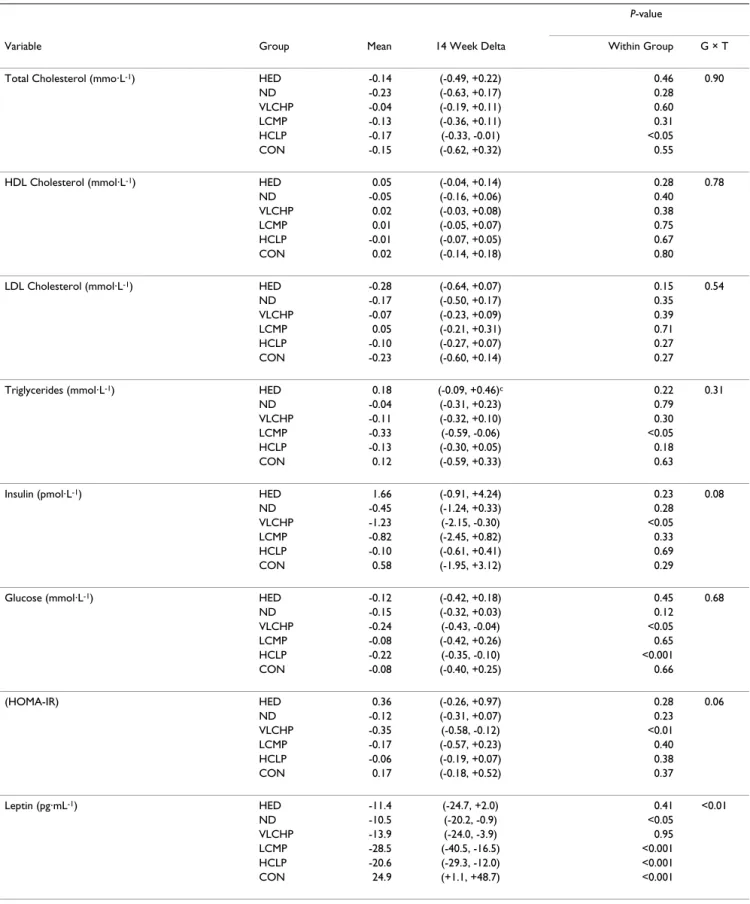
Table 4: Lipid panel, glucose, insulin, HOMA and leptin changes for the high energy, high carbohydrate diet + exercise (HED; 2,600: 55:15:30), no diet + exercise (ND), very low carbohydrate, high protein diet + exercise (VLCHP: 1,200; 63:7:30), low carbohydrate, moderate protein diet + exercise (LCMP: 1,200; 50:20:30), high carbohydrate, low protein diet + exercise (HCLP: 1,200; 55:15:30).
P-value
Variable Group Mean 14 Week Delta Within Group G × T
Total Cholesterol (mmo·L-1) HED -0.14 (-0.49, +0.22) 0.46 0.90
ND -0.23 (-0.63, +0.17) 0.28
VLCHP -0.04 (-0.19, +0.11) 0.60
LCMP -0.13 (-0.36, +0.11) 0.31
HCLP -0.17 (-0.33, -0.01) <0.05
CON -0.15 (-0.62, +0.32) 0.55
HDL Cholesterol (mmol·L-1) HED 0.05 (-0.04, +0.14) 0.28 0.78
ND -0.05 (-0.16, +0.06) 0.40
VLCHP 0.02 (-0.03, +0.08) 0.38
LCMP 0.01 (-0.05, +0.07) 0.75
HCLP -0.01 (-0.07, +0.05) 0.67
CON 0.02 (-0.14, +0.18) 0.80
LDL Cholesterol (mmol·L-1) HED -0.28 (-0.64, +0.07) 0.15 0.54
ND -0.17 (-0.50, +0.17) 0.35
VLCHP -0.07 (-0.23, +0.09) 0.39
LCMP 0.05 (-0.21, +0.31) 0.71
HCLP -0.10 (-0.27, +0.07) 0.27
CON -0.23 (-0.60, +0.14) 0.27
Triglycerides (mmol·L-1) HED 0.18 (-0.09, +0.46)c 0.22 0.31
ND -0.04 (-0.31, +0.23) 0.79
VLCHP -0.11 (-0.32, +0.10) 0.30
LCMP -0.33 (-0.59, -0.06) <0.05
HCLP -0.13 (-0.30, +0.05) 0.18
CON 0.12 (-0.59, +0.33) 0.63
Insulin (pmol·L-1) HED 1.66 (-0.91, +4.24) 0.23 0.08
ND -0.45 (-1.24, +0.33) 0.28
VLCHP -1.23 (-2.15, -0.30) <0.05
LCMP -0.82 (-2.45, +0.82) 0.33
HCLP -0.10 (-0.61, +0.41) 0.69
CON 0.58 (-1.95, +3.12) 0.29
Glucose (mmol·L-1) HED -0.12 (-0.42, +0.18) 0.45 0.68
ND -0.15 (-0.32, +0.03) 0.12
VLCHP -0.24 (-0.43, -0.04) <0.05
LCMP -0.08 (-0.42, +0.26) 0.65
HCLP -0.22 (-0.35, -0.10) <0.001
CON -0.08 (-0.40, +0.25) 0.66
(HOMA-IR) HED 0.36 (-0.26, +0.97) 0.28 0.06
ND -0.12 (-0.31, +0.07) 0.23
VLCHP -0.35 (-0.58, -0.12) <0.01
LCMP -0.17 (-0.57, +0.23) 0.40
HCLP -0.06 (-0.19, +0.07) 0.38
CON 0.17 (-0.18, +0.52) 0.37
Leptin (pg·mL-1) HED -11.4 (-24.7, +2.0) 0.41 <0.01
ND -10.5 (-20.2, -0.9) <0.05
VLCHP -13.9 (-24.0, -3.9) 0.95
LCMP -28.5 (-40.5, -16.5) <0.001
HCLP -20.6 (-29.3, -12.0) <0.001
CON 24.9 (+1.1, +48.7) <0.001
Dietary intake is presented as energy (i.e. calories) intake: % carbohydrate: protein: fat. All data is presented as the mean plus the 95% confidence intervals for the delta response at week 14. Main effects for time are provided as within-group P-values. Group × time interaction effects are provided as GxT P-values. Significance level was set at 0.05.
Authors' contributions
CK: Coordinated study, assisted with data collection and analysis, completed statistical analysis and prepared man-uscript.
AT: Assisted with data collection and analysis. Coordi-nated all dietary aspects of study.
BC, LT, CW, BM, MR, EP, MG, JO: Assisted with recruit-ment, compliance, data collection and analysis.
TMC: Assisted with data collection and analysis. Coordi-nated study.
CR: Coordinator of all laboratory staff and studies. Assisted with data collection and analysis.
RW: Served as medical director and provided medical clearance for all participants.
RK: Designed study and procured grant funding. Oversaw all aspects of study and assisted with statistical analysis and preparing manuscript.
Acknowledgements
A project of this size and magnitude could not have been completed with-out the help and assistance from many more people than were allowed to appear on the author line. To all of the doctoral, masters and undergradu-ate students and administrative support that helped with all aspects of this project, thank you all for your help and the time you committed. We would also like to thank Dr. Rodney Bowden and Dr. Beth Lanning for their facil-itation and assistance of the quality of life and body image data. In addition, the authors would like to thank Joel Cramer for his statistical assistance through the revision process.
References
1. Wilborn C, Beckham J, Campbell B, Harvey T, Galbreath M, La Bounty P, Nassar E, Wismann J, Kreider R: Obesity: Prevalence, Theories, Medical Consequences, Management, and Research Directions. Journal of the International Society of Sports Nutrition 2005, 2:4-31.
2. Freedman DS, Khan LK, Serdula MK, Galuska DA, Dietz WH:
Trends and correlates of class 3 obesity in the United States from 1990 through 2000. Jama 2002, 288:1758-1761.
3. Volek JS, Gomez AL, Love DM, Weyers AM, Hesslink R Jr, Wise JA, Kraemer WJ: Effects of an 8-week weight-loss program on car-diovascular disease risk factors and regional body composi-tion. Eur J Clin Nutr 2002, 56:585-592.
4. Fox AA, Thompson JL, Butterfield GE, Gylfadottir U, Moynihan S, Spiller G: Effects of diet and exercise on common cardiovas-cular disease risk factors in moderately obese older women.
Am J Clin Nutr 1996, 63:225-233.
5. Svendsen OL, Hassager C, Christiansen C: Effect of an energy-restrictive diet, with or without exercise, on lean tissue mass, resting metabolic rate, cardiovascular risk factors, and bone in overweight postmenopausal women. Am J Med 1993,
95:131-140.
6. Larson-Meyer DE, Heilbronn LK, Redman LM, Newcomer BR, Frisard MI, Anton S, Smith SR, Alfonso A, Ravussin E: Effect of calorie restriction with or without exercise on insulin sensitivity, beta-cell function, fat cell size, and ectopic lipid in over-weight subjects. Diabetes Care 2006, 29:1337-1344.
7. Ross R, Janssen I, Dawson J, Kungl AM, Kuk JL, Wong SL, Nguyen-Duy TB, Lee S, Kilpatrick K, Hudson R: Exercise-induced reduction in
obesity and insulin resistance in women: a randomized con-trolled trial. Obes Res 2004, 12:789-798.
8. Stiegler P, Cunliffe A: The role of diet and exercise for the main-tenance of fat-free mass and resting metabolic rate during weight loss. Sports Med 2006, 36:239-262.
9. Luscombe-Marsh ND, Noakes M, Wittert GA, Keogh JB, Foster P, Clifton PM: Carbohydrate-restricted diets high in either monounsaturated fat or protein are equally effective at pro-moting fat loss and improving blood lipids. Am J Clin Nutr 2005,
81:762-772.
10. Brinkworth GD, Noakes M, Keogh JB, Luscombe ND, Wittert GA, Clifton PM: Long-term effects of a high-protein, low-carbohy-drate diet on weight control and cardiovascular risk markers in obese hyperinsulinemic subjects. Int J Obes Relat Metab Disord
2004, 28:661-670.
11. Keogh JB, Luscombe-Marsh ND, Noakes M, Wittert GA, Clifton PM:
Long-term weight maintenance and cardiovascular risk fac-tors are not different following weight loss on carbohydrate-restricted diets high in either monounsaturated fat or pro-tein in obese hyperinsulinaemic men and women. Br J Nutr
2007, 97:405-410.
12. Layman DK, Evans E, Baum JI, Seyler J, Erickson DJ, Boileau RA: Die-tary protein and exercise have additive effects on body com-position during weight loss in adult women. J Nutr 2005,
135:1903-1910.
13. Meckling KA, Sherfey R: A randomized trial of a hypocaloric high-protein diet, with and without exercise, on weight loss, fitness, and markers of the Metabolic Syndrome in over-weight and obese women. Appl Physiol Nutr Metab 2007,
32:743-752.
14. Farnsworth E, Luscombe ND, Noakes M, Wittert G, Argyiou E, Clifton PM: Effect of a high-protein, energy-restricted diet on body composition, glycemic control, and lipid concentra-tions in overweight and obese hyperinsulinemic men and women. Am J Clin Nutr 2003, 78:31-39.
15. Layman DK, Boileau RA, Erickson DJ, Painter JE, Shiue H, Sather C, Christou DD: A reduced ratio of dietary carbohydrate to pro-tein improves body composition and blood lipid profiles dur-ing weight loss in adult women. J Nutr 2003, 133:411-417. 16. Noakes M, Keogh JB, Foster PR, Clifton PM: Effect of an
energy-restricted, high-protein, low-fat diet relative to a conven-tional high-carbohydrate, low-fat diet on weight loss, body composition, nutritional status, and markers of cardiovascu-lar health in obese women. Am J Clin Nutr 2005, 81:1298-1306. 17. Curves: Curves for Women: Company Fact Sheet 2008
[http://www.curves.com]. on November 15, 2008
18. Kreider RB, Rasmussen C, Culbertson J, Byrd M: Effects of a 30-Day Fitness Challenge on Body Composition and Markers of Health in Women. American College of Sports Medicine Annual Meet-ing. Seattle, WA 2008.
19. Heavin G, Colman C: Curves: Permanent results without pern-anent dieting. New York, NY, G. P. Putnam's Sons; 2003. 20. McClave SA, Snider HL: Understanding the metabolic response
to critical illness: factors that cause patients to deviate from the expected pattern of hypermetabolism. New Horiz 1994,
2:139-146.
21. ACSM: ACSM's Guidelines for Exercise Testing and Prescrip-tion. 6th edition. Philadelphia, PA, Lippincott Williams & Wilkins; 2000.
22. Long CL, Schaffel N, Geiger JW, Schiller WR, Blakemore WS: Meta-bolic response to injury and illness: estimation of energy and protein needs from indirect calorimetry and nitrogen bal-ance. JPEN J Parenter Enteral Nutr 1979, 3:452-456.
23. Knox LS, Crosby LO, Feurer ID, Buzby GP, Miller CL, Mullen JL:
Energy expenditure in malnourished cancer patients. Ann Surg 1983, 197:152-162.