ORIGINAL ARTICLE
Twitter data analysis as contribution to strategic foresight-The
case of the EU Research Project
B
Foresight and Modelling
for European Health Policy and Regulations
^
(FRESHER)
André Uhl1 &Nina Kolleck2&Edgar Schiebel3
Received: 23 October 2016 / Accepted: 21 November 2016 / Published online: 8 December 2016 #The Author(s) 2016. This article is published with open access at Springerlink.com
Abstract In this article the value of Twitter data analysis for a strategic foresight exercise is discussed. The article offers an overview of Twitter’s basic functionalities, previous Twitter research and related studies on using Twitter in foresight pro-jects to date. Based on this knowledge the case of the EU research project BForesight and Modelling for European Health Policy and RegulationsB(FRESHER) is used to con-duct a Twitter data analysis in three steps: an analysis of web-links to get insights into the content spread via Twitter, a social network analysis to define central actors in a Twitter debate, and a hashtag-analysis to find out which topics are discussed a n d t o s u p p o r t t h e i d e n t i f i c a t i o n o f d r i v e r s o f noncommunicable diseases. The article shows the benefit a Twitter data analysis provides for the FRESHER project and reveals implications for future research in this field.
Keywords Foresight . Twitter . Horizon scanning . Network analysis . Policy . Governance
Introduction
Online social media platforms such as Twitter, Facebook or Youtube cover a big share of the world wide digital commu-nication today. Different software tools allow the gathering of information about users and the collection of data about their communication behavior. Especially the microblog Twitter provides manifold opportunities in data analysis thanks to its functionality and the availability of appropriate software. Despite these opportunities and a wide range of studies about the use of Twitter for different disciplines, the analysis of Twitter data and its contextualization within the scope of Foresight projects is rarely discussed in scientific literature. Therefore the author of this article asks: Can a Twitter data analysis contribute valuable input to a strategic Foresight exercise?
In order to answer this question the case of the EU research projectBForesight and Modelling for European Health Policy and RegulationsBis used,1which is part of the EU research and innovation program Horizon 2020.2An international consor-tium of ten European research institutes conducts this project by applying a cross-disciplinary approach. The objective of FRESHER is to explore alternative futures for the European health sector in order to test the efficiency of different options to tackle the burden of non-communicable diseases (NCDs). The study presented in this article examines whether Twitter data analysis can contribute valuable results to:
– the gathering of relevant information around the theme,
– the search for contacts and possible participants for work-shops or interviews,
1http://www.foresight-fresher.eu.
2The EU Framework Programme for Research and Innovation:http://ec.
europa.eu/programmes/horizon2020/. * André Uhl
Nina Kolleck [email protected]
Edgar Schiebel [email protected]
1 Böckhstraße 49, D-10967 Berlin, Germany
2
Habelschwerdter Allee 45, D-14195 Berlin, Germany
3 Donau-City-Straße 1, A-1220 Vienna, Austria
– the identification of drivers with potential impact on the development of NCDs in the future.
The article is structured as follows: Subsequent to the in-troduction the main characteristics and functionalities of Twitter are described, an overview of previous Twitter re-search is provided and possible opportunities emerging with the use of Twitter for strategic Foresight are shown. Then the FRESHER research project is briefly described and possible points of action for a Twitter data analysis within this project are shown. Based on this the methodological approach of the study is explained, followed by the presentation of the find-ings. Finally, the results are discussed, a conclusion is drawn and possible implications for future work in this research area are revealed.
Development, characteristics and user
What is twitter?
Twitter was created in March 2006 under its original name
BTwttr^. Since co-founder Jack Dorsey posted the first mes-sage (Bjust setting up my twttr^) Twitter has developed to the most used and known microblogging platform and one of the most popular online social networking services. At the begin-ning of 2010 the site had 20 million unique users and 50 million messages per day. By March 2015 these numbers had grown to 302 million unique users and 500 million mes-sages, better known as tweets, were being sent.3Today, the platform can be regarded as aB…communication phenome-non whose reach is still growing and whose consequences are far from understoodB[30].
Like other microblogs Twitter can be described by the fol-lowing five key characteristics [12]: (1) a concept of shortness, due to the limitation of 140 characters for each post (hence the namemicroblog), (2) a concept of friends (the various ac-counts a user follows) and followers (the acac-counts that follow a user), (3) a concept of information presentation, where mes-sages of friends are presented in a list with the most recent at the top, (4) a concept of openness (users can set their profiles to private, but that is rather unusual; almost all posts on Twitter are public), and (5) a concept of web services, meaning that Twitter allows third-party applications to connect with the service using an open application programming interface (API). This open APIBprovides a mechanism to make use of the functionality of a set of modules without having access to the source code or a specific licenseB[2] and is therefore crucial in order to conduct a Twitter data analysis by any
means. In view of these characteristics, a microblog, with Twitter being its most prominent representative, can be c l a s s e d a s a s e r v i c e f o r a c o m p l e t e n e w w a y o f communication.
How does twitter work?
Besides the basic function of posting a Twitter message (called
Btweet^), and the possibility to follow and be followed by other users, Twitter provides several other specific features. Three of these are Breplies^,Bmentions^ and Bretweets^. Replying to a user by starting a tweet with an @ sign followed by the user name (@user) makes it possible to address a user directly via the public Twitter feed. To mention another user, works in a similar way; it also includes@userbut not at the beginning of a tweet. The difference is that a reply is directed to the other user and therefore seen by him or her, while a mention is not directed at the user. You could also say a reply is a messageforsomeone while a mention is a messageabout
someone [20]. By using the retweet function a user spreads the original message from another user by resending it. While mentioning is a way of referring to another user without nec-essarily sharing the same opinion, a retweet can be seen as an informal recommendation of a message that another user finds important, interesting or at least entertaining. Therefore the retweet function is a key mechanism for information diffusion and raising content visibility on Twitter [36,47].
Another key function of Twitter is the use ofBhashtags^. Putting aB#^(hash) sign in front of a certain word is a simple way of adding context to a message. This can be a name (e.g.
#obama), an event (e.g. #election2016), a movement (# r e f u g e e s w e l c o m e) , a c o n f e r e n c e ( e . g .
#futuresconference2015) or anything else. By adding a hashtag to a Tweet, the referred word receives the informal function of a topic. Thus, hashtags are helpful when sharing news, knowledge or general contributions to a certain topic, and to spread information across networks of interest. Conversely, hashtags make it easy to search and collate infor-mation, discussions or central actors regarding a specific theme [10,37]. Also, hashtags can be especially useful when Twitter is used as a communication platform, for example during a conference to share ideas, impressions, comments and additional materials on aB#channelB[11].
While each tweet can be retweeted, be addressed to other users by replies, or relate to specific context by a hashtag, information spreading on Twitter can also work in other ways: Tweets can additionally contain photos, videos with a maxi-mum length of six seconds or additional web links. The latter is particularly interesting for Foresight practitioners who want to use Twitter as a data source, since they might refer for example to news articles, studies, or reports relevant to the theme under investigation.
3
Who uses twitter and why?
With the growing popularity of Twitter, not only has theBdaily chatter^, as Java et al. [28] describe it, increased but also the service’s potential as a fast information distribution platform, as a tool for coordination in disaster control/response, or as an instrument for political campaigns [30]. By the time Twitter reacted to the predominant way people used the platform and changed its initial question in 2010 fromBWhat are you doing?^ toBWhat’s happening?^ focusing on ongoing news and events. Other changes Twitter made in reaction to the user behavior are even more remarkable: Both retweets and hashtags were first initiated by users without having a formal function to use it; this was a matter of self-initiative in order to spread information or add context to a message. Twitter later implemented these features formally, which are now two of the services’most important functions [22].
A study from Smith and Brenner [42] gives some hints on what aBtypical Twitter user^in the United States might look like. Although the results might be different considering a European sample it seems plausible to assume at least a sim-ilar demographic tendency. According to the results of the study most of the Twitter users are younger, with a higher education, more affluent showing a bigger political interest than the average. It is therefore important to note that a Twitter data analysis cannot be seen as a representative sample of a population. Such data can only provide insights in the online communication of the part of the population using this specific online service. This does not necessarily make such data less important or less interesting for social scientists or Foresight practitioners. In fact, focusing on a group that shows a relatively high level of involvement and interest in societal issues [29] might be fruitful depending on the specific topic of research.
Twitter research
Since Java et al. [24] published their paperBWhy we twitter: understanding microblogging usage and communitiesB, one of the first studies on Twitter finished in the same year the service was launched, a growing number of studies on Twitter research has been published. According to a bibliometric anal-ysis from Kayser and Bierwisch [31] examining the different research areas from the year 2006 until 2014 (articles and proceeding papers), the fields BComputer Science^ and
BEngineering^ show the highest activity in Twitter research while other disciplines like BBusiness and Economics^,
BCommunication^,BEducation^,BPsychology^ and BSocial Sciences^ also show a noteworthy number of contributions. However, the boundaries of the different research areas are not always as clear since some of the studies follow an interdisci-plinary approach, while others use case studies from a certain discipline to make a point. Some studies from different
disciplines that received attention in the scientific community shall be mentioned in the following.
From the beginning of Twitter research a significant number of studies examined the use of Twitter in a political context. While some try to grasp the role of the microblog in political protest movements [30,38], others try to yield insights into political opinions via semantic structures in Tweets [41], by sentiment analysis [21] or through a mixed-method approach of social network analysis and keyword analysis [23]. However, expectations that Twitter might work as a tool to predict electoral results could not be fulfilled since Twitter users are neither a representative sample of the population [40] nor do tweets necessarily reflect real life electoral behavior [26].
Jungherr and Jürgens [25] also discuss the potential of forecasts based on Twitter data. Instead of aiming to predict events by identifying typical data patterns they suggest to model theBnormal state^ of a system. Differences between this model and empirical data should then work as an indicator for the occurrence of extraordinary events. Other studies cover geographic aspects of Twitter use [14], examine the influence of distance, national boundaries or language on Twitter’s so-cial ties [45], or focus on the use of Twitter as a tool for educational purposes [18,19] and as communication tool at scientific conferences [10,11,13,37].
Some follow a rather broad approach, analyzing how com-munication flow on Twitter works in general. Unsurprisingly, such studies were often conducted in the field ofBComputer Science^. Castillo et al. for example focus in their studies on the analysis of newsworthy information [6] and later on infor-mation credibility [7] on Twitter to establish an automatic discovery process of relevant and credible news. Weitzel et al. [47] have a similar goal utilizing social network analysis to assess reputation from source information in the medical domain. They tested a method to rank trustworthy sources on the basis of a retweet network and concluded, that in the Twitter community trust plays an important role in spreading information. Li et al. [29] also reveal the efficiency of infor-mation diffusion on Twitter and the specific user behavior leading to such information diffusion.
Unlike numerous attempts at using Twitter for forecasting or theBprediction^of the future (e.g. electoral results, product sales or stock markets developments), which have been controversial-ly discussed [15,30,40], there have only been few attempts to examine the use of Twitter in the field of Foresight and futures research. In the following the author takes a closer look at some related studies on Twitter and Foresight. Thereafter it is tried to identify opportunities where Twitter may be used as an instru-ment for strategic and participative Foresight.
Twitter and foresight
efforts to apply the online platform for different purposes so far. For example Pang [34] presents an approach he calls
Bsocial scanning^whereby he aggregates online content from futurists and Foresight practitioners. This process of gathering and filtering content from Twitter and other social media plat-forms shall help to identify trends andBweak signals^ for possible future developments. One could criticize the ap-proach for drawing exclusively on content from futurists, which might already be shaped by pre-assumptions these per-sons have about the future.
Amanatidou et al. [1] implement Twitter into a horizon scanning framework for the European projectBScanning for Emerging Science and Technology Issues^ (SESTI). While the authors use the platform mainly for collecting web-links they also emphasize Twitter’s potential for detecting Bweak signals^ as well as the opportunity to use the microblog as communication instrument during a Foresight process. However, the comprehensive horizon scanning framework was the focal point of the study. Twitter was one information source amongst many and in this regard used as an additional element to complement the framework. Schatzmann et al. [39] give an overview of methods in a field they define as
BForesight 2.0^. They discuss the aptitude of Twitter and other web 2.0 applications for foresight exercises and outline a pos-sible evaluation process of digital applications by their intended use, knowledge generation and quality of results.
Raford [35] explores the role online services like Twitter could play in scenario planning. He thus compares five em-pirical case studies. Like Amanatidou et al. Raford empha-sizes both the potential Twitter holds for a horizon scanning process and the opportunities it could offer in communication and in promoting a public dialog. He points out that research communities exploring online data are still largely separated from scenario planning and public engagement, and argues for the potential value of real-time online systems and the inter-action with other instruments in a scenario process.
One of the first studies focusing exclusively on the use of Twitter in Foresight comes from Kayser and Bierwisch [31], asking how the online service can be used as an integral part in technology foresight. The authors examine the potential of Twitter as a tool for monitoring an ongoing debate on the
Bquantified self^phenomena, but also tests Twitter’s aptitude as a tool for engagement in a foresight exercise. Some of the main assets of Twitter emphasized by the authors are the broad variety of content delivery, the fast access to a large number of people and the possibility to receive real-time feedback on ideas. They suggest working with a mixed methods approach instead of using Twitter as the only data source for a Foresight project.
The study in this article builds on the attempts and insights described in the previous studies. Likewise, the author sees great potential of Twitter as an additional instrument in differ-ent phases of strategic Foresight exercises. There are several
perspectives in the literature of how many phases of Foresight should be classified and how to differentiate these phases [3,
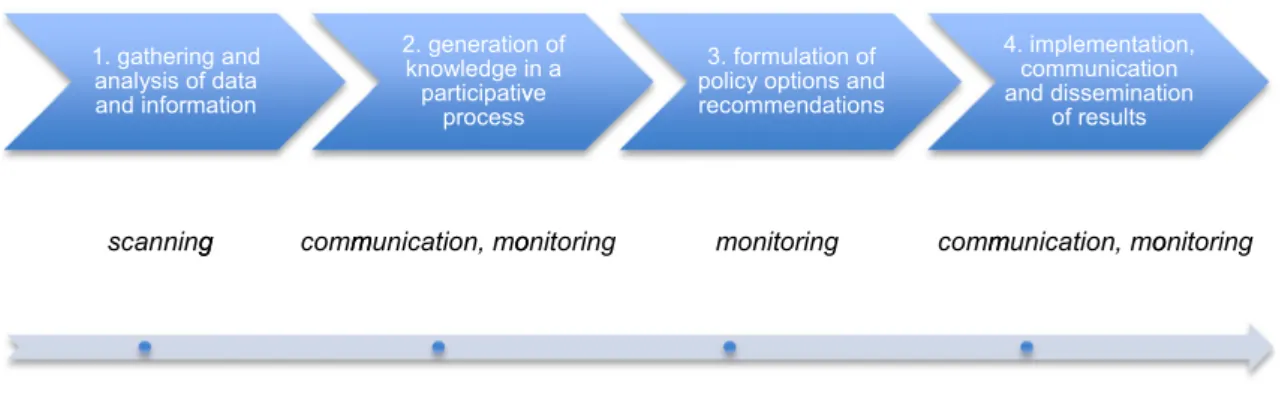
8, 22]. The author of this article distinguishes four main phases of a strategic Foresight [16]: (1) Gathering and analysis of information and data, including desk research and horizon scanning, (2) generating knowledge through a participative process, usually in the form of alternative future scenarios, (3) formulating options and handing over of policy recom-mendations, and (4) implementation, communication and dis-semination of results. The previous studies and the way Twitter works as an online communication service speak for Twitter as a useful instrument at all phases: As a tool for data analysis and information scanning at the beginning of a Foresight, as communication tool during the phase of knowl-edge generation, and at the end for result dissemination. Furthermore it could serve as a tool for continuous monitoring on a topic over the whole Foresight process (see Fig.1).
In this article the author concentrates on the beginning of a Foresight project. In almost every case such a project starts with desk research and the gathering of information in order to capture the status quo of a topic. Other important tasks are the identification of potential stakeholders, the search for partici-pants of workshops or interviews, or the identification of key determinants and drivers affecting the research topic funda-mentally. Foresight practitioners are usually confronted with an information gap on the topic under debate. Thus it is nec-essary to apply varying methods to fill this gap as good as possible. It is assumed that a Twitter data analysis based on a certain hashtag can aid work on this task and broaden the information base at the beginning of a Foresight project. In order to test our assumption the case study of the EU research projectBForesight and Modelling for European Health Policy and Regulation^(FRESHER) is used, which is described in the following chapter.
Foresight and modelling for European Health Policy
and Regulations (FRESHER)
Structure, objectives and approach
Today non-communicable diseases (NCDs) such as heart dis-ease, stroke, cancer, diabetes, depression, and others are the leading cause of mortality in Europe.4Common risk factors of the major NCDs include tobacco, harmful use of alcohol, un-healthy diet, insufficient physical activity, obesity, raised blood pressure, raised blood sugar and raised cholesterol. While the number of people afflicted by NCDs is increasing and the burden is growing, the WHO underlines that a great part of the NCDs threat can be overcome by using existing knowledge, and possible solutions are highly cost-effective.
4
The research project BForesight and Modelling for European Health Policy and Regulations^ (FRESHER)5 draws on this knowledge to support the search for appropriate solutions. A consortium of ten international European re-search institutes and partners from eight different countries conduct FRESHER. It runs over a time period of three years from the beginning of 2015 until the end of 2017. The project is part of the EU research framework program Horizon 2020 and financed by the European Union Funding for Research & Innovation. According to the FRESHER Funding Frame (un-published proposal) the overall project objective is to outline alternative futures using emerging health scenarios to test fu-ture policies to effectively tackle the burden of NCDs. Intermediary goals of the project are:
1. To produce quantitative estimates of the future burden (horizon 2030 and 2050) of NCDs in the EU and its im-pact on health care expenditures and delivery, population well-being, health and socio-economic inequalities.
2. To base such estimates on Foresight techniques giving credit to the interdependencies of structural long-term trends in gender relations, demographic, technological, economic, environmental, and societal factors (horizon 2050).
3. To illustrate options for decision-makers in order to con-tain the burden of NCDs.
4. To promote an interactive process with key actors in pub-lic health and European popub-licies.
Following these goals the FRESHER project shall contrib-ute to a better understanding of causal chains and risk factors of NCDs. This shall provide decision-makers withBtimely, accurate information to consolidate the scientific knowledge on the effectiveness of policy interventions.^6The project will also form an active network for effective policy dialogue with
major stakeholders of public health policies in Europe and give recommendations on research priorities to reduce the impact of NCDs in Europe.
Horizon scanning and twitter data analysis
Two core elements of the FRESHER Foresight process are the implementation of a horizon scanning process and the devel-opment of future health scenarios built on the results of the horizon scanning. Horizon scanning can be described as a practice integrated in the first phase of Foresight exploring trends, drivers, and challenges but also past experiences to identify topics and factors that might influence the theme un-der investigation in the future [32]. Delaney gives an overview of existing definitions of horizon scanning, and most of them closely resemble the goal-oriented description above [9].
Apart from this rather broad explanation of what a horizon scanning should lead to, there is no common understanding in foresight literature of how to process horizon scanning in de-tail, which methods should be used or which steps to be in-cluded in such a process. Some scholars underline the oppor-tunities of automated or semi-automated horizon scanning processes, while using different software-supported and often self-developed infrastructure to process information [17,33,
44]. Amanatidou et al. [1] describe their experiences from the European horizon scanning projectBScanning for Emerging Science and Technology Issues^(SESTI) which uses different scanning approaches and scanning tools to improve policy formulation and dialogue. Also, a number of governments operate national horizon scanning centres and have developed their own framework processing information from numerous sources in order to prepare for future challenges.7
In the FRESHER project the term horizon scanning is used in a comparatively broad way, meaning a general scanning of
5
http://www.foresight-fresher.eu. 6
http://www.foresight-fresher.eu/en/Who-we-are/Mission-Statement/.
7s e e G ov e r nm e nt o f t h e U ni t e d K i ng d om : h t t p s : / / w w w. g o v. uk/government/groups/horizon-scanning-programme-team, RAHS Programme Office:http://www.rahs.gov.sg/public/www/home.aspx, and [43].
scanning 1. gathering and analysis of data and information
g comm
Potential use of Twitter during the phases Four phases of foresight
munication, mo 2. generation of
knowledge in a participativ
process
onitoring ve
monitoring 3. formulation of policy options and recommendations
commmunication, mo
4. implementation, communication and dissemination
of results
onitoring
different sources like scientific literature, conferences, Foresight projects, online sources etc. without drawing on an existing horizon scanning framework. One key mechanism to identify determinants, trends and drivers in the context of NCDs is a semi-automated bibliometric analysis of scientific literature. Another important element is the discussion of the results with an expert committee and in further expert inter-views. These interviews shall also help to explore which pol-icies could address future challenges on NCDs.
The approach sets out from a holistic understanding of the health and well-being sector. Social factors such as family and networks influence health and well-being just as well as eco-nomic factors such as the standard of living, environmental factors such as pollution and climate change, and also the safe and secure surrounding in which a person lives. Therefore the horizon scanning looks also at the external factors that lie outside a narrow definition of the health system. The results of the scanning process lay basis for of the scenario building later on.
The aim of this study is to examine whether a particular hashtag on Twitter might serve as a valuable search tool to find relevant information on the topic of NCDs, to identify experts in the field of NCDs, and as an instrument to comple-ment the identification of determinants and drivers for NCDs. Therefore the following three research questions are formulated:
RQ1: Do messages with the hashtag #ncds contain the-matically relevant web-links?
RQ2: Can central actors of a Twitter network around the hashtag #ncds be regarded as useful contacts for the foresight project?
RQ3: Do Tweets with the hashtag #ncds contain other hashtags representing determinants and drivers of non-communicable diseases?
In the following the methodological approach is described, the findings are presented and discussed, and possible indica-tions for more research in the future are shown.
Study
Methodological approach
Every time users interact with online services they leave data traces, documenting their online behavior. While most of these traces are invisible to researchers, Twitter offers access to comprehensive data sets through its open application pro-gramming interface [25]. Beside the actual Twitter message much other information is available, e.g. the number of fol-lowers of a user, the number of his or herBfriends^, or the profile description. Furthermore a set of metadata is accessible
such as geographical data (in case the Twitter user specifies his or her geographical location), the exact time a tweet was sent or the user ID. All in all, Twitter offers a publicly available, comprehensive and in large parts spatially embedded network dataset, which can be of great value for researchers [45].
Not so long ago the aggregation, analysis and illustration of data from social media platforms such as Twitter demanded significant programming and advanced data management skills [20]. Today different software applications deliver pre-structured data sets by connecting to the Twitter application programming interface. This enables researchers to concen-trate mainly on measurement, analysis and interpretation of data, instead of spending time with coding or mastering an appropriate research tool. For this study the program NodeXL was used. The software runs on Windows operating system and is an add-on for the program Microsoft Excel, where it is virtually integrated as an additional tab while all other Excel functions can still be used for the dataset.
By using the import function for Twitter data NodeXL provides search results as structured network information in different spreadsheets. The BEdges^ spreadsheet (relation-ships between Twitter users are represented as network edges) includes information on messages sent within this network, while theBVertices^spreadsheet (Twitter users are represented as network vertices) includes information on each user within this network. The search is limited to a maximum amount of 18.000 tweets and also to a time period seven days back from the present. If more data is required a regular search has to be done over a longer time period.
For the study a Twitter network is examined, consisting of all users who include the hashtag#ncdsin their Tweets or who are mentioned in such a Tweet from July 5th to September 7th, 2015. Tweets containing the hashtag#ncdsare imported every week within this time period. The decision to focus the search on a hashtag instead of a keyword was made because of the specific function of hashtags as described earlier in chapter 2.1. Concentrating on a hashtag makes it easier to capture messages on a specific theme. When a user decides to include a hashtag in his/her tweet he/she adds context to the message and in this regard contributes consciously to a public (Twitter) dialogue on a certain theme. The author’s goal was to aggre-gate tweets and information about users who deliberately take part at a public dialogue by using a certain hashtag.
debate on non-communicable diseases, tweets containing dif-ferent hashtags (#ncd, #ncds, #noncommunicable,
#noncommunicablediseases) were imported over a time peri-od of two months. Based on the number of tweets and a spot check of the content#ncdswas identified as the most common hashtag in this context; thus it was decided to focus on this search term.
In every Twitter data analysis the question of how to deal with retweets must be answered. There can be different ways how to interpret retweets depending on the research question and the goal of investigation [26,27]. In this study the author wants to examine which web-links are shared the most, which users get the most attention and which hashtags are dominant in the Twitter debate of NCDs. Retweets are interpreted as contributing elements to this debate with the same importance asBoriginal^tweets. Therefore it was decided to give all mes-sages in the network the same attention, no matter if they are
Boriginal^tweets or retweets.
The study in three steps
The study is divided into three major steps:
1. In the first step web-links included in the tweets of the dataset are examined. The total number of web-links is counted and the ten most shared links in the network are checked more precisely regarding the included informa-tion. These web-links are then categorized in terms of the character of the included information, for example news, reports, scientific studies, or advertisement/public rela-tion. This allows an assessment whether the shared links can be seen as a valuable contribution to the Foresight exercise or not, and whether these links help to broaden the information base or not. On this basis RQ1 is an-swered:Do messages with the hashtag #ncds contain the-matically relevant web-links?Furthermore the examina-tion of web-links provides a first overview of the topics dominating the debate on NCDs on Twitter within this time period.
2. In the second step of our study a social network analysis of Twitter users in the dataset is conducted. This builds the basis for answeringRQ2: Can central actors of a Twitter network around the hashtag #ncds be regarded as useful contacts for the Foresight project?The Vertices represent all Twitter users within this network. This implies users who include the hashtag #ncds in their tweet as well as users who are mentioned in a Tweet which includes #ncds. Edges represent relationships of Twitter users within this network. The Twitter API provides three types of relationships/messages: (1)„TweetsB, meaning a user has tweeted without mentioning another user, represented by a self-loop. (2)BReplies to^, meaning a user replies to another user by mentioning him or her at the beginning of
the tweet. (3)BMentions^, meaning a user mentions an-other user within the tweet. BMentions^ also include retweets, as NodeXL classifies retweets as a certain form of mentions.
In this approach such Twitter users are defined as central users, who receive the most attention within the network. The level of attention is measured in two ways: the number of followers a users has in general (indirect attention) and the number of mentions (including retweets) and replies a user has in the network (direct attention) represented by the in-degree, meaning the number of edges going to a vertex in a directed graph [46]. Based on the network analysis a list of users with the highest number of followers is compiled, and another list of users with the highest in-degree, both represent-ed through a network graph. These Twitter users are then checked for further information through their Twitter profile description and a manual Google search. The results of the network analysis allow to make an assessment about users dominating the discussion on Twitter and also who should be considered for interviews, workshops or as a general con-tact for the FRESHER project.
3. In the third and final step of the study the hashtags includ-ed in tweets from the network are analyzinclud-ed. This aims to answerRQ3: Do Tweets with the hashtag #ncds contain other hashtags representing determinants and drivers of non-communicable diseases? In order to answer this question the hashtags are compared to a list of determi-nants and drivers of NCDs, identified on the basis of the bibliometric analysis of scientific articles that was con-ducted within the horizon scanning process of the FRESHER project, and based on the feedback of the ex-pert committee. Furthermore it is examined which hashtags are most frequently mentioned. In addition to the examination of the web-links this helps answer the overall question of which topics dominate the Twitter de-bate on NCDs within the defined time period.
Findings
For this study data were imported from the Twitter search network with the search term #ncds every week from July 11th, 2015 over a time period of eight weeks to September 7th, 2015. The received dataset contains Twitter data from July 4th, 2015, 04:51 pm, to September 7th, 2015, 09:03 am, with a total number of 3.656 Twitter messages. 5.088 edges represent the total number of relationships in the network:„TweetsB(759 edges),BReplies to^(50 edges), and BMentions^ (4.278 edges). As described previously,
the following the termBedges^ is used when describing all three types of relationships in the dataset.
Step 1: analysis of web-links
The dataset contains 820 different web-links that are spread via 3.694 edges within the network. Table1 shows the website headers of the ten web-links with the highest counts. The most shared link leads to the website of the CDC Centers for Disease Control and Prevention (the American health protection agen-cy), more precisely to the web page featuring the current CDC newsletter. The second most shared link leads directly to this newsletter in PDF format, followed by a web-link that leads to a news article onBarbados Today about a new tax on sugary drinks. This tax was introduced in Barbados on August 1stto reach lower sugar consumption, a political instrument that was discussed in other countries, too. The 4thlink leads to the website of a company offering services to support health pro-fessionals and patients with exercises and the management on NCDs. The 5thweb-link leads to a BBC news article also con-tributing to the discussion on tax on sweet drinks, while the 6th leads to a report of the British Medical Association on promot-ing healthy diets among children and young people, released in July 2015. The 7thleads to a scientific article in PLOS Medicine Journal on the global spread and disparity of NCDs, the 8thto an article about challenges in the tackling of NCDs on the website of the Clinton Foundation, and the 9th to an article about financing the fight against NCDs on the website of DEVEX, a media platform for global development. The last of the ten web-links leads to Innovation Countdown 2030, an initiative to identify, evaluate, and showcase technologies and interventions to transform global health by 2030. The initiative
is supported by the Norwegian Agency for Development Cooperation, the Bill & Melinda Gates Foundation, and the US Agency for International Development.
Three of these top ten links can be classified as reports of governmental initiatives (1, 2 and 6), three are reports or arti-cles of non-governmental organizations and private initiatives (8, 9, 10), two articles from genuine news websites (3, 5), one article from a scientific journal (7) and another one leads to a commercial website (4). Most of them contain more links to further information such as news around NCDs (5, 6, 9), sci-entific articles or studies (1, 2, 6, 7, 8) or contacts to profes-sionals in different fields of NCDs (1, 2, 4, 6, 7, 10). In fact, the web-link leading to the report of the initiative Innovation Countdown 2030 provides a collection of information with a close connection to the overall goal of the FRESHER project: the identifications of technologies and interventions that can be seen as possible drivers to shape global health by 2030. In summary, and as an answer toRQ1, it can be said that the top ten web-links contain up-to-date information on the thematic complex of NCDs and contribute valuable insights to the scanning process of the FRESHER project.
Step 2: identification of central actors
In a second step central actors within the network are identi-fied. As already mentioned the network consists of Twitter users sending messages with the hashtag#ncdsor being men-tioned in such a message. Table2shows the top ten users in the network with highest number of followers. The list is clearly dominated by leading news websites and news agen-cies such as The New York Times (1), Reuters (3), Forbes (4), Mashable (5) and Washington Post (6). Other user profiles in
Table 1 Top ten web-links in the network of #ncds, source: Author’s data
No. Website header Type of source Count
1 Updates from the Field…Protecting Health and Building Capacity Globally | Division of Global Health Protection | Global Health | CDC
governmental organization report 47
2 dghp-field-updates-2015-summer.pdf governmental organization report 42
3 Tax on sweet drinks | Barbados Today news article 36
4 Store - Exercise Works! commercial website 30
5 Tax sugary drinks by 20%, say doctors - BBC News
news article 29
6 BMA - Food for thought | British Medical Association
governmental organization report 29
7 PLOS Medicine_ Noncommunicable Diseases_ A Globalization of Disparity?
science journal article 28
8 The New Frontier of Non-Communicable Diseases | Clinton Foundation
NGO/private initiative report 25
9 Sustainable development needs sustainable financing—tackling NCDs is no exception | Devex
NGO/private initiative report 23
10 Innovation Countdown 2030 | Identifying the most promising global health innovations
the list belong to the Prime Minister of India Narendra Modi (2), the President of the United States Barack Obama (9), the United Nations (7), United Nations International Children’s Emergency Fund (8), and the World Economic Forum (10). The list also shows that three of these user profiles are located in the United States, while four of them represent international organizations or media companies with headquarters in the USA. The remaining three belong to Narendra Modi in India, Reuters with headquarter in UK and the World Economic Forum with headquarter in Switzerland.
All followers of a user receive his or her tweets on their Twitter wall. If for example@nytimestweets (or retweets) a message including the hashtag#ncdsnearly 19 million users are potentially reading that message. Therefore the number of followers can be seen as a way to measure the level of atten-tion a user gets on Twitter. However, measuring the level of attention in this way leaves an important question open: Do the followers of this user reallyreadthis message or does it get lost in the vast information flow one user is confronted with when following a large number of accounts? Therefore the number of followers of a user must be regarded as a rather indirect or hypothetical level of attention.
Another way to measure the attention users receive on Twitter is to count their in-degree number within the network. The in-degree is defined by all edges in a directed graph going to a vertex (user), which can be tweets (in the form of one self-loop, no matter how many messages a user sends), mentions (mostly in the form of retweets) or replies to another user. Being mentioned in a tweet, being retweeted, or getting a reply requires active involvement of another user. If, for example, a message from@ncdallianceis being retweeted from several other users, it can be assumed that all these users have read this message and regarded it as worth to be spread. Thus, while the number of followers can be seen as a measure of indirect attention, the in-degree number can be seen as a measure for
direct attentionsupported by action.
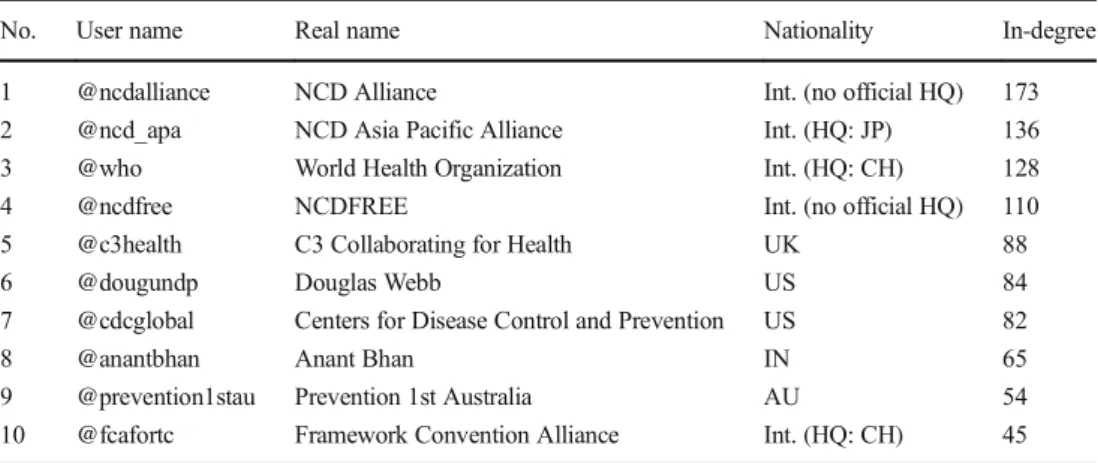
Table 3 shows the ten users with the highest in-degree number in the network. Top on the list is the account of NCD Alliance, a network of over 2.000 non-governmental organizations, followed by the account of the NCD Asia Pacific Alliance with headquarters in Japan, and the account of the World Health Organization on number 3. The other user accounts belong to NCDFREE, an international network of young professionals against NCDs, the British charity C3
Table 2 Top ten users with the highest number of followers in the network of #ncds (BHQ^stands forBheadquarter^), source: Author’s data
No. User name Real name Nationality Followers
1 @nytimes The New York Times US 18,974,524
2 @narendramodi Narendra Modi IN 14,781,807
3 @reuters Reuters Top News Int. (HQ: UK) 8,379,329
4 @forbes Forbes Int. (HQ: US) 6,566,664
5 @mashable Mashable Int. (HQ: UK, US) 5,604,947
6 @washingtonpost Washington Post US 4,725,133
7 @un United Nations Int. (HQ: US) 4,682,176
8 @unicef UNICEF Int. (HQ: US) 4,539,643
9 @potus Barack Obama US 3,870,634
10 @wef World Economic Forum Int. (HQ: CH) 2,636,423
Table 3 Top ten users with the highest in-degree in the network of #ncds (BHQ^stands for Bheadquarter^), source: Author’s data
No. User name Real name Nationality In-degree
1 @ncdalliance NCD Alliance Int. (no official HQ) 173
2 @ncd_apa NCD Asia Pacific Alliance Int. (HQ: JP) 136
3 @who World Health Organization Int. (HQ: CH) 128
4 @ncdfree NCDFREE Int. (no official HQ) 110
5 @c3health C3 Collaborating for Health UK 88
6 @dougundp Douglas Webb US 84
7 @cdcglobal Centers for Disease Control and Prevention US 82
8 @anantbhan Anant Bhan IN 65
9 @prevention1stau Prevention 1st Australia AU 54
Collaborating for Health, Douglas Webb (who is a health and development expert at United Nations Development Programme), CDC Centers for Disease Control and Prevention (the American health protection agency), Anant Bhan, Professor for bioethics and global health at Yenepoya University in Pune, India, Prevention 1st(a campaign by the Foundation for Alcohol Research and Education and the Public Health Association of Australia), and the Framework Convention Alliance for Tobacco Control. Regarding the ori-gin of the user profiles the list shows that five of them belong to international organizations, two profiles belong to users in the United States, and one belongs to the UK, India and Australia each.
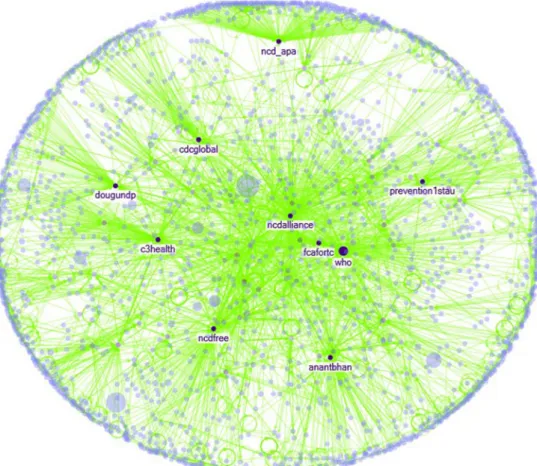
Figure2 shows a graph including all vertices in the net-work. The size of the vertices is proportional to the number of followers; the top ten users with the highest number of fol-lowers have name labels. By contrast, Fig.3shows the same graph including the network edges. Here the vertices with the highest in-degree number (user from Fig. 5) are presented in dark blue and have name labels. For a better overview all self-loop-edges are excluded. It is clear to see that all of the highlighted vertices in the second graph show a high number of edges.
Comparing both approaches, highlights that the second ap-proach is more favorable in order to identify important actors in the network. While most of the user accounts with the
highest number of followers come from mass media news sites or some of the world’s leading international organiza-tions, user profiles with the highest in-degree number mainly come from non-governmental organizations, governmental agencies or activist groups that specialize in the field of NCDs. With regard toRQ2it can be stated that it is to a certain extent useful to consider some of the central actors as experts for interviews or as general contacts for the FRESHER pro-ject. Since the FRESHER workshops focus on participants from continental Europe, the aptitude of these users as partic-ipants for the workshops is rather limited.
Step 3: hashtag analysis
In a third and final step of the study a closer look is taken at the hashtags included in the Twitter messages of the dataset. Besides the key hashtag #ncds the dataset con-tains 713 other different hashtags. 1.391 edges contain only#ncdswhile the remaining 3.698 edges also contain one or more other hashtags. Table 4 shows the top ten hashtags in the dataset. Most frequent beside #ncds are
#diabetes, #publichealth, #globalhealth, #ffd3, #obesity, #sdgs, #health, #tobacco, and #cancer. While the mean-ing of most of these terms is obvious, two of the hashtags are abbreviations (number 5 and 7) standing for the Third International Conference on Financing for Development
(#ffd3), which was held from 13th until 16th of July in Addis Ababa, Ethiopia, and the Sustainable Development Goals 2030 (#sdgs), formulated by the United Nations in 2015 to replace the Millennium Goals from the year 2000.
The word cloud in Fig.4displays all hashtags appearing 15 times or more in the tweets of the dataset. The key hashtag
#ncdswas excluded for a better overview. Color and size vary in proportion to the frequency of the hashtag terms, from bigger and dark blue for the most frequent hashtags to smaller and light blue to the less frequent ones. The highest occurring
hashtags from table4can be clearly be identified in the word could. Other frequently appearing hashtags are for example
#india, #sugar, #prevention, #physicalactivity, or
#mentalhealth. Most frequently mentioned types of NCDs in the form hashtags are diabetes, obesity, and cancer. The word cloud illustrates very well the dominating topics in the Twitter debate on NCDs during the observed time period.
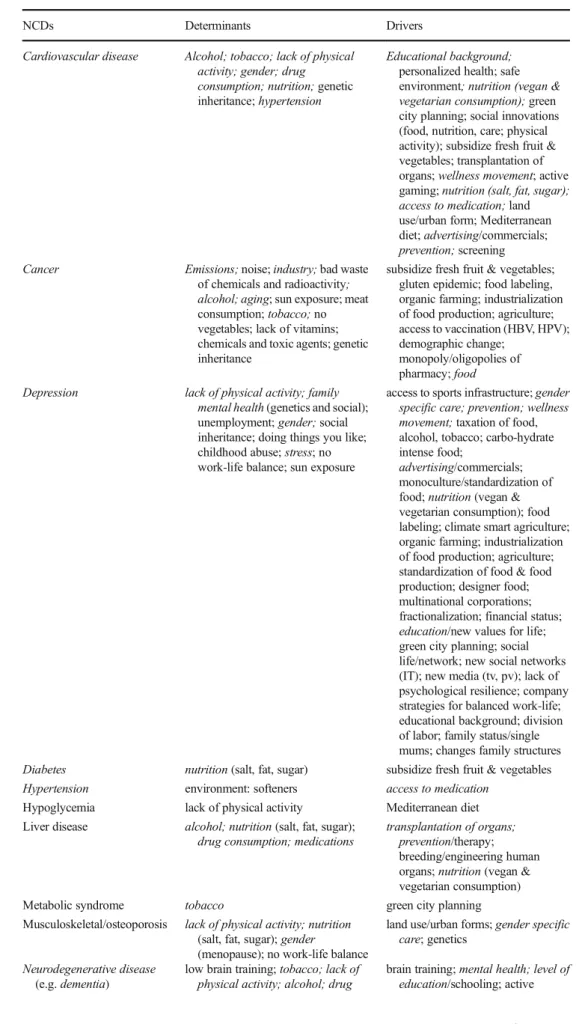
Table 5 shows different types/groups of NCDs plus corresponding determinants and drivers that have been identified previously in the FRESHER project on the ba-sis of the bibliometric analyba-sis and expert feedback. All terms showing an exact correspondence to hashtags in the dataset are marked green. All terms containing parts of hashtag terms or having a clear relation to some of the hashtags without showing an exact correspondence (e.g.
Baccess to medication^and#accesstomedicines,Black of physical activity^ and #physicalactivity, or Bwellness movement^ and #wellbeing) are marked yellow. Nine NCDs show exact correspondence with hashtags, as well as nine terms defined as determinants and six terms de-fined as drivers of NCDs. With regard to RQ3it can be said that tweets with the hashtag #ncds contain other hashtags representing some of the determinants and drivers of NCDs although by no means all of the defined determinants and drivers are included in the list of hashtags.
Fig. 3 Network actors
highlighted by in-degree number. (Graph showing all vertices and edges in the network of #ncds. Size of the vertices is proportional to the number of followers on Twitter. Top ten users with highest in-degree number have name labels.) Source: Author’s data
Table 4 Top ten hashtags in the dataset, source: Author’s data
No. Hashtag Count
1 #ncds 3656
2 #diabetes 219
3 #publichealth 177
4 #globalhealth 167
5 #ffd3 152
6 #obesity 151
7 #sdgs 147
8 #health 131
9 #tobacco 123
Discussion and conclusion
The results of the study show the value of a hashtag-based Twitter data analysis for a strategic Foresight exercise at var-ious levels. The most frequently sent web-links in the dataset lead to current and relevant information about topics closely connected to the development of NCDs. This includes actual reports of governmental, non-governmental, and non-profit organizations, recently published scientific articles as well as news and media articles. In this case Twitter can be regarded as a useful tool for gathering current information at the begin-ning of a Foresight project to complement the scanbegin-ning pro-cess, and also continuously during the ongoing Foresight ex-ercise to support the monitoring process. While concentrating on the most frequently spread web-links is a good starting point to ascertain current debates on Twitter, it can also be of interest to take a closer look at the other web-links in the dataset. Another way to filter relevant web-links could be an automatic search for previous defined keywords within the remaining links.
Furthermore our study displays the aptitude of a social network analysis around the hashtag#ncdsto identify organi-zations and actors who play a central role in the public Twitter debate on NCDs and in the information distribution on Twitter. Getting an overview of these actors is helpful when collecting contacts or searching for potential interview part-ners and workshop participants for the Foresight exercise. Besides conducting bibliometric analysis or scanning
conferences, a social network analysis can help to comple-ment the expert list with qualified contacts not only from the scientific community, but also from civil society. As a further step it could be helpful to analyze the egocentric networks around selected actors to get insights into their network ties, to observe the attention flow going from and to these actors, and to find out which other actors are closely connected.
The examination of the differing hashtags in the dataset gives an overview of the current debate on NCDs on Twitter, precisely about the other topics that have been discussed while using the hashtag #ncds. This includes for example the most frequently discussed types of NCDs on Twitter: diabetes, obesity and cancer. The study also shows that some of the hashtags correspond exactly with some of the determinants and drivers, which are defined at the beginning of the FRESHER project, while some others show an obvious relation to these determinants and drivers. What can we con-clude from this observation?
Showing exact correspondence with hashtags in the Twitter data analysis does not prove these factors to be true or more evident than others. It rather reveals that the public debate on Twitter shows in parts similarities to the ongoing debate in the scientific community, observed through the bibliometric anal-ysis and the expert interviews. And it leads to another consid-eration: Perhaps a closer look should also be taken at the hashtags used in the investigated Twitter network, which do
notshow correspondence with the defined determinants and drivers. In doing so we leave the beaten track and search for
Table 5 Types/groups of NCDs,
determinants and drivers NCDs Determinants Drivers
Cardiovascular disease Alcohol; tobacco; lack of physical activity; gender; drug consumption; nutrition;genetic inheritance;hypertension
Educational background;
personalized health; safe environment; nutrition (vegan & vegetarian consumption);green city planning; social innovations (food, nutrition, care; physical activity); subsidize fresh fruit & vegetables; transplantation of organs;wellness movement; active gaming;nutrition (salt, fat, sugar); access to medication;land use/urban form; Mediterranean diet;advertising/commercials;
prevention;screening
Cancer Emissions;noise;industry;bad waste of chemicals and radioactivity; alcohol; aging; sun exposure; meat consumption;tobacco;no vegetables; lack of vitamins; chemicals and toxic agents; genetic inheritance
subsidize fresh fruit & vegetables; gluten epidemic; food labeling, organic farming; industrialization of food production; agriculture; access to vaccination (HBV, HPV); demographic change;
monopoly/oligopolies of pharmacy;food Depression lack of physical activity; family
mental health(genetics and social); unemployment;gender;social inheritance; doing things you like; childhood abuse;stress; no work-life balance; sun exposure
access to sports infrastructure;gender specific care; prevention; wellness movement;taxation of food, alcohol, tobacco; carbo-hydrate intense food;
advertising/commercials; monoculture/standardization of food;nutrition(vegan & vegetarian consumption); food labeling; climate smart agriculture; organic farming; industrialization of food production; agriculture; standardization of food & food production; designer food; multinational corporations; fractionalization; financial status;
education/new values for life; green city planning; social life/network; new social networks (IT); new media (tv, pv); lack of psychological resilience; company strategies for balanced work-life; educational background; division of labor; family status/single mums; changes family structures
Diabetes nutrition(salt, fat, sugar) subsidize fresh fruit & vegetables
Hypertension environment: softeners access to medication
Hypoglycemia lack of physical activity Mediterranean diet Liver disease alcohol; nutrition(salt, fat, sugar);
drug consumption; medications
transplantation of organs; prevention/therapy; breeding/engineering human organs;nutrition(vegan & vegetarian consumption)
Metabolic syndrome tobacco green city planning
Musculoskeletal/osteoporosis lack of physical activity; nutrition
(salt, fat, sugar);gender
(menopause); no work-life balance
land use/urban forms;gender specific care; genetics
Neurodegenerative disease
(e.g.dementia)
low brain training;tobacco; lack of physical activity; alcohol; drug
new traces, which is often helpful when working on future scenarios.
Another argument in favor of a Twitter data analysis to complement the scanning process of a Foresight exercise is the relatively short amount of time in which such an analysis can be done. While the analysis demands good preparation to meet the purpose of each specific Foresight (e.g. adjust the focus of the data analysis, defining the appropriate hashtags etc.), the analysis itself can be done within a couple of days, or, depending on the goals of the analysis, even hours, due to its semi-automated nature. This enables Foresight practi-tioners to get valuable insights into a public debate while keeping the additional input of resources on a small level.
A limitation of the study is the time frame of two months as a basis for data retrieval. All statements and assumptions re-garding shared content, network actors, or hashtags only apply to the time from July 5thto September 7th. Longer time periods or another time frame might have led to different results. It is therefore obvious that this Twitter data analysis can comple-ment but not substitute the bibliometric analysis of scientific articles, which in contrast examines a debate in a scientific community over a relatively long time period. Also, the lim-ited time frame makes it impossible to make assumptions about topical trends emerging in the public Twitter debate. In order to talk about trends, or at least trending topics, it is essential to capture longitudinal data, making it possible to observe for example the rising frequency of specific hashtags or hashtag combinations over time.
It should also be noted that there are certain limitations associated with hashtag-based approaches, which have al-ready been discussed in the literature. These critics usually emphasize the concern that a concentration on hashtags might exclude a good amount of other Twitter messages on the same topic. Bruns and Burgess [4] for example hint at the self-selecting mechanism of hashtags and believe that hashtag-based analyses Bcover only the tip of a communicative iceberg^while other users respond to hashtagged tweets with-out including this hashtag in their replies. They also point with-out
that hashtag research crucially depends on the existence of a widely adopted hashtag term. Thus, there is always a remain-ing uncertainty that tracked data based on a selected hashtag missed out on alternatives contributing to the same discussion [5], a fact also Jungherr adds for consideration [25].
B o t h c r i t i c s a r e j u s t i f i e d t o a c e r t a i n e x t e n t . Concentrating on a specific hashtag to capture a public Twitter debate will probably always exclude some mes-sages contributing to the same topic without using this hashtag. Still, the hashtag-based approach is an easy and effective way to capture at least a good part of the debate
–and, what is even more important, to capture that part of the discussion which is consciously contributed by know-ing and usknow-ing a specific hashtag. Especially in the case of identifying central actors in the debate, this part is obvious-ly the most interesting. Regarding the other critical point, the author tried to reduce the risk of potentially selecting the wrong hashtag or ignoring important alternatives by conducting a pre-analysis described in chapter 4.1.
The question, of whether Twitter data is representative of a population, was answered before and can be answered again with a simpleBno^. This is the reason that previous attempts such as election prognosis were doomed to fail. Twitter users are likely to be a bit younger, higher educated, more political and societal interested, and more active in terms of communi-cation. As already stated, a demographic shift from the aver-age is not necessarily a problem as representative data is not essential in order to capture a public debate and to identify central actors within this debate. But the question for repre-sentative data leads to another one, which has to be discussed: Is Twitter data generally biased by PR professionals, spin-doctors or lobbyists?
In fact, this question is a bit more difficult to answer–and it is probably best answered withByes^andBno^. Yes, commu-nication on Twitter is shaped by different users sometimes on behalf of political actors, companies, or organizations trying to push forward their messages, products or opinions. Previous studies reported the potential misuse of Twitter for
Table 5 (continued)
NCDs Determinants Drivers
consumption; advanced age; low education;chemicals and toxic agents
communities; availability of fresh fruit & vegetables; cardio fitness
Obesity genetic inheritance personalized health/gene banks
Respiratory disease(COPD, asthmaetc.)
Emissions;noise;lack of physical activity; financial values; no work-life balance;tobacco; obesity;genetic inheritance;stress; drug consumption; child health/maternal health
Pollution; green city planning;
climate change; social innovations (food, nutrition, care, physical activity); safe environment; monitoring; availability of information air quality
spam and message attacks from political communities or com-panies by using automated scripts or other tactics [28,32]. Must Twitter data therefore generally be seen as biased? No, the value of Twitter data depends largely on the research ques-tion to be answered. In this study it was tried to find out who dominates the debate surrounding NCDs on Twitter (in terms of receiving attention from other users), which subtopics are discussed and what kind of information is spread most fre-quently. This can be examined regardless of motivations driv-ing the discussion.
Foresight practitioners must always be aware of (open or hidden) agendas potentially connected to information sources at different steps of a Foresight. The personal motivations of interview partners, participants of workshops–or information distributers on Twitter for that matter–should be questioned and taken into account, whether they are politicians, scientists, or representatives from corporations, non-profit organizations or civil society. Nevertheless, one of the main goals of any strategic Foresight is to broaden the perspectives on possible future developments by implementing different views, opin-ions and information sources into different phases of a Foresight exercise. In this regard Twitter can and must be seen as a valuable contribution to this process.
This does not mean that other methods like surveys, bibliometric analysis or interviews should be disregarded. Twitter data analysis should rather be seen as one component in the interaction of different methods in order to get a wider spectrum and to sharpen the view of the topic under debate. In this regard, the author shares the opinion of Lazer et al. [28] when they consider thatBinstead of focusing on a‘big data revolution’, perhaps it is time we were focused on an‘all data revolution’, where we recognize that the critical change in the world has been innovative analytics, using data from all tra-ditional and new sources, and providing a deeper, clearer un-derstanding of our worldB.
Thus, research in the future might focus on the integration of Twitter data analysis into a systematic and expedient multi-method approach for Foresight exercises. Another goal could be the development of a comprehensive framework for the use of Twitter in foresight in general–not only as a basis for data analysis at the beginning of a Foresight exercise, but also as a tool for communication during the whole Foresight process, a point which could not be further considered in this study. Twitter provides the opportunity to receive real-time feedback on ideas, to involve potentially large number of participants in a scenario process, and to disseminate the results of a Foresight, building for example on a previous network analy-sis. A comprehensive framework would enable a systematic and interactive use of Twitter in the different phases of strate-gic Foresight.
Acknowledgments This article has been written with grants from the Austrian Institute of Technology (AIT) in Vienna. The research project
„Foresight and Modelling for European Health Policy and RegulationsB(FRESHER) is part of the EU research and innovation pro-gram Horizon 2020.
Open AccessThis article is distributed under the terms of the Creative C o m m o n s A t t r i b u t i o n 4 . 0 I n t e r n a t i o n a l L i c e n s e ( h t t p : / / creativecommons.org/licenses/by/4.0/), which permits unrestricted use, distribution, and reproduction in any medium, provided you give appro-priate credit to the original author(s) and the source, provide a link to the Creative Commons license, and indicate if changes were made.
References
1. Amanatidou E, Butter M, Carabias V, Könnölä T, Leis M, Saritas O, Schaper-Rinkel P, van Rij V (2012) On concepts and methods in horizon scanning: lessons from initiating policy dialogues on emerging issues. Sci Public Policy 39:208–221
2. Anderson P (2007) What is Web 2.0? Ideas, technologies and im-plications for e ducation. http://www.webar chive.org. uk/wayback/archive/20140615231729/http://www.jisc.ac. uk/media/documents/techwatch/tsw0701b.pdf. Accessed 7 November 2015
3. Brösamle K, Buehler I, Döhrn J, Huber C (2013) Government foresight in Deutschland: Ansätze, Herausforderungen und Chancen. Stiftung Neue Verantwortung, Impulse 7/13
4. Bruns A, Burgess J (2012) Notes towards the scientific study of public communication on Twitter. In: Science and the Internet. Düsseldorf University Press, Düsseldorf, pp 159–169
5. Bruns A, Stieglitz S (2014) Twitter data: what do they represent? it. Inform Technol 56(5):240–245
6. Castillo C, Mendoza M, Poblete B (2011) Information credibility on twitter. In: Proceedings of the 20th international conference on World Wide Web. Hyderabad, India
7. Castillo C, Mendoza M, Poblete B (2013) Predicting information credibility in time-sensitive social media. Internet Res 23(5):560– 588
8. Cook CN, Inayatullah S, Burgman MA, Sutherland WJ, Wintle BA (2014) Strategic Foresight: How planning for the unpredictable can improve environmental decision-making. Trends Ecol Evol 29(9): 531–541
9. Delaney K (2012) A practical guide: Introduction to horizon scan-ning in the public sector. https://innovation.govspace.gov. au/files/2014/08/PublicSectorInnovationToolkitHorizonScanning Module2014.pdf. Accessed 7 November 2015
10. Ebner M, Reinhardt W (2009) Social networking in scientific con-ferences: Twitter as tool for strengthen a scientific community. In: Proceedings of the 1st International Workshop on Science 2.0 for TEL at the 4th European Conference on Technology Enhanced Learning (EC-TEL'09). Nice, France
11. Ebner M, Mühlburger H, Schaffert S, Schiefner M, Reinhardt W, Wheeler S (2010) Getting granular on twitter: tweets from a con-ference and their limited usefulness for non-participants. In: Reynolds N, Turcsányi-Szabó M (eds) Key competencies in the knowledge Society, vol 324. Springer, Berlin, pp 102–113 12. Ebner M (2013) The influence of Twitter on the academic
environ-ment. In: Patrut B, Patrut M, Cmeciu C (ed) Social media and the new academic environment: pedagogical challenges, IGI Global, pp 293-307
14. Frank MR, Mitchell L, Dodds PS, Danforth CM (2013) Happiness and the patterns of life: A study of geolocated Tweets. Sci Rep 3(2625). doi:10.1038/srep02625
15. Gayo-Avello D (2012) No, you cannot predict elections with Twitter. IEEE Internet Comput 16(6):91–94. doi:10.1109/MIC.2012.137
16. Giesecke S, Uhl A (2015) Foresight and the wicked problem of participation. Presentation at the World Conference of Futures Research, 11-12 July, Turku, Finlandhttps://futuresconference2015. files.wordpress.com/2015/06/andre-uhl.pdf. Accessed 13 October 2015
17. Göllner J, Klerx J, Mak K (ed)(2015) Wissensmanagement im ÖBH: Foresight in der strategischen Langfristplanung. In: Schriftenreihe der Landesverteidigungsakademie. Vienna, Austria 18. Grosseck G, Holotescu C (2010) Microblogging multimedia-based
teaching methods best practices with Cirip.eu. Proc–Soc Behav Sci 2(2):2151–2155
19. Grosseck G, Holotescu C, Patrut B (2013) Academic perspectives on microblogging. In: Patrut B, Patrut M, Cmeciu C (ed) Social media and the new academic environment: Pedagogical challenges, IGI Global, pp 308-341
20. Hansen D, Shneiderman B, Smith M (2011) Analyzing social me-dia networks with NodeXL: insights from a connected world. Morgan Kaufmann, Burlington
21. He Y, Saif H, Wei Z, Wong KF (2012) Quantising opinions for political tweets analysis. In: LREC 2012, Eighth International Conference on Language Resources and Evaluation, 21-27 May 2012. Istanbul, Turkey
22. Horton A (1999) A simple guide to successful foresight. Foresight 1(1):5–9
23. Himelboim I, McCreery S, Smith M (2013) Birds of a feather tweet together: integrating network and content analyses to examine cross-ideology exposure on Twitter. J Comput Mediat Commun 18:154–174
24. Java A, Finin T, Song X, Tseng B (2007) Why we twitter: Understanding microblogging usage and communities. Paper pre-sented at the Proceedings of the Joint 9th WEBKDD and 1st SNA-KDD Workshop. San Jose, CA, USA
25. Jungherr A, Jürgens P (2013) Forecasting the pulse. how deviations from regular patterns in online data can identify offline phenomena. Internet Res 23(5):589–607
26. Jungherr A (2015) Analyzing political communication with digital trace data: the role of Twitter messages in social science research. Springer, Berlin
27. Kayser V, Bierwisch A (2015) Using Twitter for foresight: an op-portunity? Paper presented at The XXVI ISPIM Conference– Shaping the Frontiers of Innovation Management on 14-17 June 2015. Budapest, Hungary
28. Lazer D, Kennedy R, King G, Vespignani A (2014) The parable of Google Flu: Traps in big data analysis. Science 343:1203–1205 29. Li Y, Qian M, Jin D, Hui P, Vasilakos AV (2015) Revealing the
efficiency of information diffusion in online social networks of microblog. Inf Sci 293:383–389
30. Lotan G, Graeff E, Ananny M, Gaffney D, Pearce I, Boyd D (2011) The revolutions were tweeted: Information flows during the 2011 Tunesian and Egyptian revolutions. Int J Comm 5:1375–1405. doi: 1932–8036/2011FEA1375
31. Mustafaraj E, Metaxas P (2010) From obscurity to prominence in minutes: political speech and real-time search. In: Proceedings of the WebSci10: Extending the Frontiers of Society On-Line, April 26-27th, 2010. Raleigh, NC, USA
32. Paci A, Ritchkoff A-C (2014) Best practices of horizon scanning in research organisations. In: 5thInternational Conference on Future-Oriented Technology Analysis (FTA)–Engage today to shape to-morrow, 27-28 November 2014. Brussels, Belgium
33. Palomino MA, McBride G, Mortimer H, Owen R, Depledge M (2013) Optimizing web-based information retrieval methods for horizon scanning using relevance feedback. In: Proceedings of the 2013 Federated Conference on Computer Science and Information Systems, pp 1139–1146. Krakow, Poland
34. Pang A-K (2010) Social scanning: improving futures through Web 2.0; or, finally a use for Twitter. Futures 42:1222–1230
35. Raford N (2014) Online foresight platforms: evidence for their im-pact on scenario planning & strategic foresight. Technol Forecase Soc 97:65–76
36. Ratkiewicz J, Conover MD, Francisco M, Goncalves C, Flammini A, Menczer F (2011) Political polarization on Twitter (2011) In: Proceedings of 5th International AAAI Conference on Weblogs and Social Media, 7-11 August. San Francisco, CA, USA, pp 297–304
37. Reinhardt W, Ebner M, Beham G, Costa C (2009) How People are using Twitter during conferences. In: Hornung-Prähauser V, Luckmann M (ed) Creativity and innovation competencies on the web. Proceedings of 5th EduMedia conference. Salzburg, Austria, pp 145-156
38. Sandoval-Almazan R, Gil-Garcia JR (2014) Towards cyberactivism 2.0? understanding the use of social media and other information technologies for political activism and social movements. Gov Inform Q 31:365–378
39. Schatzmann J, Schäfer R, Eichelbaum F (2013) Foresight 2.0: def-inition, overview & evaluation. Eur J Futures Res 1(1):1–15. doi:10.1007/s40309-013-0015-4
40. Schoen H, Gayo-Avello D, Metaxas P, Mustafaraj E, Strohmaier M, Gloor P (2013) The power of prediction with social media. Internet Research 23(5):528–543
41. Shamma D A, Kennedy L, Churchill EF (2009) Tweet the debates: Understanding community annotation of uncollected sources. Presented at SIGMM workshop on social media. Bejing, China 42. Smith A, Brenner J (2012) Twitter use 2012. Pew Research
Center’s Internet & American Life Project.http://pewinternet. org/Reports/2012/Twitter-Use-2012.aspx. Accessed 25 August 2015
43. SST (2015) http://stt.nl/english-2/#horizonscan. Accessed 29 September 2015–Link nicht mehr aktuell
44. TAB Büro für Technikfolgen-Abschätzung beim Deutschen Bundestag (2014) Horizon Scanning: Ein strukturierter Blick ins Ungewisse. TAB-Brief 43:14–18
45. Takhteyev Y, Gruzd A, Wellman B (2012) Geography of Twitter Networks. Soc Networks 34(1):73–81
46. Wassermann S, Faust K (1994) Social network analysis: methods and applications. Cambridge University Press, Cambridge 47. Weitzel L, de Oliveira JPM, Quaresma P (2014) Measuring the