A Multilevel Model of Interpersonal Trust and Protest
Participation
Matthew S. Winters
Columbia University
[email protected]
Paper Prepared for Presentation at the 2008 Annual Meeting
of the American Political Science Association
Abstract
Explaining political participation is a challenging endeavor. For decades, political science
has wrestled with the question of why people turnout to vote when an individual’s vote is
so likely to be inconsequential (Downs, 1957; Riker and Ordeshook, 1968; Aldrich, 1993).
The rational choice argument is that the costs of learning about an election and then going
to the polls are surely greater than the expected benefits of doing so, since one’s vote will
only change the outcome of an election in the event of a tie. Similarly, it is unclear why
individuals would opt to join in costly acts of political protest given that there is only a
very small likelihood of their personal participation yielding the desired result of the protest,
while there is perhaps a much greater potential cost to such participation.
Over time, the literature has come to regard certain individual characteristics as
impor-tant predictors of participation: individuals who are more educated, wealthier, older or more
religious are more likely to participate in politics in one fashion or another (Verba, Schlozman
and Brady, 1995). Individuals embedded in social networks are also more inclined toward
political participation (Lake and Huckfledt, 1998). The most recent work has proposed that
there might be a genetic predisposition toward political participation (Fowler, Baker and
Dawes, 2008). The current paper builds on recent work by Michelle Benson and Thomas
Rochon (2004). These authors propose that levels of interpersonal trust might contribute to
individual willingness to participate in protests. The authors hypothesize “that a high level
of trust should make individuals more likely to anticipate low expected costs of
participa-tion while leading to optimistic estimates of the potential benefits of protest” (Benson and
Rochon, 2004, 437). Using data from the 1990 wave of the World Values Survey, the authors
find evidence that interpersonal trust does correlate positively with protest action. Using
an index of protest participation and a multinomial logistic regression model, they find that
trust matters increasingly as individuals consider more extreme forms of protest action.
In this paper, I briefly summarize Benson and Rochon’s reasons for arguing that
in-terpersonal trust will predict more intense protest action at the individual level, and I
down the multilevel structure of their data, exploring the variation that we see across
coun-tries first in a series of individual-level regressions broken down by country and then in a
multilevel model. The multilevel model confirms the earlier finding—that individuals with a
greater amount of interpersonal trust are more likely to participate in protest actions—and
provides some evidence that the effect was more pronounced in the 1990 World Values
Sur-vey data among more free countries. I also provide evidence that challenges their claim that
trust matters increasingly as the magnitude of protest action increases. This paper presents
only a preliminary analysis, and much additional work remains to be done to explore this
relationship in more depth and also in more recent data.
1
Interpersonal Trust and Protest
In his bookCollective Action and the Civil Rights Movement, Dennis Chong (1991) challenges
the idea that a straightforward cost-benefit analysis can explain individual participation in
social movements. He concedes that, because social movements aim to provide public goods
(e.g. a clean environment, women’s rights), rational individuals should find themselves in
prisoner’s dilemma situations when asked to participate in some sort of social movement
action: although the end result that might be produced if everyone participated is desirable,
fearing that others will not participate, each individual should decide herself not to
partic-ipate. As per Mancur Olson (1971), a common argument is that this prisoner’s dilemma
situation should be alleviated as group size decreases. Chong, however, points out that the
incentive to not participate in a risky protest action also can be alleviated as group size
in-creases. He portrays protest as an assurance game in which a larger number of participants
creates a greater amount of assurance for any individual participant that (1) the goal of the
protest might be realized and that (2) the threat of retaliation against any particular protest
participant is less.
likely to participate in protests, the crux of Benson and Rochon’s theoretical argument is that
“trusting individuals will be more likely than less trusting individuals to deem movement
participation safe and worthwhile” (Benson and Rochon, 2004, 437). Relying on theoretical
literature on social capital (e.g. Coleman, 1990), the authors assert that trusting individuals
will make more resolute cost-benefit calculations. That is, if someone is a trusting
indi-vidual and they believe that the expected benefits from a protest action will outweigh the
potential costs from that action, they will have less uncertainty about that calculation and
therefore more willingness to engage in the action. Benson and Rochon are careful to note
that trustingness is only one characteristic that contributes to an individual’s decision
re-garding protest participation—level of grievances, available resources, specific interpersonal
connections and fear of government sanctions or retaliation all matter—but on average, they
assert, more trusting individuals will be more likely than less trusting individuals to engage
in protest actions.
In addition, the authors argue that this effect will increase as the scale of the protest
action increases. In the case of signing a petition—where the fear of retaliation is relatively
low—being a trusting individual is likely to have little effect on one’s decision, whereas for
a more serious action, like participating in an illegal strike or occupying a factory, where
there is more uncertainty in the cost-benefit calculation, Benson and Rochon argue that
trustingness will alleviate some of this uncertainty, leading trusting individuals to engage
in the action where untrusting individuals will not. Although I confirm their main finding
that trusting individuals are more likely to participate in protest, I provide evidence that
this effect does not increase across categories of protest action. The relationship between
being a trusting individual or not and protest participation is relatively consistent across all
2
Data on Trust and Protest Participation
Benson and Rochon (2004) use data from the 1990 wave of the World Values Survey (WVS).
They use individual-level observations from 33 countries.1 The authors operationalize the
outcome variable, protest participation, as a six-category Guttman-scaled variable based on
a series of WVS questions asking respondents whether or not they have ever (1) signed a
petition, (2) joined a boycott, (3) attended a lawful demonstration, (4) joined an unofficial
(wildcat) strike or (5) occupied a building or factory. According to Benson and Rochon,
they use a perfect Guttman scaling in which an individual receives a five if and only if she
has signed a petition, joined a boycott, attended a lawful demonstration, participated in
a wildcat strike and occupied a building. It is not clear from the text of the article how
observations are coded when an individual has participated only in some intermediate action.
(That is, if an individual has attended a lawful demonstration but never joined a boycott
or signed a petition, then she should not—according to a perfect Guttman scale—score a
three on the dependent variable, but it is not clear what score she should be given instead.)
Therefore, in my attempt to replicate Benson and Rochon’s main findings (2004: table 1),
I show results both using the perfect Guttman scaling—dropping from the dataset all cases
where there is not a perfect score on less extreme actions—and also using a variable where
the individual is given the score for the most extreme action in which they have participated.
In subsequent sections of the paper, I will prefer this latter coding, as it does not necessitate
dropping observations from the dataset. Using the latter coding also improves the efficiency
of some of the estimates.
The main explanatory variable of interest is trust. Benson and Rochon operationalize
trust using the WVS question asking individuals if they felt that generally speaking, “most
1Argentina, Austria, Belgium, Brazil, Bulgaria, Canada, Chile, Denmark, Estonia, Finland, France,
Brazil Latvia
Portugal
Chile
France Nigeria Argentina Hungary
Estonia
South Africa
Bulgaria Lithuania Poland Austria Germany Mexico Belgium
Spain Italy India Russia Japan
Iceland
U.K.
Ireland
U.S.
Canada
Netherlands
Denmark Finland Norway Sweden
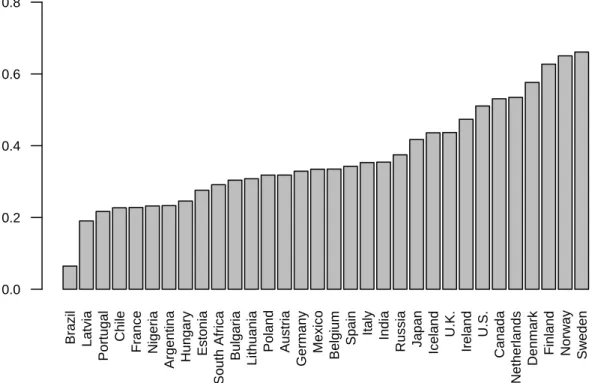
National Level of Trust
1990 World Values Survey
Percent Respondents Described as Trusting
0.0 0.2 0.4 0.6 0.8
Figure 1: Variation Across Countries in the Outcome Variable. Percentage of
people answering that “most people can be trusted.”.
people can be trusted” or that “you cant be too careful in dealing with people”; the former
answer is coded as one and the latter answer is coded as zero. Citing Putnam’s (2000) claim
that “an individual’s level of trust is relative stable throughout his or her lifetime” (Benson
and Rochon, 2004, 440, n.5), the authors argue that this single question sufficiently separates
trusters from non-trusters. Figure (1) shows the variation across countries in the percentage
of people answering that “most people can be trusted.”
As control variables, the original study includes age, gender, education level and
Ingle-hart’s (1997) four-item index of postmaterialism (WVS variable y002), since “individuals
with postmaterialist value orientations are much more likely to engage in protest than
article, education is measured as a 10-point scale based on the respondent’s answer to the
question about the age at which they finished school: those 12 or younger receive a 1, and
those 21 or older receive a 10, with the remaining points of the scale filled-in for the
inter-vening years. My replication attempts, however, cause me to question whether or not this
is really the way that Benson and Rochon (2004) operationalize this variable. Finally, they
also include a national-level measure of freedom based on the Freedom House index. It is
not clear from the article if the authors use the political rights component, the civil liberties
component, or an average of the two. In my replication results, I use an average of the two.
3
Approximate Replication of the Original Study
Benson and Rochon (2004) use a multinomial logistic regression model to examine the impact
of trust and the other covariates on each of the protest actions. Using the constraint that
the parameter vector for the first outcome (i.e. no protest activity) is equal to zero in order
to obtain identification, the model can be written as:
P r(yi = 0|xi) =
1
1 +PJ
j=2exp(xiβj)
P r(yi =m|xi) =
exp(xiβm)
1 +PJ
j=2exp(xiβj)
for m >0
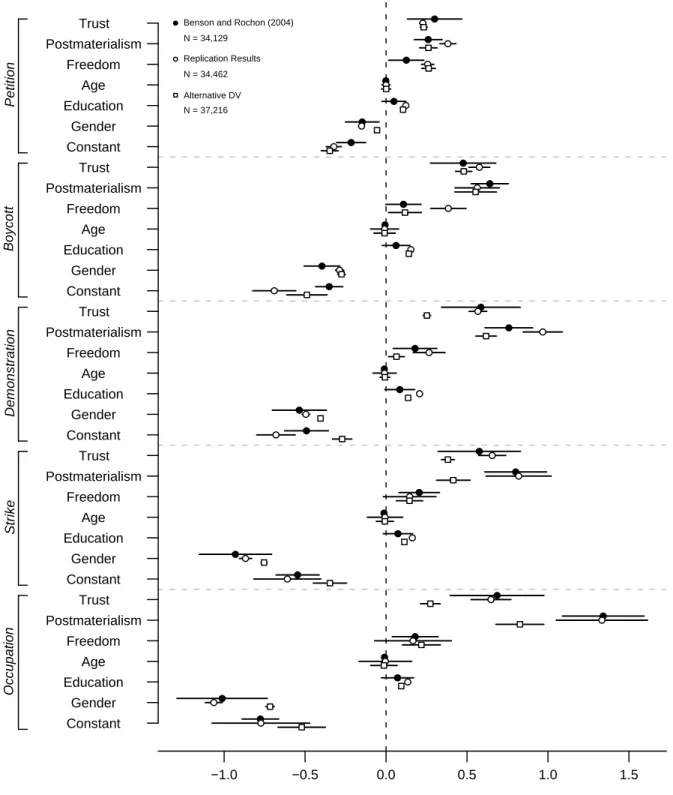
I have not been able to precisely replicate their results. Figure (2), therefore, plots the
coefficient estimates and standard errors as reported in table (1) of Benson and Rochon
(2004), as well as my replication results using both the perfect Guttman scale coding of the
outcome variable and the alternative, highest-level-of-protest coding. Looking at the first
two models—their original results and mine using the perfect Guttman scale—there is a
great deal of similarity among the point estimates, even though I cannot perfectly replicate
the magnitude of the coefficient increases in size with the intensity of the protest action. The
same is true of the postmaterialism index. The national-level variable freedom is positive
and significant in most specifications.2 Gender is coded one for men and two for women;3 the
coefficient estimates suggest that women are less likely to participate in protest as compared
to men.
The biggest distinction between the original results and the first replication model is that,
whereas Benson and Rochon (2004) consistently achieve statistically significant estimates on
the age variable and insignificant estimates on the education variable,4 I obtain the opposite:
consistently significant estimates for the effect of education and consistently insignificant
estimates for the effect of age. I suspect that this has something to do with the coding of
the education variable.
When I use the highest-level-of-protest outcome variable instead of the perfect Guttman
scale—as in the third model presented in figure (2)—the magnitude of a number of the
pa-rameter estimates attenuate toward zero. Note also that the standard errors of the estimates
for this outcome variable tend to be smaller. For the reason stated above—that this
imper-fect Guttman scale retains observations in the dataset that are lost with a perimper-fect Guttman
coding—I believe that this coding of the outcome variable is superior, and the increased
efficiency of the estimators would seem to support this claim.5
The point estimate magnitudes for both the trust variable and the postmaterialism index
decrease. In terms of the trust variable, the point estimates under this alternative
specifica-tion of the outcome variable challenge the claim in Benson and Rochon (2004) that trust has
an increasing effect on the probability of protest participation as the protest action being
2And where the significance level is different, it may be due to the fact that I have not used robust
standard errors clustered by country as Benson and Rochon do.
3I maintain this coding here for the purpose of replication. Below, I turn this into a 0/1 indicator for
female.
4They discuss this “interesting and somewhat unexpected result” in the article (Benson and Rochon,
2004, 447-448).
5Again, because Benson and Rochon (2004) use robust standard errors clustered by country, the
● ● ● ● ● ● ● ● ● ● ● ● ● ● ● ● ● ● ● ● ● ● ● ● ● ● ● ● ● ● ● ● ● ● ●
−1.0 −0.5 0.0 0.5 1.0 1.5
Constant Gender Education Age Freedom Postmaterialism Trust Constant Gender Education Age Freedom Postmaterialism Trust Constant Gender Education Age Freedom Postmaterialism Trust Constant Gender Education Age Freedom Postmaterialism Trust Constant Gender Education Age Freedom Postmaterialism Trust ● ● ● ● ● ● ● ● ● ● ● ● ● ● ● ● ● ● ● ● ● ● ● ● ● ● ● ● ● ● ● ● ● ● ●
● Benson and Rochon (2004) N = 34,129
● Replication Results N = 34,462 Alternative DV N = 37,216
Petition
Boycott
Demonstration
Strike
Occupation
Figure 2: Coefficient Plot for Mulitnomial Logistic Regressions. Dots
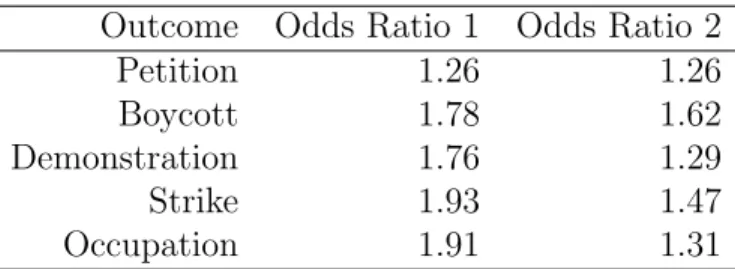
Outcome Odds Ratio 1 Odds Ratio 2
Petition 1.26 1.26
Boycott 1.78 1.62
Demonstration 1.76 1.29
Strike 1.93 1.47
Occupation 1.91 1.31
Table 1: Odds Ratio on Trust from Models with Different Outcome
Vari-ables. The first column is the odds ratio from the model using the perfect Guttman scale
as the outcome variable, and the second column is the odds ratio from the model using highest-level-of-protest as the outcome variable.
considered becomes more extreme. In this model, the coefficient for trust is largest in the
parameter vector referring to whether or not an individual will participate in a boycott, the
second of the five protest actions.
The odds ratios—the odds of someone who is trusting as compared to someone who is
not trusting, holding all other variables at their mean values—for the two replication models
are presented in table (1). These figures again make obvious that, when using the
highest-level-of-protest outcome variable as compared to the perfect Guttman scale, the change in
odds is not monotonically increasing in the magnitude of the protest action and also is of a
consistently smaller magnitude.
3.1
Ordered Logistic Regression
Although Benson and Rochon (2004) make use of a multinomial logistic regression model, the
outcome variable categories have a clear order to them, suggesting that an ordered logistic
regression model might be preferable.6 The ordered logistic model assumes that there is an
unobserved latent variable, zi—in this case, the highest tolerable degree of protest—that
determines the category into which a given individual sorts. A series of cut-points,cm, exist
to distinguish the categories. The latent variable model looks like this:
6On the other hand, as discussed below, a multinomial logistic regression model is preferable—even for
yi =
no protest if − ∞ ≤zi < c1 petition if c1 ≤zi < c2
boycott if c2 ≤zi < c3 demonstration if c3 ≤zi < c4 strike if c4 ≤zi < c5 occupation if c5 ≤zi <∞
zi =xiβ+i
Since we only observeyi, the model is evaluated using the difference between the
cumula-tive density function defining the probability of observing a certain outcome, assuming that
follows a logistic distribution:
P r(yi =m|xi) = Λ(cm−xiβ)−Λ(cm−1−xiβ)
where Λ() is the cumulative density function for a logistic distribution.
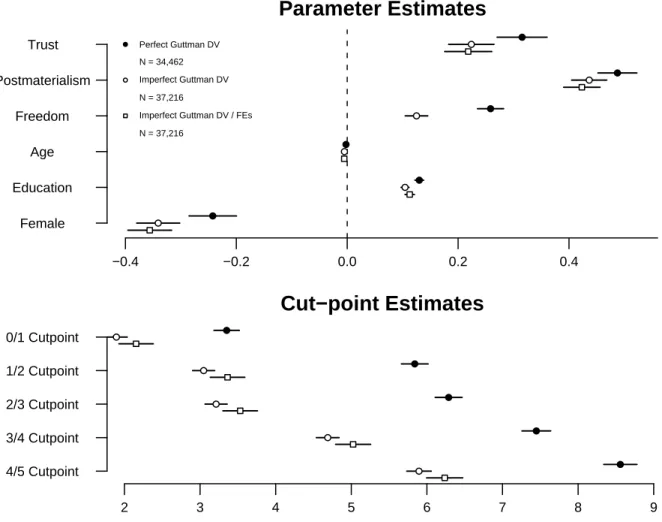
Figure (3) shows the parameter and cut-point estimates for three different ordered logistic
regression models. The first uses the perfect Guttman scale as the outcome variable, whereas
the second and the third use the highest-level-of-protest scale. The first and second models
include the country-level freedom variable, whereas the third model includes country fixed
effects instead. (As can be seen, the coefficient estimates change minimally when the country
fixed effects are used instead of the country-level freedom variable.)
The parameter estimates in all three models are consistent with those from the
multi-nomial logistic regression above. Interpersonal trust and postmaterialist values both have
a significant positive impact on the likelihood of protest participation, as does the level of
freedom in a country. In these models,both age and education level are significant with older
people being less likely to participate in protest actions, and more educated people being
●
●
●
●
●
●
Parameter Estimates
−0.4 −0.2 0.0 0.2 0.4
Female Education
Age Freedom Postmaterialism
Trust ●
●
●
●
●
●
● Perfect Guttman DV
N = 34,462
● Imperfect Guttman DV N = 37,216
Imperfect Guttman DV / FEs N = 37,216
●
●
●
●
●
Cut−point Estimates
2 3 4 5 6 7 8 9
4/5 Cutpoint 3/4 Cutpoint 2/3 Cutpoint 1/2 Cutpoint 0/1 Cutpoint ●
●
●
●
●
Figure 3: Coefficient Plot for Ordered Logistic Regressions. Dots represent
As compared to the multinomial logistic regression, the ordered logistic regression does
not allow us to observe any movement in the parameter estimates across categories. The
cut-point estimates, however, suggest that an individual’s latent willingness to participate in
a protest goes through several stages. This willingness must increase to a certain point for an
individual to be willing to sign a petition, and then it must further increase for an individual
to be willing to join a boycott. However, citizens who are willing to participate in a boycott
essentially are also willing to participate in a demonstration. (That is, the cut-points from
these two categories are barely distinguishable.) For an individual to participate in a wildcat
strike, there again needs to be a significant increase in their willingness to protest, and to
occupy a building or factory takes another additional boost.
That the coefficients do not vary by category is known as the parallel regression
assump-tion. Speaking in terms of the latent variable—the willingness to protest—this assumption
says that being female has the same impact on an individual’s likelihood of joining a boycott
if she already is a petition-signer as on an individual’s likelihood of taking part in a strike
if she already is willing to take part in demonstrations. That is, the increase in the odds of
participating in one action due to a certain characteristic does not depend on the category
in which an individual currently finds herself. The multinomial logistic model, on the other
hand, allowed variables to have different effects on the odds for different outcome categories.
The claim that the effect of trust on participation depends on the outcome category under
consideration is, in effect, a claim that the parallel regression assumption is violated. As I
show above, there is some evidence for this when using the perfect Guttman scaling of the
outcome variable but less evidence when using the highest-level-of-protest coding.
In sum, my analysis generally replicates the main result of the original Benson and Rochon
(2004) article. In all of the models above, I reproduce the finding that interpersonal trust
correlates positively with protest participation. This finding holds both in my replication
of the multinomial logistic regression that they use and in an ordered logistic regression.
trust and protest participation increases in magnitude with the intensity of the protest action.
When I use the highest-level-of-protest outcome variable, which I argue is a more correct
measurement of individual protest participation, I find that trust has an equivalent effect on
the likelihood of protest participation across almost all categories of protest.
Is this relationship consistent across countries? In their original analysis, the authors
use only pooled data—taking information from all 32 countries and combining it in a single
regression model. However, it is possible that the relationship may exist only in some of the
countries included in the WVS data. Therefore, in the following section, I use a series of
ordered logistic regression models to look at individual country-by-country regression results
in order to gain a sense of how much variation there is in the trust-protest relationship across
countries. Then, in the following section, I model country-level variation in the context of
pooled data using a series of multilevel models.
4
Country-by-Country Results
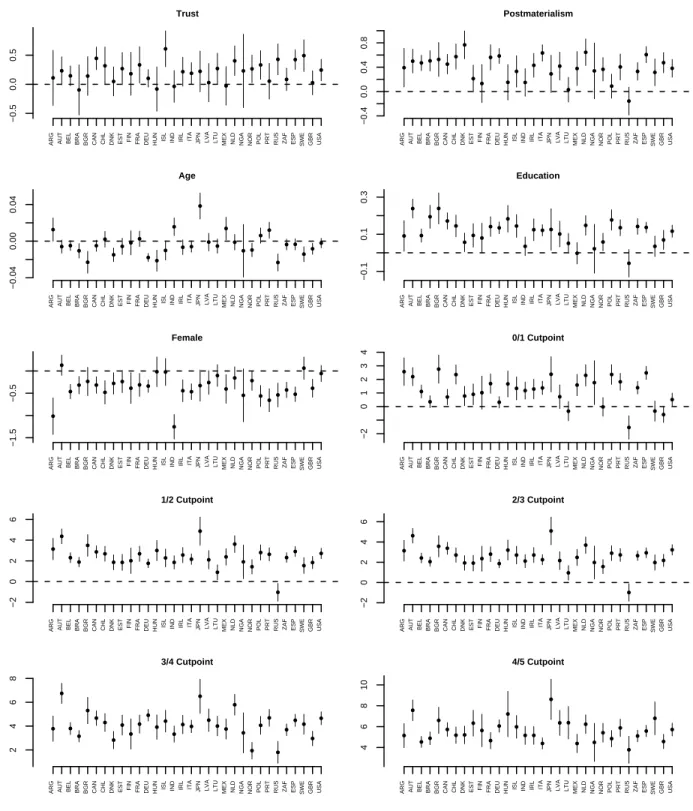
In order to get a sense of how much variation there is across countries in these relationships, I
run individual ordered logistic regressions of the protest participation index on the
explana-tory variables in each of the countries in the data. (For obvious reasons, I cannot include the
freedom variable in these single country regressions.) The results are summarized in figure
(4).
When the data is not pooled into a single regression, there is significantly more
uncer-tainty in the estimation of the relationship between trust and protest participation. Although
the coefficient estimate is almost always positive, it is statistically significant only in
one-third of the countries included in the analysis.7 This does not provide disconfirming evidence
with regard to the claim that trust positively predicts protest participation; it does,
how-ever, show the advantages of pooling together the data to obtain a more precise coefficient
7Canada, France, Iceland, Italy, Lithuania, the Netherlands, Norway, Poland, Russia, Spain, Sweden and
● ● ● ● ● ● ● ● ● ● ● ● ● ● ● ●● ● ● ● ● ● ● ● ● ● ● ● ● ● ● ● Trust
ARG AUT BEL BRA BGR CAN CHL DNK EST FIN FRA DEU HUN ISL IND IRL ITA JPN LVA LTU MEX NLD NGA NOR POL PRT RUS ZAF ESP SWE GBR USA
−0.5 0.0 0.5 ● ●● ● ● ● ● ● ● ● ●● ● ● ● ● ● ● ● ● ● ● ● ● ● ● ● ● ● ● ● ● Postmaterialism
ARG AUT BEL BRA BGR CAN CHL DNK EST FIN FRA DEU HUN ISL IND IRL ITA JPN LVA LTU MEX NLD NGA NOR POL PRT RUS ZAF ESP SWE GBR USA
−0.4 0.0 0.4 0.8 ● ●● ● ● ● ● ● ● ● ● ● ● ● ● ●● ● ● ● ● ● ● ● ● ● ● ●● ● ● ● Age
ARG AUT BEL BRA BGR CAN CHL DNK EST FIN FRA DEU HUN ISL IND IRL ITA JPN LVA LTU MEX NLD NGA NOR POL PRT RUS ZAF ESP SWE GBR USA
−0.04 0.00 0.04 ● ● ● ● ● ● ● ● ● ● ●● ● ● ● ●● ● ● ● ● ● ● ● ● ● ● ●● ● ● ● Education
ARG AUT BEL BRA BGR CAN CHL DNK EST FIN FRA DEU HUN ISL IND IRL ITA JPN LVA LTU MEX NLD NGA NOR POL PRT RUS ZAF ESP SWE GBR USA
−0.1 0.1 0.3 ● ● ● ● ●● ● ●● ● ●● ● ● ● ●● ● ● ● ● ● ● ● ● ● ● ● ● ● ● ● Female
ARG AUT BEL BRA BGR CAN CHL DNK EST FIN FRA DEU HUN ISL IND IRL ITA JPN LVA LTU MEX NLD NGA NOR POL PRT RUS ZAF ESP SWE GBR USA
−1.5 −0.5 ● ● ● ● ● ● ● ●● ● ● ● ● ● ● ●● ● ● ● ● ● ● ● ● ● ● ● ● ● ● ● 0/1 Cutpoint
ARG AUT BEL BRA BGR CAN CHL DNK EST FIN FRA DEU HUN ISL IND IRL ITA JPN LVA LTU MEX NLD NGA NOR POL PRT RUS ZAF ESP SWE GBR USA
−2 0 1 2 3 4 ● ● ● ● ● ● ● ●● ● ● ● ● ● ● ● ● ● ● ● ● ● ● ● ●● ● ● ● ● ● ● 1/2 Cutpoint
ARG AUT BEL BRA BGR CAN CHL DNK EST FIN FRA DEU HUN ISL IND IRL ITA JPN LVA LTU MEX NLD NGA NOR POL PRT RUS ZAF ESP SWE GBR USA
−2 0 2 4 6 ● ● ● ● ●● ● ●● ● ● ● ● ● ● ● ● ● ● ● ● ● ● ● ●● ● ●● ● ● ● 2/3 Cutpoint
ARG AUT BEL BRA BGR CAN CHL DNK EST FIN FRA DEU HUN ISL IND IRL ITA JPN LVA LTU MEX NLD NGA NOR POL PRT RUS ZAF ESP SWE GBR USA
−2 0 2 4 6 ● ● ● ● ● ● ● ● ● ● ● ● ● ● ● ●● ● ● ● ● ● ● ● ● ● ● ● ● ● ● ● 3/4 Cutpoint
ARG AUT BEL BRA BGR CAN CHL DNK EST FIN FRA DEU HUN ISL IND IRL ITA JPN LVA LTU MEX NLD NGA NOR POL PRT RUS ZAF ESP SWE GBR USA
2 4 6 8 ● ● ● ● ● ● ● ● ● ● ● ● ● ● ● ● ● ● ●● ● ● ● ● ● ● ● ● ● ● ● ● 4/5 Cutpoint
ARG AUT BEL BRA BGR CAN CHL DNK EST FIN FRA DEU HUN ISL IND IRL ITA JPN LVA LTU MEX NLD NGA NOR POL PRT RUS ZAF ESP SWE GBR USA
4
6
8
10
Figure 4: Coefficient Plot for Country-by-Country Ordered Logistic
Re-gressions. Dots represent coefficient estimates, and lines represent 95 percent confidence
estimate and also presents the possibility that the relationship between trust and protest
participation might vary across countries.
The country-by-country regressions strongly confirm the relationship between
postmate-rialism and protest participation and generally support the relationships for age, education
and gender found in the pooled data, although in five countries the reverse relationship
between age and protest participation seems to hold: in Argentina, India, Japan, Mexico
and Portugal, older people are more likely to participate in more extreme forms of protest.
Japan consistently has a notably high cut-point for any protest action above signing a
peti-tion, suggesting that only select individuals participate in the more intense forms of protest
activity there. Russia, on the other hand, has consistently low cut-points, suggesting that
many people surveyed for the 1990 WVS engaged in petition-signing, boycotts and
demon-strations. (This finding is somewhat surprising given that the data was collected before the
final dissolution of the Soviet Union.)
Given this evidence of variation in these relationships, it seems appropriate to more
directly model the multilevel structure of the data and investigate the country
characteris-tics that correlate with variation in the individual-level parameters within a given country.
Ideally, this would be done using a multilevel ordered logistic regression model. However,
because of current computational constraints8, I instead use, in the following section, a series
of regular logistic regressions across the ordered categories.
5
Multilevel Analysis
One approach to modeling ordered categorical data is to use a series of logistic regressions
with the outcome variable increasingly dividing the data in a given direction. In this case,
I use a series of five logistic regressions in which I distinguish survey respondents who have
participated in some form of protest from those who have not participated in any form of
8Using R and either WinBUGS or OpenBUGS, I have been unable to run even a multilevel ordered
protest, then those who have participated in a boycott or a more extreme form of protest from
those who have only signed a petition or have not participated at all, then those who have
participated in a demonstration or a more extreme form of protest from those who have only
boycotted or signed a petition or not participated at all, then those who have participated
in a strike or an occupation from all others and finally those who have participated in an
occupation from all others. Using this set of five logistic regressions, I am able to run both
classical and multilevel models and compare the results to those from the multinomial logistic
regression on which Benson and Rochon (2004) base their claims.
The estimating equation for the classical logistic regression models is
P r(yi = 1) =logit−1(α+x0iβ)
where xi is a vector of individual-level (and possibly country-level) characteristics.
For the multilevel models, I present results for both intercept and
varying-intercept/varying-slope models. The estimating equation for the varying-intercept models
is
P r(yi = 1) = logit−1(αj[i] +x
0
iβ)
αj = z0jγ+j
and for the varying-intercept/varying-slope models is
P r(yi = 1) = logit−1(αj[i] +x
0
iβj[i])
αj = z0jγ+j
where zj and rj are vectors of country-level characteristics. (They are named differently
to suggest that they do not necessarily need to include the same variables.) j and νj are
normally distributed country-level errors.
For the models in this section, I have used the same set of variables as in the regressions
above, except that I have standardized the age variable by subtracting the mean and dividing
by two standard deviations. This puts it on a scale comparable to the dichotomous variables
in the model.
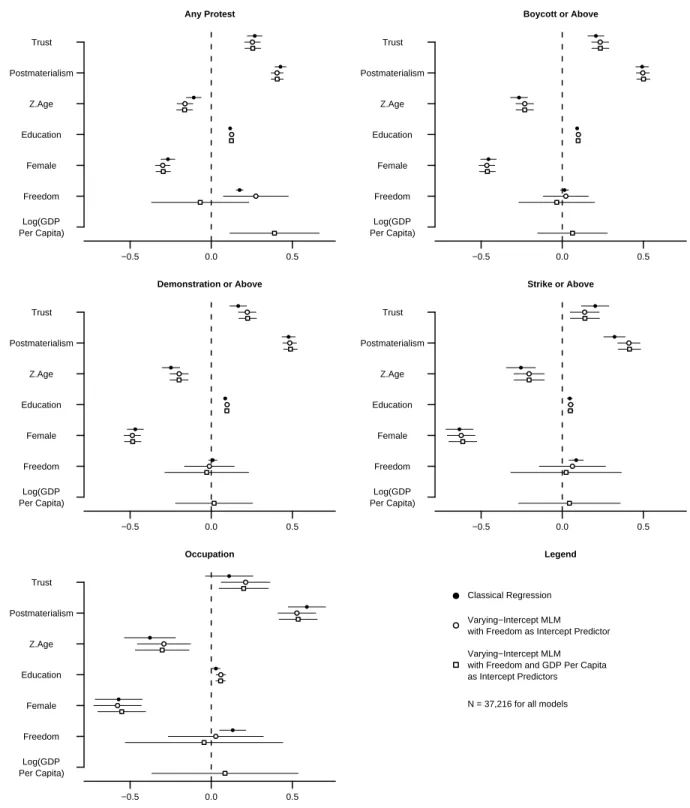
Figure (5) displays coefficient estimates from five classical logistic regressions, five
varying-intercept multilevel logistic regressions in which freedom is used as a country-level predictor
of the varying intercept and five varying-intercept models with both freedom and GDP per
capita as intercept predictors. The coefficient point estimates are very similar across the
three models, as we would expect. (In fact, if anything, we see more variation than we
would anticipate.) The most substantial change is to the significance level on the freedom
variable. Whereas freedom obtains statistical significance at the 95 percent level in three of
the five classical regressions (similar to its consistent statistical significance in the Benson
and Rochon (2004) model), once it has been correctly specified as a country-level variable, it
obtains statistical significance only in one of the five multilevel models. Specifically, whereas
the level of freedom in a country is a positive predictor of individuals partaking in any sort
of protest, it is not a significant predictor of individuals moving from one form of protest to
another. This result contrasts with the consistently significant positive effect of freedom on
participation found in Benson and Rochon (2004).
The third model demonstrates that the freedom variable also can be made to lose
signif-icance as an intercept predictor for all levels of protest by controlling for a country’s level
of development. When GDP per capita is included as an intercept predictor, it obtains
statistical significance and is a positive predictor of a country’s intercept in the logistic
re-gression predicting the probability of participating in any protest action; freedom meanwhile
● ● ● ● ● ● Any Protest
−0.5 0.0 0.5 Log(GDP Per Capita) Freedom Female Education Z.Age Postmaterialism Trust ● ● ● ● ● ● ● ● ● ● ● ●
Boycott or Above
−0.5 0.0 0.5 Log(GDP Per Capita) Freedom Female Education Z.Age Postmaterialism Trust ● ● ● ● ● ● ● ● ● ● ● ●
Demonstration or Above
−0.5 0.0 0.5 Log(GDP Per Capita) Freedom Female Education Z.Age Postmaterialism Trust ● ● ● ● ● ● ● ● ● ● ● ●
Strike or Above
−0.5 0.0 0.5 Log(GDP Per Capita) Freedom Female Education Z.Age Postmaterialism Trust ● ● ● ● ● ● ● ● ● ● ● ● Occupation
−0.5 0.0 0.5 Log(GDP Per Capita) Freedom Female Education Z.Age Postmaterialism Trust ● ● ● ● ● ● Legend
● Classical Regression
● Varying−Intercept MLM
with Freedom as Intercept Predictor Varying−Intercept MLM with Freedom and GDP Per Capita as Intercept Predictors
N = 37,216 for all models
Figure 5: Coefficient Plot for Classical and Multilevel Logistic
Regres-sions. Dots represent coefficient estimates, and lines represent 95 percent confidence
significant predictor in any of the other four regressions (and freedom remains insignificant
in these regressions).
The results presented in figure (5) also confirm the general findings with regard to age,
gender and education from other models. Women are increasingly less likely to participate
in a protest action as the magnitude of the action increases. The changes in other variables
across the five cut-points is minimal.
Figure (6) presents the fixed effect estimates from a varying-intercept/varying slope model
in which I use freedom as a country-level predictor of both the intercept and the slope on the
truth variable. Because the value of the coefficient estimate for trust varies by country, I do
not report it in figure (6); instead, these estimates can be found in figure (7). As we would
expect, the coefficient estimates here are the same as in the varying-intercept model with
only freedom as an intercept predictor in figure (5). The key result to note is that freedom is
also a significant positive predictor of the size of the country slope for the no protest versus
any protest and petitioning versus more extreme protest regressions. (The significance level
is p < .10 for the first regression.) That is, the relationship between trust and protesting—
the size of the coefficient on the trust variable—is increasing in the level of freedom in the
country for these two categories. Also, as compared to the changes to freedom as an intercept
predictor upon the introduction of GDP per capita as a second intercept predictor, when the
country’s level of development is introduced as a second slope predictor, the effect of freedom
remains largely unchanged in the second through fifth regressions—in the first regression,
the inclusion of GDP per capita does cause freedom to lose all significance.
The relationship between a country’s level of freedom and the slope on the trust variable
can be seen in figure (7), where I plot the coefficient estimates for all countries in increasing
order of the country’s freedom score. For the first and second regressions, there is a clear
positive trend in the point estimate of the trust coefficient as the level of freedom in a
country increases. This pattern also exists to a lesser extent in the third regression (which
● ● ● ● ● ● Any Protest
−0.6 −0.4 −0.2 0.0 0.2 0.4 0.6 Log(GDP Per Capita) (Slope) Freedom (Slope) Freedom (Intercept) Female Education Z.Age Postmaterialism ● ● ● ● ● ● ● ● ● ● ● ● ●
Boycott or Above
−0.6 −0.4 −0.2 0.0 0.2 0.4 0.6 Log(GDP Per Capita) (Slope) Freedom (Slope) Freedom (Intercept) Female Education Z.Age Postmaterialism ● ● ● ● ● ● ● ● ● ● ● ● ●
Demonstration or Above
−0.6 −0.4 −0.2 0.0 0.2 0.4 0.6 Log(GDP Per Capita) (Slope) Freedom (Slope) Freedom (Intercept) Female Education Z.Age Postmaterialism ● ● ● ● ● ● ● ● ● ● ● ● ●
Strike or Above
−0.6 −0.4 −0.2 0.0 0.2 0.4 0.6 Log(GDP Per Capita) (Slope) Freedom (Slope) Freedom (Intercept) Female Education Z.Age Postmaterialism ● ● ● ● ● ● ● ● ● ● ● ● ● Occupation
−0.6 −0.4 −0.2 0.0 0.2 0.4 0.6 Log(GDP Per Capita) (Slope) Freedom (Slope) Freedom (Intercept) Female Education Z.Age Postmaterialism ● ● ● ● ● ● ● Legend ● Varying−Intercept/Varying−Slope Model with Freedom as Intercept and Slope Predictor
●
Varying−Intercept/Varying−Slope Model with Freedom as Intercept and Slope Predictor and GDP Per Capita as Slope Predictor
N = 37,216 for all models
Figure 6: Coefficient Plot for Multilevel Logistic Regressions. Dots represent
individuals who have joined demonstrations or strikes or occupied a factory). In the fourth
regression, a number of the coefficient estimates have become negative, and in the fifth
regression, the trend in the coefficient estimates appears to be in the opposite direction: the
effect of being a trusting individual on one’s likelihood of occupying a factory decreases as
freedom increases.
The varying-intercept/varying-slope results, then, continue to confirm that more trusting
people are more likely to participate in more extreme forms of protest but add the nuance
that this is increasingly true as the level of freedom in a country increases.
6
Conclusions and Future Research Goals
This paper starts from the conclusion of Benson and Rochon (2004) that more trusting
peo-ple are more likely to participate in political protest. The authors hypothesize that this is
because more trusting people assess the costs and benefits of protest participation with less
uncertainty. In the first section, I approximate their original result using a multinomial
logis-tic model. Changing the definition of the outcome variable leaves the main result unchanged
but does challenge the claim in Benson and Rochon (2004) that the relationship between
trust and participation is greater for more intense forms of protest action. Using an ordered
logistic regression also confirms the main finding that trusting individuals are more likely to
participate in protest actions.
Regressions at the level of individual countries suggest that there is some variation in the
effect of trust across the countries in the dataset. I investigate this variation further using a
series of multilevel models. A varying-intercept model that uses freedom as a country-level
intercept predictor suggests that whereas there is a higher probability of some form of protest
in more free countries, the level of freedom does not help us to distinguish the probability
of one form of protest from another. In addition, once GDP per capita is included as an
● ●● ● ● ● ● ●● ● ●● ● ● ● ● ● ● ● ● ● ● ● ● ●● ● ● ● ● ●● Any Protest
NGA ZAF MEX BGR RUS BRA EST IND LVA LTU ARG CHL HUN POL FRA DEU PRT GBR AUT BEL CAN DNK FIN ISL IRL ITA JPN NLD NOR ESP SWE USA
−0.5 0.0 0.5 ● ●● ● ● ● ● ●● ● ● ● ● ● ● ● ● ● ● ● ● ●● ● ●● ● ● ● ● ● ●
Boycott or Above
NGA ZAF MEX BGR RUS BRA EST IND LVA LTU ARG CHL HUN POL FRA DEU PRT GBR AUT BEL CAN DNK FIN ISL IRL ITA JPN NLD NOR ESP SWE USA
−0.5 0.0 0.5 ● ● ● ● ● ● ● ● ● ● ● ● ● ● ● ● ● ● ● ● ● ● ● ● ● ● ● ● ● ● ● ●
Demonstration or Above
NGA ZAF MEX BGR RUS BRA EST IND LVA LTU ARG CHL HUN POL FRA DEU PRT GBR AUT BEL CAN DNK FIN ISL IRL ITA JPN NLD NOR ESP SWE USA
−0.5 0.0 0.5 ● ● ● ● ● ● ● ● ● ● ● ● ● ● ● ● ● ● ● ● ● ● ● ● ● ● ● ● ● ● ● ●
Strike or Above
NGA ZAF MEX BGR RUS BRA EST IND LVA LTU ARG CHL HUN POL FRA DEU PRT GBR AUT BEL CAN DNK FIN ISL IRL ITA JPN NLD NOR ESP SWE USA
−0.5 0.0 0.5 ● ●● ● ● ● ● ● ● ● ● ● ● ● ● ● ● ● ● ● ● ● ● ● ● ● ● ● ● ● ● ● Occupation
NGA ZAF MEX BGR RUS BRA EST IND LVA LTU ARG CHL HUN POL FRA DEU PRT GBR AUT BEL CAN DNK FIN ISL IRL ITA JPN NLD NOR ESP SWE USA
−0.5
0.0
0.5
Figure 7: Slope Coefficients on Trust from Multilevel Logistic Regressions.
insignificant even in the logistic regression distinguishing protest participants from total
non-participants.
I use a varying-slope multilevel model to explore what determines the magnitude of the
coefficient on trust. I find that for the model distinguishing protest participants who have
participated in a boycott or participated in a more extreme action from those who have only
signed a petition or not participated at all, freedom is a positive predictor of the size of the
slope coefficient on trust. This effect is robust to the inclusion of GDP per capita as a slope
predictor, although a similar relationship between freedom and the size of the coefficient on
trust in the initial regression distinguishing participants from non-participants is not.
Therefore, I have generally confirmed the main result from Benson and Rochon (2004).
In addition, by using a varying-slope multilevel model, I have added the nuance that the level
of freedom in a country may affect the intensity of the relationship between trust and protest
participation, and by using a superior definition of the outcome variable, I have challenged
their assertion that the relationship between trust and participation is increasing in the
intensity of the protest activity. As this research progresses, I aim to make use of additional
slope predictors to further explore the relationship between trust and political participation,
and I also intend to expand the data to include other years of the World Values Survey to
References
Aldrich, John H. 1993. “Rational Choice and Turnout.” American Journal of Political
Science 37(1):246–278.
Benson, Michelle and Thomas R. Rochon. 2004. “Interpersonal Trust and the Magnitude of Protest: A Micro and Macro Level Approach.” Comparative Political Studies 37(4):435– 457.
Chong, Dennis. 1991. Collective Action and the Civil Rights Movement. Chicago: University of Chicago Press.
Coleman, James S. 1990.Foundations of Social Theory. Cambridge, MA: Harvard University Press.
Downs, Anthony. 1957. An Economic Theory of Democracy. New York: Harper.
Fowler, James H., Laura A. Baker and Christopher T. Dawes. 2008. “Genetic Variation in Political Participation.”American Political Science Review 102(2):233–248.
Inglehart, Ronald. 1997. Modernization and Postmodernization: Cultural, Economic and
Political Change in 43 Societies. Princeton, NJ: Princeton University Press.
Lake, Ronald La Due and Robert Huckfledt. 1998. “Social Capital, Social Networks, and Political Participation.”Political Psychology 19(3):567–584.
Long, J. Scott. 1997. Regression Models for Categorical and Limited Dependent Variables. Thousand Oaks, CA: Sage Publications.
Olson, Mancur. 1971. The Logic of Collective Action: Public Goods and the Theory of
Groups. Cambridge, MA: Harvard University Press.
Putnam, Robert. 2000. Bowling Alone: The Collapse and Revival of American Community. New York: Simon & Schuster.
Riker, William H. and Peter C. Ordeshook. 1968. “A Theory of the Calculus of Voting.”
American Political Science Review62(1):25–42.
Verba, Sidney, Kay Lehman Schlozman and Henry E. Brady. 1995. Voice and Equality: Civic